 Open Access Article
Effect of H3PO4 coordination on vanadium extraction and iron separation in a H2SO4 leaching system
Xuxia Zhao abc,
Yimin Zhang*abc,
Nannan Xue*abc,
Pengcheng Huabc and
Qiushi Zhengabc
aSchool of Resource and Environmental Engineering, Wuhan University of Science and Technology, Wuhan 430081, Hubei Province, China. E-mail: zym126135@126.com; cbdis@aliyun.com
bState Environmental Protection Key Laboratory of Mineral Metallurgical Resources Utilization and Pollution Control, Wuhan 430081, Hubei Province, China
cCollaborative Innovation Center of Strategic Vanadium Resources Utilization, Wuhan 430081, Hubei Province, China
First published on 21st November 2024
Abstract
The selectivity of the full wet leaching process for vanadium extraction using H2SO4 is low, resulting in a high impurity content in vanadium extracted from vanadium-bearing shale. This study focused on vanadium extraction and iron separation from vanadium-bearing shale, involving the coordination of H3PO4 in an H2SO4 leaching system. The effects of the ratio and quantity of H2SO4–H3PO4, leaching time, leaching temperature, and liquid-to-solid ratio on vanadium-bearing shale leaching were investigated. The dissolution processes of various minerals and the mechanism of iron coordination precipitation were analyzed. Results showed that vanadium leaching efficiency was 91.07% and iron leaching efficiency decreased from 84% to 23.86% under optimal leaching conditions—H2SO4-to-H3PO4 ratio of 2![[thin space (1/6-em)]](https://www.rsc.org/images/entities/char_2009.gif) :
:![[thin space (1/6-em)]](https://www.rsc.org/images/entities/char_2009.gif) 1, H+ content of 8 mol kg−1, liquid-to-solid ratio of 0.8 L kg−1, and leaching time of 12 h at 95 °C. Leaching kinetics showed that the leaching process of vanadium shale was a mixed-control process in the H3PO4–H2SO4 leaching system; additionally, the leaching process was mainly controlled by a chemical reaction with an activation energy of 67 kJ mol−1. The preferential dissolution order of minerals in the vanadium-bearing shale was calcite, apatite, magnetite, muscovite, and pyrite. Under the H2SO4–H3PO4 leaching system, the iron content was reduced by inhibiting the dissolution of pyrite and coordination precipitation of Fe3+ with PO43−, thus separating iron and vanadium from the source. This provides guidance for vanadium extraction and impurity separation from vanadium-bearing shale using an all-wet method.
1, H+ content of 8 mol kg−1, liquid-to-solid ratio of 0.8 L kg−1, and leaching time of 12 h at 95 °C. Leaching kinetics showed that the leaching process of vanadium shale was a mixed-control process in the H3PO4–H2SO4 leaching system; additionally, the leaching process was mainly controlled by a chemical reaction with an activation energy of 67 kJ mol−1. The preferential dissolution order of minerals in the vanadium-bearing shale was calcite, apatite, magnetite, muscovite, and pyrite. Under the H2SO4–H3PO4 leaching system, the iron content was reduced by inhibiting the dissolution of pyrite and coordination precipitation of Fe3+ with PO43−, thus separating iron and vanadium from the source. This provides guidance for vanadium extraction and impurity separation from vanadium-bearing shale using an all-wet method.
1 Introduction
Vanadium is a vital strategic resource1 that is widely used in aerospace, catalysis, chemical industries, and flow batteries.2–7 Vanadium-bearing shale is an important vanadium resource that is widely distributed in the Yangtze River basin and accounts for more than 87% of domestic vanadium reserves (approximately 61.88 billion tons) in China.8–10 Primary vanadium-bearing shale is a unique sedimentary system characterized by a high total organic carbon content and numerous trace metals that can be found in a marine environment with low levels of sedimentation.11–13 Redox-sensitive vanadium has a strong reducibility under anoxic conditions and is enriched in the deposited silicate minerals.14–16 The extraction of vanadium from vanadium-bearing shale depends on the structural destruction of layered silicate minerals such as mica.17 Currently, the main technologies used to extract vanadium from vanadium-bearing shale are roasting acid leaching,6,18 which includes the “double cycle” and “one step” methods,19,20 and full wet acid leaching via the addition of a leaching agent aid that contains fluorine.21 With the proposed double-carbon target and the development of a circular economy,22–24 the National Development and Reform Commission issued the “Non-ferrous metal smelting industry energy saving and carbon reduction reform and upgrading implementation guide (Development and Reform Industry No. 200 [2022])”, which required the development of green common key technologies to save energy and reduce the carbon and pollution levels. Therefore, high-temperature oxidation acid leaching of vanadium-bearing shale was limited because of its carbon emissions, and the full wet leaching technology with green and low-carbon extraction was advocated.During the acid leaching process, the mica structure is dissolved to release vanadium by the dehydroxylation of hydrogen ions using a binary strong acid (H2SO4).25 H2SO4 that exhibits low selectivity in the leaching process resulted in competition to dissolve acid-soluble minerals in vanadium-bearing shale into the solution, particularly the iron-bearing minerals, influencing the subsequent purification and enrichment. Many studies have been conducted on the removal of impurities during vanadium purification and enrichment, and some progress has been made. Because the Fe2+-extracting capability of the di-(2-ethylhexyl) phosphoric acid (D2EHPA) extractant is weak, reducing agents, such as sodium sulfite and sodium thiosulfate, were added during the solvent extraction stage to reduce Fe3+ to Fe2+, and facilitate the separation of vanadium and iron.26–29 However, the separation of iron and vanadium is uncontrollable because of various factors, including the content of the target elements.
Some studies have proposed methods for separating impurities from their sources. The addition of potassium sulfate and potassium phosphate to the slag phase forms yavapaiite and iron phosphate as precipitates under an oxygen-pressure leaching system, resulting in the separation of impurities from the vanadium source.30–32 In addition, organic acids are introduced as vanadium extraction leaching agents in roasting-acid leaching because of their strong complexation with metal ions, which can effectively remove iron impurities.33 Therefore, incorporating precipitation in the leaching process is a feasible method for separating impurities from the source. However, these studies were based on an oxygen-pressure acid leaching system and a roasting acid leaching system, and the introduction of potassium sulfate and an oxalic acid leaching system to a fully wet direct acid leaching system was not sufficient.
H3PO4 is a ternary medium-strong acid. The PO43− ion has a strong coordination ability, can interact with many metal ions,34 and is widely used as a complex acid for metal ion extraction.35,36 Zhang et al. leached aluminum and lithium directly from tailings using a complex acid containing sulfuric acid and H3PO4.37 Owing to the selective coordination of H3PO4, Liu et al. leached molybdenum from different molybdenum calcine compositions using a complex acid containing H3PO4 and nitric acid.38 In particular, PO43− and Fe3+ can be coordinated to form stable complexes. This trait was exploited by Xia et al.39 to prepare FePO4 via a liquid-phase method at 80 °C. Therefore, a fully wet complex acid-leaching system that can use the highly ionized hydrogen ions of H2SO4 and the precipitating ability of coordination acids to extract vanadium and remove impurities was proposed in this study.
In this study, vanadium was efficiently extracted using a complex acid containing H3PO4 and H2SO4; additionally, the Fe content was reduced from the source via coordination precipitation. The effects of the ratio and quantity of H2SO4–H3PO4, leaching time, temperature, and liquid–solid ratio on vanadium-bearing shale leaching were investigated. The dissolution processes of various minerals and the mechanism of iron coordination precipitation were analyzed. The H3PO4–H2SO4 leaching system separated vanadium and iron from the source utilizing Fe3+ coordinating with PO43−, which provides guidance for vanadium extraction and impurity reduction using an all-wet method from vanadium-bearing shale.
2 Experimental
2.1 Materials
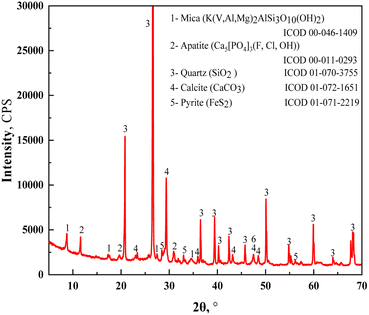
The vanadium-bearing shale used in this study was collected from the Hubei province in China and pulverized to a grain size of 0–3 mm before use. The composition of chemical elements is listed in Table 1. The V2O5 grade was 0.72 wt%, whereas the Al2O3 and Fe2O3 contents were 8.99 wt% and 3.52 wt%, respectively. The mineral phases showed that the vanadium-bearing shale was mainly composed of quartz, mica, calcite, apatite, and pyrite (Fig. 1). The distribution of the main elements of vanadium-bearing shale is listed in Table 2. Vanadium was present in the crystal structure of mica at 94.24 wt%, and in the oxide at 5.76 wt%. Iron was present in pyrite (FeS2), muscovite (Mg/V), magnetite (Fe3O4), hematite (Fe2O3), and szomolnokite (FeSO4·H2O). Acid leaching using a strong acid solution will dissolve these minerals. Pyrite (53.01%) and magnetite (38.64%) are the main minerals that contain iron.| Mineral | V | Fe | Al | Si | Ca | Mg | K |
|---|---|---|---|---|---|---|---|
| Quartz | 70.33 | ||||||
| Muscovite(Mg/V) | 94.24 | 0.86 | 56.85 | 26.44 | 54.03 | 61.18 | |
| Pyrite | 53.01 | ||||||
| Calcite | 69.73 | ||||||
| Magnetite | 38.64 | ||||||
| Hematite | 5.61 | ||||||
| Szomolnokite | 1.55 | ||||||
| Potassium feldspar | 41.33 | 2.64 | 38.56 | ||||
| Gedrite | 1.46 | 0.14 | 8.16 | ||||
| Akermanite | 0.4 | 6.02 | 13.97 | ||||
| Dolomite | 4.97 | 23.04 | |||||
| Anhydrite | 1.96 | ||||||
| Apatite | 15.45 | ||||||
| Vanadium oxide | 5.76 | 0.33 | 0.36 | 0.05 | 1.87 | 0.8 | 0.26 |
| Total | 100 | 100 | 100 | 100 | 100 | 100 | 100 |
2.2 Experiments
First, the 0–3 mm raw ore was divided into two particle sizes of 3–0.6 mm and 0–0.6 mm using a round mesh screen with 0.6 mm in a top strike type vibrating screen machine (HLSDOB-Φ200, Wuhan Hengle Mineral Engineering Equipment Co., Ltd, China). Vanadium-bearing shale (200 g) was fed into a vibrating screen and sifted for 5 min. Thereafter, the activation experiments with varying activation times were performed on the vanadium-bearing shale of two particle sizes. The −3–+0.6 mm particle size was activated for 10 min, whereas the −0.6 mm particle size was activated for 1 min. The activation parameters were as follows: a pulp concentration of 50%, ball-to-pulp ratio of 50![[thin space (1/6-em)]](https://www.rsc.org/images/entities/char_2009.gif) :
:![[thin space (1/6-em)]](https://www.rsc.org/images/entities/char_2009.gif) 1, and NaF activator of 5 wt%. The vanadium-bearing shale was added (500) to a conical ball mill (HLXMQ-Φ150 × 50, Wuhan Hengle Mineral Engineering Equipment Co., Ltd, China). Finally, the two activated vanadium-bearing shales were filtered, dried separately, and mixed at a ratio of 1.75
1, and NaF activator of 5 wt%. The vanadium-bearing shale was added (500) to a conical ball mill (HLXMQ-Φ150 × 50, Wuhan Hengle Mineral Engineering Equipment Co., Ltd, China). Finally, the two activated vanadium-bearing shales were filtered, dried separately, and mixed at a ratio of 1.75![[thin space (1/6-em)]](https://www.rsc.org/images/entities/char_2009.gif) :
:![[thin space (1/6-em)]](https://www.rsc.org/images/entities/char_2009.gif) 1.
1.
The leaching experiments were conducted using a thermostatic oscillator (SHA-2, Jiangsu Jintan Yitong Electronics Co., Ltd). First, the oscillator was heated to a specified temperature between 55 to 95 °C and maintained within ±0.5 °C of the selected temperature. Thereafter, the vanadium-bearing shale (50 g) and a specified quantity of H2SO4 and H3PO4 were added to a 250 mL conical bottle and leached on an oscillating tray for 0.25–14 h at a vibration velocity of 200 rpm. Subsequently, solid and liquid separation of the ore pulp was performed using a vacuum filter to obtain the leaching residue and vanadium-containing leachate.
The vanadium and iron contents of the leachate were determined by ammonium ferric sulfate titration and phenanthroline ultraviolet-visible spectrophotometry, respectively. The leaching efficiencies of vanadium and iron were calculated using eqn (1).12
 | (1) |
2.3 Analytical methods
The chemical compositions of the samples were determined using an inductively coupled plasma optical emission spectrometer (ICP, Horiba Ultima Expert: Agilent ICPOES730, US) with 1.2 kW RF power, 15 L min−1 plasma flow, 0.75 L min−1 nebulizer flow, and 15 s Instr stabilization delay. The mineral phase compositions of the samples were determined using an X-ray diffractometer (XRD, D/MAX-RB; Rigaku, Japan) under Cu Kα radiation with 2θ ranging from 5° to 70° and a scanning rate of 15° min−1. The micromorphology and elemental distribution of the samples were observed using a scanning electron microscope (SEM, JSM-IT300, JEOL, Tokyo, Japan) equipped with an energy dispersive X-ray spectrometer (EDS, OXFORD, Britain). The particle sizes of the samples were measured using a laser particle sizer (ZEN2600, Malvern Instruments Ltd, China) with a 1.52 particle refractive index, 0.1 particle absorption index and water as a dispersant. The specific surface areas of the samples were measured using a static specific surface and aperture analyzer (BET; JW-BK100, China) under the N2 atmosphere. Dissemination patterns of the main components of the vanadium-bearing shale were obtained using an advanced mineral identification and characterization system (MLA, Sigma 300, Quantax 400, and AMICS, Germany) with 1.0 nm @ 15 kV resolution, 3 pA–20 nA probe current, 2–133 Pa low vacuum range, Be(4)–Am(95) element detection range, and 30 mm2 detection chip effective detection area.3 Results and discussion
3.1 Leaching with a complex acid
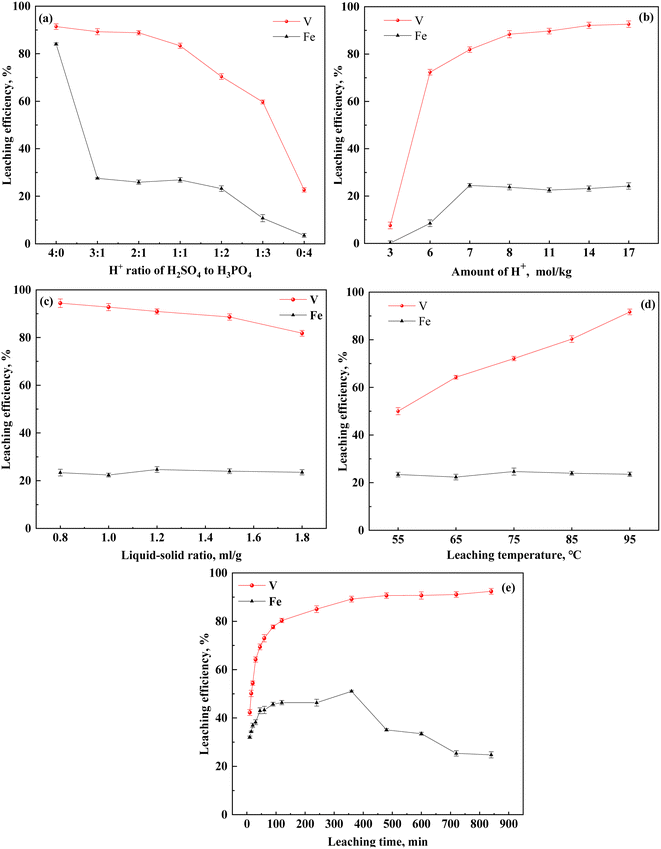
To examine the effect of H2SO4–H3PO4 on the leaching of vanadium-bearing shale, the vanadium extraction and iron separation in vanadium-bearing shale were systematically assessed under the following conditions: varying ratios and quantities of H2SO4–H3PO4, liquid–solid ratios between 0.8–1.8 mL g−1, leaching times of 10–840 min, and temperatures of 55–95 °C (Fig. 2).The effect of increasing the H3PO4 quantity on vanadium-bearing shale leaching was investigated. This was accomplished by maintaining the total quantity of theoretical H+ at 8 mol kg−1 while gradually reducing the amount of H2SO4 and increasing the amount of H3PO4 (Fig. 2(a)). Compared to the single H2SO4 system, the vanadium leaching efficiency was similar for H2SO4–H3PO4 at ratios of 3![[thin space (1/6-em)]](https://www.rsc.org/images/entities/char_2009.gif) :
:![[thin space (1/6-em)]](https://www.rsc.org/images/entities/char_2009.gif) 1 and 2
1 and 2![[thin space (1/6-em)]](https://www.rsc.org/images/entities/char_2009.gif) :
:![[thin space (1/6-em)]](https://www.rsc.org/images/entities/char_2009.gif) 1; additionally, the iron leaching efficiency decreased from 84% to 23.86%, indicating that the H2SO4–H3PO4 complex acid system effectively inhibited iron leaching. As the amount of H3PO4 (1
1; additionally, the iron leaching efficiency decreased from 84% to 23.86%, indicating that the H2SO4–H3PO4 complex acid system effectively inhibited iron leaching. As the amount of H3PO4 (1![[thin space (1/6-em)]](https://www.rsc.org/images/entities/char_2009.gif) :
:![[thin space (1/6-em)]](https://www.rsc.org/images/entities/char_2009.gif) 3) increased, the iron content and vanadium leaching efficiency decreased to 10.79% and 9.69%, respectively. The initial C(H+) of ionization decreased from 2.95 mol L−1 to 0.58 mol L−1 with increasing content of H3PO4 (Table 3). This was related to the difference in ionization between H2SO4 and H3PO4. The ionization equilibria of H2SO4 and H3PO4 are shown in eqn (2)–(6):40
3) increased, the iron content and vanadium leaching efficiency decreased to 10.79% and 9.69%, respectively. The initial C(H+) of ionization decreased from 2.95 mol L−1 to 0.58 mol L−1 with increasing content of H3PO4 (Table 3). This was related to the difference in ionization between H2SO4 and H3PO4. The ionization equilibria of H2SO4 and H3PO4 are shown in eqn (2)–(6):40
| H2SO4 = H+ + HSO4−, Ka1 = 1.0 × 10³ | (2) |
| HSO4− = H+ + HSO42−, Ka2 = 1.0 × 10⁻² | (3) |
| H3PO4 = H+ + H2PO4−, Ka1 = 7.6 × 10⁻³ | (4) |
| H2PO−4 = H+ + HPO42−, Ka2 = 6.3 × 10⁻⁸ | (5) |
| HPO42− = H+ + PO43−, Ka3 = 4.4 × 10⁻¹³ | (6) |
| H+ molar ratio | 4![[thin space (1/6-em)]](https://www.rsc.org/images/entities/char_2009.gif) : :![[thin space (1/6-em)]](https://www.rsc.org/images/entities/char_2009.gif) 0 0 |
3![[thin space (1/6-em)]](https://www.rsc.org/images/entities/char_2009.gif) : :![[thin space (1/6-em)]](https://www.rsc.org/images/entities/char_2009.gif) 1 1 |
2![[thin space (1/6-em)]](https://www.rsc.org/images/entities/char_2009.gif) : :![[thin space (1/6-em)]](https://www.rsc.org/images/entities/char_2009.gif) 1 1 |
1![[thin space (1/6-em)]](https://www.rsc.org/images/entities/char_2009.gif) : :![[thin space (1/6-em)]](https://www.rsc.org/images/entities/char_2009.gif) 1 1 |
1![[thin space (1/6-em)]](https://www.rsc.org/images/entities/char_2009.gif) : :![[thin space (1/6-em)]](https://www.rsc.org/images/entities/char_2009.gif) 2 2 |
1![[thin space (1/6-em)]](https://www.rsc.org/images/entities/char_2009.gif) : :![[thin space (1/6-em)]](https://www.rsc.org/images/entities/char_2009.gif) 3 3 |
4![[thin space (1/6-em)]](https://www.rsc.org/images/entities/char_2009.gif) : :![[thin space (1/6-em)]](https://www.rsc.org/images/entities/char_2009.gif) 0 0 |
|---|---|---|---|---|---|---|---|
| pH values | −0.47 | −0.17 | −0.09 | 0.1 | 0.15 | 0.24 | 0.29 |
| C(H+) (mol L−1) | 2.95 | 1.48 | 1.23 | 0.79 | 0.71 | 0.58 | 0.50 |
| Vanadium leaching efficiency (%) | 91.42 | 89.26 | 88.83 | 83.35 | 70.4 | 59.69 | 22.66 |
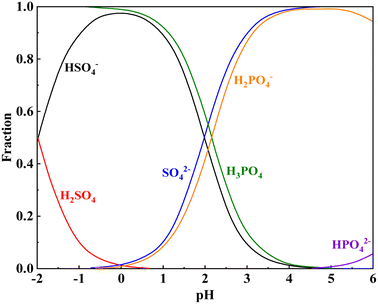
The Ka1 of H2SO4 is 1000, indicating that it is a strong electrolyte that fully ionizes in water. The Ka1 of H3PO4 is lower than the Ka2 of H2SO4. This indicates that H2SO4 preferentially ionizes in the complex acid system of H2SO4–H3PO4, whereas H3PO4 gradually ionizes and releases hydrogen ions after a specified quantity of the ionized hydrogen ions of H2SO4 is consumed during the leaching process (Fig. 3). Table 4 shows the intercalation relationships between mica and other minerals at different degrees of dissociation. Muscovite is primarily coated with quartz, potassium feldspar, calcite, diaspores, pyrite, and other minerals. During the leaching process, the minerals outside these cores must be dissolved before additional free muscovite surfaces can be released. When the hydrogen ion concentration is reduced, these minerals do not fully dissolve, thereby hindering vanadium leaching. Therefore, H2SO4 is required to provide a specified quantity of hydrogen ions, and the synergistic action of H3PO4 enhances the leaching of vanadium-bearing shale.
| Minerals | 0% | 0 < x < 10% | 10 < x < 20% | 20 < x < 30% | 30 < x < 40% | 40 < x < 50% | 50 < x < 60% | 60 < x < 70% | 70 < x < 80% | 80 < x < 90% | 90 < x < 100% | 100% |
|---|---|---|---|---|---|---|---|---|---|---|---|---|
| Muscovite(Mg/V) | 0 | 5.85 | 14.54 | 24.64 | 34.72 | 44.61 | 54.75 | 64.65 | 74.71 | 84.17 | 93.16 | 100 |
| Quartz | 20.44 | 65.14 | 67.03 | 53.53 | 40.70 | 31.05 | 22.71 | 19.03 | 12.15 | 6.09 | 2.6 | 0 |
| Potassium feldspar | 1.55 | 2.63 | 3.5 | 5.86 | 7.37 | 7.86 | 9.94 | 6.8 | 6.3 | 3.24 | 1.66 | 0 |
| Calcite | 10.83 | 7.27 | 1.95 | 1.47 | 1.08 | 0.8 | 0.31 | 0.4 | 0.11 | 0.12 | 0 | 0 |
| Diaspore | 47.76 | 6.84 | 4.82 | 4.24 | 3.96 | 3.48 | 2.82 | 1.74 | 1.52 | 0.88 | 0 | 0 |
| Pyrite | 1.39 | 0.54 | 0.32 | 0.4 | 0.45 | 0.52 | 0.48 | 0.14 | 0.38 | 0.07 | 0 | 0 |
| Apatite | 2.92 | 1.47 | 0.35 | 0.36 | 0.11 | 0.1 | 0.01 | 0.04 | 0 | 0 | 0 | 0 |
| Akermanite | 1.13 | 0.91 | 0.31 | 0.31 | 0.12 | 0.18 | 0.1 | 0.08 | 0 | 0 | 0 | 0 |
| Vanadium oxide | 0.29 | 0.24 | 0.1 | 0.08 | 0.12 | 0.08 | 0.12 | 0.1 | 0 | 0 | 0 | 0 |
| Anhydrite | 0.38 | 0.15 | 0.17 | 0.17 | 0.11 | 0.07 | 0.04 | 0.03 | 0 | 0 | 0 | 0 |
| Szomolnokite | 0.05 | 0.03 | 0.02 | 0 | 0.03 | 0.01 | 0 | 0 | 0 | 0 | 0 | 0 |
| Magnetite | 0.27 | 0.9 | 0.1 | 0.04 | 0.01 | 0.01 | 0 | 0 | 0 | 0 | 0 | 0 |
| Gedrite | 0.29 | 0.32 | 0.17 | 0.1 | 0.06 | 0.05 | 0.08 | 0 | 0 | 0 | 0 | 0 |
| Dolomite | 1.63 | 0.94 | 0.19 | 0.2 | 0.1 | 0.15 | 0 | 0 | 0 | 0 | 0 | 0 |
| Barite | 0.32 | 0.61 | 0.23 | 0.07 | 0 | 0 | 0.02 | 0 | 0 | 0 | 0 | 0 |
| Hematite | 0.04 | 0.03 | 0.1 | 0.05 | 0.02 | 0 | 0 | 0 | 0 | 0 | 0 | 0 |
| Rutile | 0.01 | 0.07 | 0.03 | 0.01 | 0.05 | 0 | 0.01 | 0 | 0 | 0 | 0 | 0 |
| Unknown | 10.7 | 6.06 | 6.07 | 8.47 | 10.99 | 11.03 | 8.61 | 6.99 | 4.83 | 5.43 | 2.58 | 0 |
| Total | 100 | 100 | 100 | 100 | 100 | 100 | 100 | 100 | 100 | 100 | 100 | 100 |
When the ratio of H2SO4 to H3PO4 was 2![[thin space (1/6-em)]](https://www.rsc.org/images/entities/char_2009.gif) :
:![[thin space (1/6-em)]](https://www.rsc.org/images/entities/char_2009.gif) 1, the total H+ content changed. Additionally, the vanadium leaching efficiency significantly increased from 7.59% to 92.64% with increasing H+ content (Fig. 2(b)). At a low theoretical H+ content (3 mol kg−1), the leaching efficiency of Fe was approximately zero; however, this value gradually increased with increasing H+ content until it attained an equilibrium state. To maintain a high vanadium leaching efficiency of approximately 90%, the H+ content must be greater than 8 mol kg−1. At a H2SO4 to H3PO4 ratio of 2
1, the total H+ content changed. Additionally, the vanadium leaching efficiency significantly increased from 7.59% to 92.64% with increasing H+ content (Fig. 2(b)). At a low theoretical H+ content (3 mol kg−1), the leaching efficiency of Fe was approximately zero; however, this value gradually increased with increasing H+ content until it attained an equilibrium state. To maintain a high vanadium leaching efficiency of approximately 90%, the H+ content must be greater than 8 mol kg−1. At a H2SO4 to H3PO4 ratio of 2![[thin space (1/6-em)]](https://www.rsc.org/images/entities/char_2009.gif) :
:![[thin space (1/6-em)]](https://www.rsc.org/images/entities/char_2009.gif) 1, H+ concentration of 8 mol kg−1 and temperature of 95 °C, the effect of the liquid-to-solid ratio on the leaching efficiency of vanadium and iron was observed (Fig. 2(c)). The liquid-to-solid ratio was negatively correlated to the concentration of hydrogen ions in the leaching agent. Increasing the liquid-to-solid ratio from 0.8 to 1.8 gradually reduced the concentration of hydrogen ions, which reduced the efficiency of vanadium leaching; however, no effect on the iron leaching efficiency was observed. During the solid–liquid phase reaction process, the dispersibility of the ore in the solution must be considered; additionally, the viscosity of the pulp affects the mass transfer of the medium. When the liquid-to-solid ratio was lower than 0.8, the vanadium leaching efficiency decreased.
1, H+ concentration of 8 mol kg−1 and temperature of 95 °C, the effect of the liquid-to-solid ratio on the leaching efficiency of vanadium and iron was observed (Fig. 2(c)). The liquid-to-solid ratio was negatively correlated to the concentration of hydrogen ions in the leaching agent. Increasing the liquid-to-solid ratio from 0.8 to 1.8 gradually reduced the concentration of hydrogen ions, which reduced the efficiency of vanadium leaching; however, no effect on the iron leaching efficiency was observed. During the solid–liquid phase reaction process, the dispersibility of the ore in the solution must be considered; additionally, the viscosity of the pulp affects the mass transfer of the medium. When the liquid-to-solid ratio was lower than 0.8, the vanadium leaching efficiency decreased.
Leaching is a chemical reaction process, and the leaching temperature is an important parameter affecting the rate of the chemical reaction. To determine the effect of leaching temperature on vanadium leaching from vanadium-bearing shale, leaching experiments were conducted at different leaching temperatures and times. The vanadium leaching efficiency increased with increasing leaching temperature (Fig. 2(d) and (e)). When the temperature increased from 55 °C to 95 °C, the vanadium leaching equilibrium efficiency increased from 55.5% to 92.4%, indicating that heated leaching accelerated the dissolution of mica, and high temperatures were conducive to vanadium leaching. Initially, the dissolution of the leaching process was rapid. Thereafter, the rate of the leaching process began to decline after 120 min, attaining equilibrium after 600 min.
3.2 Leaching kinetics of the H3PO4–H2SO4 leaching system
The leaching of vanadium-bearing shale is a complex multiphase reaction process that includes gaseous, solid, and liquid phases. Assuming that the vanadium-bearing shale is a standard spherical particle, the leaching process of the liquid–solid reaction can be described using the shrinking core model.41 The leaching reaction steps of vanadium-bearing shale were as follows: (i) the leaching agent (H2SO4 and H3PO4) diffused to the vanadium-bearing shale surface through the boundary layer, which is an external diffusion process; (ii) H2SO4 and H3PO4 further diffused through the solid film to the surface of the unreacted nucleus, generating insoluble products (CaSO4 and SiO2) and thickening the solid film. Subsequently, the soluble products (V, Fe, Al and K) diffuse through the solid film to the particle surface (internal diffusion process and chemical reaction); and (iii) the soluble product diffuses through the boundary layer into the solution (external diffusion).Based on the diffusion rates of the leaching reaction steps, the leaching kinetics can be divided into chemical reaction control, solid film diffusion control, and mixing control.42,43 Chemical control occurs when the rate of the chemical reaction is the lowest, and the overall rate of reaction depends on the chemical reaction. However, solid film diffusion control occurs when the rate of internal diffusion is the lowest, and the overall rate of reaction depends on internal diffusion. When the rates of the chemical reaction and internal diffusion are low and approximately equal, the leaching process is a mixed control of the two steps.44,45 The kinetic control equations are as follows:
(i) Chemical control reaction:
| kc = 1 − (1 − x)⅓ | (7) |
(ii) Solid film diffusion control
| kpt = 1 − 3(1 − x)⅔ + 2(1 − x) | (8) |
(iii) Mixed control
kmt = ⅓![[thin space (1/6-em)]](https://www.rsc.org/images/entities/char_2009.gif) ln(1 − x) + (1 − x)−⅓ − 1 ln(1 − x) + (1 − x)−⅓ − 1
| (9) |
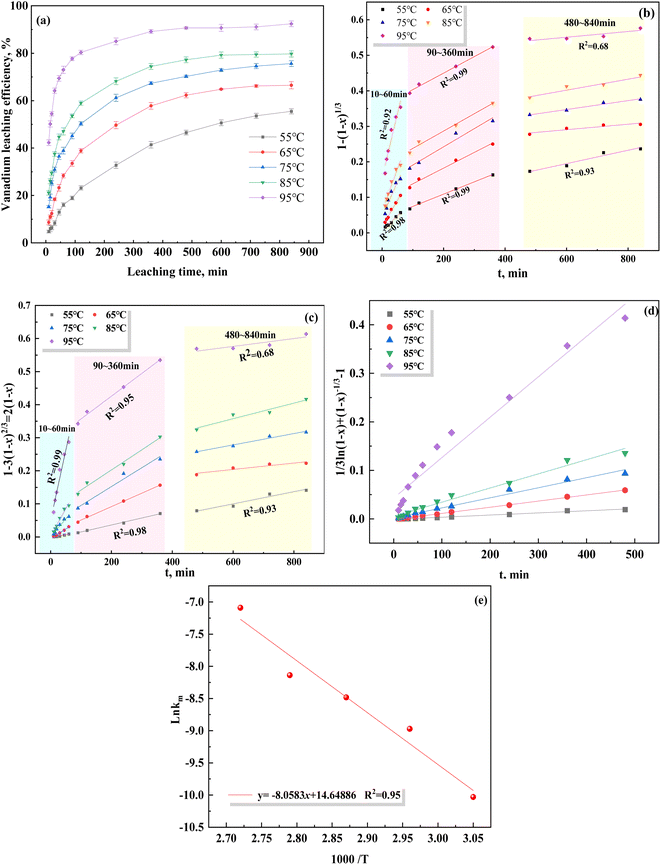
The data shown in Fig. 4(a) were substituted and fitted to eqn (7)–(9), as shown in Fig. 4(b)–(d). The fitting parameters of the reaction rate constant (k) and fitting coefficient (R2) under different control models are listed in Table 5. Based on the R2 values of the different control models, the correlation was the strongest using the mixed control model, indicating that the leaching of vanadium-bearing shale is a mixed control process of solid film diffusion and chemical reaction. The leaching of vanadium-bearing shale can be mainly divided into three stages based on the leaching rates of the different leaching periods (Fig. 4(b) and (c)): a high leaching rate stage of 0–60 min, low leaching rate stage of 90–360 min, and equilibrium leaching stage of 480–840 min. The leaching rate from 0–60 min was due to the solid film diffusion process (R2 = 0.99), whereas the leaching rate from 60–360 min was due to the chemical reaction (R2 = 99).
| Leaching temperature (°C) | Chemical reaction controls | Solid film diffusion controls | Mixed controls | |||
|---|---|---|---|---|---|---|
| kc | R2 | kp | R2 | km | R2 | |
| 55 | 0.000301 | 0.930 | 0.000182 | 0.897 | 0.000044 | 0.987 |
| 65 | 0.000453 | 0.906 | 0.000409 | 0.989 | 0.000127 | 0.998 |
| 75 | 0.000482 | 0.857 | 0.000555 | 0.950 | 0.000207 | 0.982 |
| 85 | 0.000535 | 0.860 | 0.000666 | 0.932 | 0.000292 | 0.980 |
| 95 | 0.000576 | 0.748 | 0.000973 | 0.917 | 0.000833 | 0.963 |
Temperature exhibited a significant influence on vanadium leaching efficiency. Some studies have shown that the heterogeneous reaction with solid film diffusion is not sensitive to the leaching temperature; however, temperature has a significant influence on the control of the heterogeneous chemical reaction.46 Arrhenius proposed a relationship between the activation energy and temperature, which showed that the activation energy (Ea) was the main control point of the leaching process.47 At Ea values greater than 40 kJ mol−1, the rate of the leaching process is controlled by the chemical reaction; however, the solid film diffusion controls the rate of the leaching process at Ea values lower than 12 kJ mol−1, whereas the mixed process controls the rate at Ea values between 12 and 40 kJ mol−1.48 The relationship between the activation energy and temperature is given by eqn (10).
 | (10) |
Based on the relationship between K and the temperature (Fig. 4(e)), the activation energy of vanadium-bearing shale (67 kJ mol−1 (R2 = 0.95)) was determined using eqn (12). Although the chemical reaction and solid film diffusion exerted control over the leaching process of vanadium-bearing shale, the chemical reaction exerted the greatest control because the activation energy was higher than 40 kJ mol−1. During the initial stage of leaching, the concentration of hydrogen ions was high, and the monomer dissociation of mica was large; thus, the rate of the chemical reaction process was high. Vanadium-bearing shale has high viscosity. Additionally, the rate of the diffusion process of the leaching agent to the surface of the mineral particles was low, and the leaching rate was determined by external diffusion. With an increase in leaching time, the continuous dissolution of minerals decreased the viscosity of the pulp, diffusion rate of the leaching agent increased, and concentration of the leaching agent gradually decreased owing to consumption. Undissolved mica was coated with quartz calcite and newly generated calcium sulfate silica and iron phosphate, which hindered the reaction between the leaching agent and mica. When the D80 of vanadium-bearing shale was 40.37 mm, that of the mica particles was 17.23 mm and the liberated muscovite was 6.86% (Fig. 5). The fine dissemination size and low liberation of muscovite reduced the chemical reaction rate.
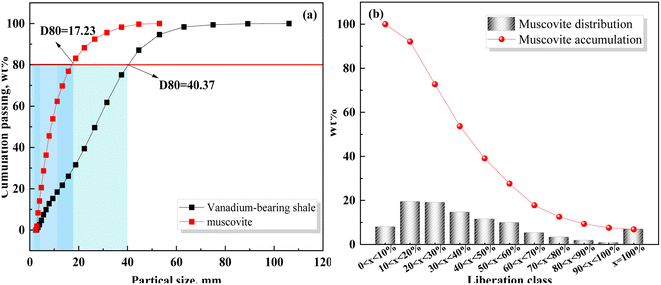 | ||
| Fig. 5 Particle size distribution and liberation of vanadium-bearing shale using MLA ((a) particle size distribution; (b) liberation). | ||
The adsorption curves, specific surface area, and pore size of vanadium-bearing shale before and after leaching (Fig. 6 and Table 6) show that it belongs to the type IV adsorption isotherm with strip-shaped mesopore minerals, which have a single reversible multilayer adsorption process free on the surface of non-porous minerals and porous adsorption with capillary condensation. These properties are conducive to the mass transfer of the leaching agent during the leaching process. After leaching, the leaching residue exhibited a type III isotherm, and the surface interaction with the leaching agent was reduced. In addition, the BET-specific surface area of vanadium-bearing shale decreased from 5 m2 g−1 to 2.15 m2 g−1 after leaching, some larger particles were formed, and the D80 of vanadium shale increased from 202 μm to 215 μm. This indicated that the insoluble products formed during leaching covered the nuclear surface and increased the particle size, hindered the nuclear shrinkage reaction, and reduced the reaction rate. Therefore, analysis of the leaching kinetics showed that a mixed control process occurred; however, the entire leaching process was mainly controlled by chemical reactions.
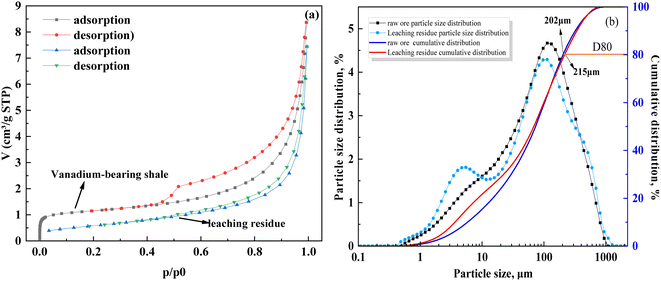 | ||
| Fig. 6 Adsorption, desorption, and particle size distribution curves of vanadium-bearing shale before and after leaching ((a) adsorption and desorption; (b) particle size distribution). | ||
| Samples | BET specific surface area/m2 g−1 | Average pore size/nm | Pore volume/cm3 g−1 |
|---|---|---|---|
| Vanadium-bearing shale | 5.00946 | 9.73166 | 0.0121876 |
| Leaching residue | 2.15005 | 18.3117 | 0.00984277 |
3.3 Mineral dissolution process of vanadium-bearing shale during leaching
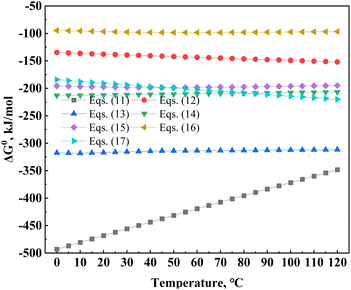
The competitive dissolution reaction of major vanadium, iron, and calcium minerals from vanadium-bearing shale in the acid leaching process occurred as follows.49,50 The reaction standard Gibbs free energies of the chemical reactions of mineral dissolution in the vanadium-bearing shale under the H2SO4 leaching system were calculated by the “Reaction Equations” HSC Chemistry 6 software.The delta Gibbs free energies of several major minerals in vanadium-bearing shale during leaching were compared (Fig. 7). The Gibbs free energies of calcite, hematite, and magnetite were significantly higher than those of pyrite and muscovite. Therefore, the ascending order of mineral dissolution difficulty at a leaching temperature of 95 °C was calcite, hematite, magnetite, muscovite and pyrite. In addition, the delta Gibbs free energy of muscovite increased with an increase in the leaching temperature, which showed that the sensitivity of muscovite to temperature was higher than that of the other compounds, and the leaching process of vanadium was mainly controlled by chemical reactions (Table 7).
| Reaction | ΔGθ/(95 °C, kJ mol−1) | Eqn |
|---|---|---|
| KAl2(AlSi3O10)(OH)2(s) + 10H+(aq) = K+(aq) + 3Al3+(aq) + 3SiO2(s) + 6H2O(aq) | −377.61 | (11) |
| CaCO3(s) + H2SO4(aq) = CaSO4(s) + CO2(g) + H2O(aq) | −148.47 | (12) |
| Ca5[PO4]3(s) + 10H2SO4(aq) = 5CaSO4(s) + 3H3PO4(aq) + H2O(aq) | −312.60 | (13) |
| FeS2(s) + H2SO4(aq)+ = O2(g) = FeSO4(aq) + 2S(s) + H2O(aq) | −208.110 | (14) |
| Fe3O4(s) + H2SO4(aq) + H3PO4(aq) = FeSO4(aq) + FePO4(s) + H2O(aq) | −196.57 | (15) |
| Fe2O3(s) + 3H2SO4(aq) = Fe2(SO4)3(aq) + 3H2O(aq) | −161.75 | (16) |
| CaMg[CO3]2(s) + 2H2SO4(aq) = MgSO4(aq) + CaSO4(s) + 2CO2(g) + 2H2O(aq) | −212.91 | (17) |
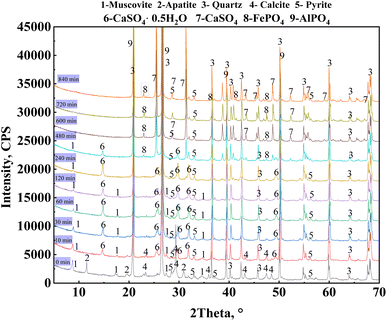
A phase analysis of the leaching residues from the leaching process under optimal leaching conditions was conducted (Fig. 8). The diffraction peaks of the muscovite (0 0 4) and (0 0 8) crystal planes were not observed after leaching for 120 min, whereas those of the (0 0 2) crystal planes were gradually reduced after 480 min of leaching until they were no longer observed. This indicated that mica released vanadium through a layer-by-layer dissolution from the (0 0 a) crystal planes. The diffraction peaks of apatite and calcite were not observed at 10 and 30 min, respectively. The diffraction peak of calcium sulfate hemihydrate (Ca[SO4]·0.5H2O) was observed during the 10–480 min of leaching. This compound was formed by the reaction of calcium ions and sulfate ions after the dissolution of calcium-containing minerals composed mainly of calcite in vanadium shale. After 600 min of leaching, the diffraction peak of calcium sulfate hemihydrate was not observed, but that of anhydrous calcium sulfate (CaSO4) was present. The results showed that calcium sulfate hemihydrate gradually converted into anhydrous H2SO4 as the leaching time increased. During the entire leaching process, a weak diffraction peak of pyrite was observed, indicating that pyrite was not completely leached because it was hindered by the addition of H3PO4. The leaching process of the vanadium-bearing shale was analyzed based on the changes in the functional groups of the leaching residue at different leaching times from 10 to 840 min.
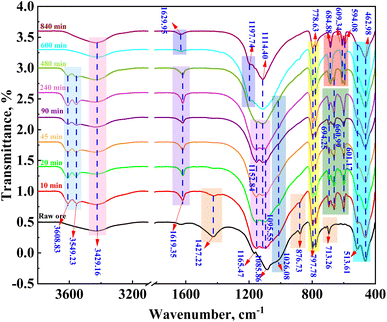
The FTIR absorption peaks of calcite at wave numbers of 1427.22 cm−1, 786.73 cm−1, and 713.26 cm−1 and that of muscovite at 1026.08 cm−1 gradually decreased after 10 min of leaching (Fig. 9). The absorption peak of calcite was not present after 20 min, indicating that calcite was completely dissolved during the 20 min of leaching; however, while the absorption peak of mica was not observed after 480 min. In addition, the absorption vibration peaks of calcium sulfate hemihydrate were observed at 3608.83 cm−1, 3549.23 cm−1, 1619.35 cm−1, 1114.40 cm−1, 601.17 cm−1, and 660.99 cm−1; however, these peaks were not observed after 600 min of leaching, which was consistent with XRD results. The XRD and FTIR patterns and infrared analysis showed that dissolution prioritized apatite, calcite, muscovite, and pyrite, which was consistent with the results of the thermodynamic calculations.
3.4 Dissolution behaviors of muscovite under the PO43−/SO42−/F− ligand system
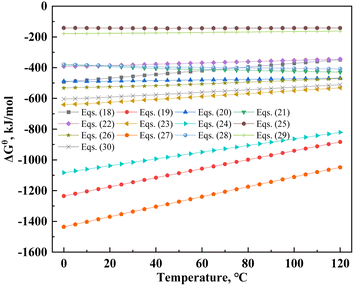
H3PO4 is a ternary medium-strong acid that provides hydrogen ions and degrades the structure of mica with the coordination of aluminum,30 thus promoting vanadium leaching. Table 8 lists the probable dissolution reactions of mica under the H2SO4–H3PO4 complex acid system. Additionally, changes in the standard Gibbs free energy (ΔGθ) of the muscovite dissolution reaction are shown in Fig. 10. The ΔGθ value can represent the effect of entropic driving forces on the reaction.51 The value of ΔGθ is the maximum non-volumetric effort by a closed system at isothermal and isobaric pressure. The lower the ΔGθ value, the greater the degree of reaction; however, this also shows that the system must exert greater non-volumetric effort.52 The ΔGθ values of eqn (18)–(30) are lower than zero; therefore, the dissolution process of mica was spontaneous. In a single acid system, the ΔGθ of HF was higher than that of H3PO4 and H2SO4 (eqn (18), (20) and (21)). According to eqn (19)–(20), (22)–(27), (29) and (30), the greater the completion of the reaction, the lower the ΔGθ value. This indicated that the reaction required greater effort from the system. The descending order of complex acid systems based on their ΔGθ values from eqn (22), (25), (27) and (29) were HF–H2SO4–H3PO4, HF–H3PO4, HF–H2SO4, and H2SO4–H3PO4. Therefore, under the same leaching system, the dissolution reaction of the H2SO4–H3PO4 complex acid system was theoretically superior to that of a single acid system.| Reaction | ΔGθ (95 °C, kJ mol−1) | Eqn |
|---|---|---|
| KAl2(AlSi3O10)(OH)2 + 10HF = KF + 3AlF3 + 3SiO2 + 6H2O | −377.61 | (18) |
| 2KAl2(AlSi3O10)(OH)2 + 24HF = 6AlF3 + K2SiF6 + 5SiO2 + 14H2O | −955.31 | (19) |
| 2KAl2(AlSi3O10)(OH)2 + 10H2SO4 = K2SO4 + 3Al2(SO4)3 + 6SiO2 + 12H2O | −473.24 | (20) |
| 3KAl2(AlSi3O10)(OH)2 + 10H3PO4 = K3PO4 + 9AlPO4 + 9SiO2 + 18H2O | −421.84 | (21) |
| 2KAl2(AlSi3O10)(OH)2 + 2HF + 9H2SO4 = 2KF + 3Al2(SO4)3 + 6SiO2 + 12H2O | −352.52 | (22) |
| 2KAl2(AlSi3O10)(OH)2 + 6HF + 9H2SO4 = 3Al2(SO4)3 + K2SiF6 + 5SiO2 + 14H2O | −554.67 | (23) |
| 2KAl2(AlSi3O10)(OH)2 + 18HF + H2SO4 = K2SO4 + 6AlF3 + 6SiO2 + 12H2O | −873.88 | (24) |
| KAl2(AlSi3O10)(OH)2 + HF + 3H3PO4 = KF + 3AlPO4 + 3SiO2 + 6H2O | −142.60 | (25) |
| 2KAl2(AlSi3O10)(OH)2 + 6HF + 6H3PO4 = 6AlPO4 + K2SiF6 + 5SiO2 + 14H2O | −485.29 | (26) |
| 3KAl2(AlSi3O10)(OH)2 + 27HF + H3PO4 = K3PO4 + 9AlF3 + 9SiO2 + 18H2O | −1126.87 | (27) |
| 2KAl2(AlSi3O10)(OH)2 + 6H3PO4 + H2SO4 = K2SO4 + 6AlPO4 + 6SiO2 + 12H2O | −403.86 | (28) |
| KAl2(AlSi3O10)(OH)2 + HF + 3H2SO4 + H3PO4 = KF + Al2(SO4)3 + AlPO4 + 3SiO2 + 6H2O | −165.73 | (29) |
| 2KAl2(AlSi3O10)(OH)2 + 6HF + 6H2SO4 + 2H3PO4 = 2Al2(SO4)3 + 2AlPO4 + K2SiF6 + 5SiO2 + 14H2O | −531.54 | (30) |
3.5 Coordination precipitation of impurities with H3PO4
The leaching efficiency of iron at different leaching times is shown in Fig. 2(e). Iron leaching efficiency increased with leaching time and gradually decreased after 360 min, indicating that the iron in the vanadium-bearing shale dissolved first and precipitated with the leaching residue with increasing concentration of the solution. The competitive complexation behavior between the main metal ions and anionic coordination in the leaching solution of previous studies is listed in Table 9. The stability constant data available in these studies on complex systems could be obtained at I values of 0.2 and 0.5, where I represents the ionic strength and log![[thin space (1/6-em)]](https://www.rsc.org/images/entities/char_2009.gif) β is the stability constant of the complex. The strength of coordination ability followed the order F− > PO43− > SO42−; additionally, the coordination of F− and Al3+ was stronger than that of Fe3+. The speciation distributions of PO43−, Fe3+ and Fe2+ in the leaching solutions are shown in Fig. 11. Fe3+ was coordinated with PO43− to form FePO4·2H2O in the leaching solution of vanadium-bearing shale (Fig. 11(a) and (b)). Fe2+ was mainly combined with SO42− (Fig. 11(c)), whereas Al3+ was mainly coordinated with F− (Fig. 11(d)).
β is the stability constant of the complex. The strength of coordination ability followed the order F− > PO43− > SO42−; additionally, the coordination of F− and Al3+ was stronger than that of Fe3+. The speciation distributions of PO43−, Fe3+ and Fe2+ in the leaching solutions are shown in Fig. 11. Fe3+ was coordinated with PO43− to form FePO4·2H2O in the leaching solution of vanadium-bearing shale (Fig. 11(a) and (b)). Fe2+ was mainly combined with SO42− (Fig. 11(c)), whereas Al3+ was mainly coordinated with F− (Fig. 11(d)).
![[thin space (1/6-em)]](https://www.rsc.org/images/entities/char_2009.gif) β (25 °C)53–55
β (25 °C)53–55
| Ligand | Metal ion | Reaction | Log![[thin space (1/6-em)]](https://www.rsc.org/images/entities/char_2009.gif) β (25 °C) β (25 °C) |
|---|---|---|---|
| F− (I = 0.5) | Fe3+ | Fe3+ + F− = FeF2+ | 5.28 |
| Fe3+ + F− = FeF2+ | 9.30 | ||
| Fe3+ + F− = FeF3 | 12.06 | ||
| Fe3+ + F− = FeF52- | 15.77 | ||
| Fe2+ | Fe2+ + F− = FeF2 | 0.80 | |
| Al3+ | Al3+ + F− = AlF2+ | 6.13 | |
| Al3+ + F− = AlF2+ | 11.15 | ||
| Al3+ + F− = AlF3 | 15.00 | ||
| Al3+ + F− = AlF4− | 17.75 | ||
| Al3+ + F− = AlF52- | 19.37 | ||
| Al3+ + F− = AlF63- | 19.84 | ||
| PO43− (I = 0.2) | Fe2+ | PO43− + Fe2+ = Fe3(PO4)2 | — |
| Fe3+ | PO43− + Fe3+ = FePO4 | 9.35 | |
| SO42− (I = 0.5) | Fe2+ | SO42− + Fe2+ = FeSO4 | 2.3 |
| Fe3+ | SO42− + Fe3+ = FeSO4+ | 4.04 | |
| SO42− + Fe3+ = Fe2(SO4)3 | 5.38 |
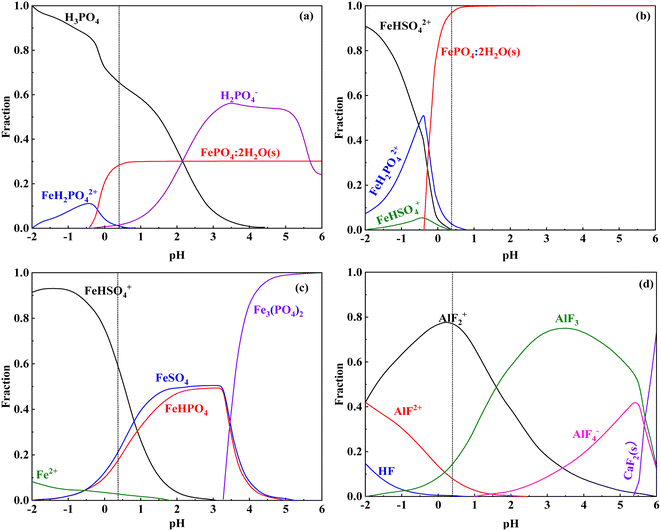 | ||
| Fig. 11 Speciation distribution of PO43− and Fe3+ in the leaching solution ((a) PO43−; (b) Fe3+; (c) Fe2+; (d) F−). | ||
The micromorphology and elemental distribution of the leaching residue were analyzed. Different regions of the leaching residue are shown in Fig. 12(a)–(d). The elemental distribution of pyrite in the leaching residue (Fig. 12(a) and (b)) showed that pyrite cannot be completely leached in the H2SO4–H3PO4 complex acid system. The correlations between P and the elements Fe, O, Si, and Al were favorable (Fig. 12(c) and (d)). This showed that phosphate ions were mainly adsorbed on the surface of silicon dioxide and calcium sulfate by binding with iron and aluminum, indicating that H3PO4 could coordinate and precipitate with dissolved iron ions. The results showed that the leaching efficiency of iron could be reduced by decreasing the leaching dissolution of pyrite and the coordination precipitation of iron ions and phosphates in the complex acid leaching system of sulfur and phosphorus.
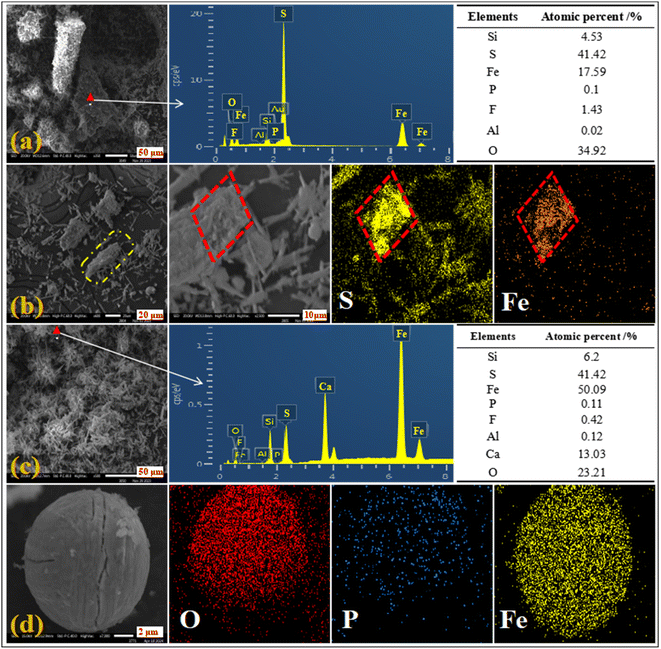 | ||
| Fig. 12 SEM images of the leaching residue of H2SO4–H3PO4 complex acid leaching ((a), (b), (c), and (d) were different position of the leaching residue). | ||
4 Conclusion
This study aimed to utilize the coordination of H3PO4 in an H2SO4 system to selectively leach vanadium and separate iron from vanadium-bearing shale in a fully wet leaching system. Thermodynamic calculations showed that the H2SO4–H3PO4 system was superior to the single H2SO4 system; additionally, the leaching efficiency of vanadium and iron in the former system was higher than that of the latter. Under the following optimal conditions—H2SO4 to H3PO4 ratio of 2![[thin space (1/6-em)]](https://www.rsc.org/images/entities/char_2009.gif) :
:![[thin space (1/6-em)]](https://www.rsc.org/images/entities/char_2009.gif) 1, acid dosage of 8 mol kg−1, liquid-to-solid ratio of 0.8 L kg−1 and leaching time of 12 h at 95 °C—the vanadium leaching efficiency was 91.08%, whereas the iron leaching efficiency decreased from 84% to 23.86%.
1, acid dosage of 8 mol kg−1, liquid-to-solid ratio of 0.8 L kg−1 and leaching time of 12 h at 95 °C—the vanadium leaching efficiency was 91.08%, whereas the iron leaching efficiency decreased from 84% to 23.86%.
Leaching kinetics showed that the leaching process of the vanadium-bearing shale was a mixed-control process in the H2SO4–H3PO4 leaching system. Because of the low dissociation degree of muscovite and the inclusion of gangue minerals, such as quartz, calcite, and apatite, the mass transfer process of the medium was hindered, and the leaching process at 0–60 min was controlled by solid film diffusion. After the dissolution of gangue minerals, the mass transfer rate increased, and the consumption of H+ decreased the dissolution rate of muscovite, which was controlled by the chemical reaction from 60–360 min. The overall leaching process was mainly controlled by the chemical reaction with an activation energy of 67 kJ mol−1. The SiO2 and CaSO4 produced during the leaching process attached to the surface of the mica core increases the particle size and reduces the specific surface area, thus hindering the release of vanadium.
The preferential dissolution order of the minerals in the vanadium-bearing shale was calcite, apatite, magnetite, muscovite, and pyrite. The main effects of the H2SO4–H3PO4 system on iron separation were as follows: the introduction of H3PO4 reduced the content of free H+ in the leaching system and the dissolution of pyrite, and the coordination precipitation of Fe3+ with PO43− reduced the iron content in the leaching solution, resulting in the separation of iron and vanadium from the source. At present, the effect of the complex acid on vanadium extraction and iron separation has been studied. The next step is to optimize the process and reduce the amount of acid, meanwhile investigating the influence of H3PO4 intervention on vanadium purification, enrichment and precipitation.
Data availability
All data included in this study are available from the corresponding author upon request.Conflicts of interest
The authors declare that they have no known competing financial interests or personal relationships that could have appeared to influence the work reported in this paper.Acknowledgements
This study was financially supported by the National Key Research and Development Program of China (2023YFC3903900), Science and Technology Innovation Talent program of Hubei Province (2022EJD002), and National Natural Science Foundation of China (52104311).References
- M. R. Radwany and I. F. Barton, The process mineralogy of leaching sandstone-hosted uranium-vanadium ores, Miner. Eng., 2022, 187, 107811 CrossRef CAS.
- Z. Bai, Y. Sun, X. Xu, J. Jin and Y. Han, A novel process of gradient oxidation roasting-acid leaching for vanadium extraction from stone coal, Adv. Powder Technol., 2024, 35, 104296 CrossRef CAS.
- G. W. Coulston, S. R. Bare, H. Kung, K. Birkeland, G. K. Bethke, R. Harlow, N. Herron and P. L. Lee, The Kinetic Significance of V5 in n-Butane Oxidation Catalyzed by Vanadium Phosphates, Science, 1997, 275, 191–193 CrossRef CAS PubMed.
- K. E. Rodby, R. L. Jaffe, E. A. Olivetti and F. R. Brushett, Materials availability and supply chain considerations for vanadium in grid-scale redox flow batteries, J. Power Sources, 2023, 560, 232605 CrossRef CAS.
- H. Zhang, Vanadium batteries will be cost-effective, Nature, 2014, 507, 26–28 CrossRef PubMed.
- X. Zhu, S. Yang, Z. Zhou, J. Jin and Y. Han, A sustainable method for high-efficient exploitation of low-grade vanadium-bearing shale ore by oxidation roasting pretreatment, J. Cleaner Prod., 2024, 447, 141627 CrossRef CAS.
- W. Bo, Y. Zhang, H. Liu, N. Xue and L. Zhang, Optimization of precursor structure by dispersants to promote nitrogen reduction process to prepare high-quality VN, J. Alloys Compd., 2024, 1006, 176285 CrossRef CAS.
- X. Fu, L. Xu, H. Yan, H. Ye and J. Ding, Mineralogy and trace element geochemistry of the early Cambrian black shale-hosted Zhongcun vanadium deposit, southern Qinling, China, Ore Geol. Rev., 2023, 155, 105371 CrossRef.
- W. Li, C. Ma, W. Gong and X. Zhu, Clean production technology for effective recovery of vanadium from shale: Interaction between activators and vanadium-loaded minerals, J. Cleaner Prod., 2021, 315, 128170 CrossRef CAS.
- N. Xue, Y. Zhang, T. Liu and Q. Zheng, Efficient separation of black shale-hosted vanadium induced by formation of kalunite-jarosite solid solution in two-stage pressurized acid leaching coupled with lixivium recycling, Sep. Purif. Technol., 2021, 269, 118762 CrossRef CAS.
- Z. Abdi, S. M. Rimmer, H. D. Rowe and S. Nordeng, Trace-metal enrichment mechanisms in Bakken Formation black shales, Williston Basin, North Dakota, USA, Chem. Geol., 2024, 646, 121892 CrossRef CAS.
- X. Zhao, Y. Zhang, N. Xue, P. Hu, Q. Zheng and Y. Hu, Effect of mechano-chemical activation with NaF on improved acid leaching of vanadium-bearing shale, Hydrometallurgy, 2023, 221, 106126 CrossRef CAS.
- P. Zuo, Q. Chen, Z. Xiao, Y. Dong, J. Sun, X. Sun and L. Liu, Geology and mineral assemblages of the early Cambrian black shales in the South Qinling: Implications for vanadium and barium mineralization, Ore Geol. Rev., 2023, 161, 105624 CrossRef.
- M. Drexler, I. Barton and P. Zanetta, Vanadium in phyllosilicate ores: Occurrence, crystal chemistry, and leaching behavior, Miner. Eng., 2023, 201, 108205 CrossRef CAS.
- J. Vind and K. Tamm, Review of the extraction of key metallic values from black shales in relation to their geological and mineralogical properties, Miner. Eng., 2021, 174, 107271 CrossRef CAS.
- L. Xu and J. Mao, Trace element and C-S-Fe geochemistry of early cambrian black shales and associated polymetallic Ni-Mo sulfide and vanadium mineralization, South China: Implications for paleoceanic redox variation, Ore Geol. Rev., 2021, 135, 104210 CrossRef.
- B. Chen, S. Bao and Y. Zhang, Synergetic strengthening mechanism of ultrasound combined with calcium fluoride towards vanadium extraction from low-grade vanadium-bearing shale, Int. J. Min. Sci. Technol., 2021, 31, 1095–1106 CrossRef CAS.
- X. Jian, J. Huang, Z. Cai, Y. Zhang, T. Liu and H. Liu, Effect of alkaline fusion on muscovite decomposition and the vanadium release mechanism from vanadium shale, R. Soc. Open Sci., 2018, 5, 180700 CrossRef CAS PubMed.
- Y. Zhang, S. Bao, T. Liu, T. Chen and J. Huang, The technology of extracting vanadium from stone coal in China: History, current status and future prospects, Hydrometallurgy, 2011, 109(1–2), 116–124 CrossRef CAS.
- Y. Zhang, N. Xue, T. Liu, J. Huang and S. Bao, Study on clean extractive technique of vanadium-bearing shale by one-step process, Metall. Eng. Technol., 2018, 364–372 CAS.
- Q. Zheng, Y. Zhang, T. Liu, J. Huang and N. Xue, Vanadium extraction from black shale: Enhanced leaching due to fluoride addition, Hydrometallurgy, 2019, 187, 141–148 CrossRef CAS.
- Y. Tang, Y. Qi, F. Zhou and L. Hua, A study on the differential effects of heterogeneous environmental regulations on the green transformation of Chinese manufacturing enterprises under “Double Carbon” target, Heliyon, 2023, 9, e19841 CrossRef CAS PubMed.
- S. Tiwari, K. Si Mohammed, G. Mentel, S. Majewski and I. Shahzadi, Role of circular economy, energy transition, environmental policy stringency, and supply chain pressure on CO2 emissions in emerging economies, Geosci. Front., 2024, 15(3), 101682 CrossRef CAS.
- B. Zhu, M. Jiang, K. Wang, J. Chevallier, P. Wang and Y. Wei, On the road to China's 2020 carbon intensity target from the perspective of “double control”, Energy Policy, 2018, 119, 377–387 CrossRef.
- P. Hu, Y. Zhang, J. Huang, T. Liu, Y. Yuan and N. Xue, Eco-friendly leaching and separation of vanadium over Iron impurity from vanadium-bearing shale using oxalic acid as a leachant, ACS Sustain. Chem. Eng., 2018, 6, 1900–1908 CrossRef CAS.
- X. Li, Z. Deng, C. Wei, C. Li, M. Li, G. Fan and H. Huang, Solvent extraction of vanadium from a stone coal acidic leach solution using D2EHPA/TBP: Continuous testing, Hydrometallurgy, 2015, 154, 40–46 CrossRef CAS.
- H. Liu, Y. Zhang, T. Liu, J. Huang, L. Chen and Y. Hu, Preparation of vanadium electrolyte from vanadium shale leaching solution with high concentration chloride using D2EHPA, Trans. Nonferrous Met. Soc. China, 2023, 33, 1594–1608 CrossRef CAS.
- Y. Ma, X. Wang, M. Wang, C. Jiang, X. Xiang and X. Zhang, Separation of V(IV) and Fe(III) from the acid leach solution of stone coal by D2EHPA/TBP, Hydrometallurgy, 2015, 153, 38–45 CrossRef CAS.
- Y. Tang, G. Ye, H. Zhang, X. Kang, S. Zhu and X. Liang, Solvent extraction of vanadium with D2EHPA from aqueous leachate of stone coal after low–temperature sulfation roasting, Colloids Surf., A, 2022, 650, 129584 CrossRef CAS.
- Y. Luo, N. Xue, Y. Zhang and P. Hu, Source removal of iron and aluminum impurities over vanadium in phosphate-sulfate complex anionic leaching system of the black shale, J. Taiwan Inst. Chem. Eng., 2022, 133, 104270 CrossRef CAS.
- L. Wang, N. Xue, Y. Zhang and P. Hu, Controlled Hydrothermal Precipitation of Alunite and Natroalunite in High-Aluminum Vanadium-Bearing Aqueous System, Minerals, 2021, 11(8), 892 CrossRef CAS.
- L. Wang, Y. Zhang, T. Liu, J. Huang, N. Xue and Q. Zheng, Separation of iron impurity during vanadium acid leaching from black shale by yavapaiite-precipitating method, Hydrometallurgy, 2020, 191, 105191 CrossRef CAS.
- P. Hu, Y. Zhang, T. Liu, J. Huang, Y. Yuan and N. Xue, Source separation of vanadium over iron from roasted vanadium-bearing shale during acid leaching via ferric fluoride surface coating, J. Cleaner Prod., 2018, 181, 399–407 CrossRef CAS.
- H. Liu, Y. Zhang, T. Liu, J. Huang, L. Chen and Y. Hu, Preparation of vanadium electrolyte from vanadium shale leaching solution with high concentration chloride using D2EHPA, Trans. Nonferrous Met. Soc. China, 2023, 33, 1594–1608 CrossRef CAS.
- X. Chen, Q. Chen, F. Guo, X. Liu, J. Li and L. He, et al., Extraction and separation of W and rare earth from H2SO4-H3PO4 mixed acid leaching liquor of scheelite by primary amine N1923, Sep. Purif. Technol., 2021, 257, 117908 CrossRef CAS.
- X. Chen, F. Guo, Q. Chen, X. Liu and Z. Zhao, Leaching tungsten and rare earth elements from scheelite through H2SO4–H3PO4 mixed acid decomposition, Miner. Eng., 2020, 156, 106526 CrossRef CAS.
- Y. Zhang, J. Zhang, L. Wu, L. Tan, F. Xie and J. Cheng, Extraction of lithium and aluminium from bauxite mine tailings by mixed acid treatment without roasting, J. Hazard. Mater., 2021, 404, 124044 CrossRef CAS PubMed.
- R. Liu, Z. Zhao and Y. Li, Acid leaching–extraction–circulation process based on Mo(VI) coordination with H3PO4 to efficiently extract molybdenum from different components of molybdenum calcine, Sep. Purif. Technol., 2023, 322, 124269 CrossRef CAS.
- S. Xia, F. Li, F. Chen and H. Guo, Preparation of FePO4 by liquid-phase method and modification on the surface of LiNi0.80Co0.15Al0.05O2 cathode material, J. Alloys Compd., 2018, 731, 428–436 CrossRef CAS.
- G. Duan, Y. Yuan, Y. Zhang, N. Xue, H. Liu and X. Zhao, A novel approach to eliminate the negative effects of SO42- and NH4+ on vanadium extraction from the high-calcium shale during the internal recycling of vanadium industrial wastewater, J. Environ. Chem. Eng., 2024, 12(5), 113484 CrossRef CAS.
- Y. Xu, X. Liu, Z. Zhao, X. Chen, J. Li, L. He and F. Sun, Kinetics and mechanism of selective leaching of bismuth from molybdenite and bismuthinite mixed ore, Hydrometallurgy, 2024, 224, 106258 CrossRef CAS.
- B. Kumar, R. R. Srivastava and S. P. Barik, Hydrometallurgical recycling of lithium-titanate anode batteries: Leaching kinetics and mechanisms, and life cycle impact assessment, Miner. Eng., 2023, 202, 108289 CrossRef CAS.
- M. Rezaee, R. Saneie, A. Mohammadzadeh, H. Abdollahi, M. Kordloo, A. Rezaee and E. Vahidi, Eco-friendly recovery of base and precious metals from waste printed circuit boards by step-wise glycine leaching: Process optimization, kinetics modeling, and comparative life cycle assessment, J. Cleaner Prod., 2023, 389, 136016 CrossRef CAS.
- J. Gamutan, S. Koide, Y. Sasaki and T. Nagasaka, Selective dissolution and kinetics of leaching zinc from lime treated electric arc furnace dust by alkaline media, J. Environ. Chem. Eng., 2024, 12, 111789 CrossRef CAS.
- I. A. Nnanwube and O. D. Onukwuli, Characterization and kinetics of alumina leaching from calcined Akpugo kaolinite for potential aluminum recovery. South African, J. Chem. Eng., 2023, 43, 24–37 Search PubMed.
- Z. Yang, H. Li, X. Yin, Z. Yan, X. Yan and B. Xie, Leaching kinetics of calcification roasted vanadium slag with high CaO content by H2SO4, Int. J. Miner. Process., 2014, 133, 105–111 CrossRef CAS.
- J. Tian, D. Wu, S. Li, W. Ma and R. Wang, Effect of process variables on leaching behavior and kinetics of silver element from waste photovoltaic modules, Sep. Purif. Technol., 2024, 335, 126062 CrossRef CAS.
- M. Aarabi-Karasgani, F. Rashchi, N. Mostoufi and E. Vahidi, Leaching of vanadium from LD converter slag using H2SO4, Hydrometallurgy, 2010, 102, 14–21 CrossRef CAS.
- F. K. Crundwell, The impact of light on understanding the mechanism of dissolution and leaching of sphalerite (ZnS), pyrite (FeS2) and chalcopyrite (CuFeS2), Miner. Eng., 2021, 161, 106728 CrossRef CAS.
- F. Wang, Y. Zhang, T. Liu, J. Huang, J. Zhao, G. Zhang and J. Liu, Comparison of direct acid leaching process and blank roasting acid leaching process in extracting vanadium from stone coal, Int. J. Miner. Process., 2014, 128, 40–47 CrossRef CAS.
- M. Motasim, S. Aydoğan, T. Agacayak, Y. R. Eker, A. El-gak and A. A. S. Seifelnassr, The influence of sodium fluoride on the dissolution kinetics of metallic titanium in citric acid solution using the rotating disc method, Hydrometallurgy, 2024, 1, 106297 CrossRef.
- K. Kaneko, K. Kitawaki, S. Hattori, T. Mori, Y. Yoshimura and A. Shimizu, Thermodynamic properties (excess and partial molar volume, Gibbs free energy of activation for viscous flow, enthalpy, and entropy) of propylammonium nitrate/water mixtures, J. Chem. Thermodyn., 2023, 176, 106898 CrossRef CAS.
- B. He, Y. Zhu, Y. Zu, Y. Nie and Y. Mei, Designing an efficient fluorine recovery strategy for wet-process phosphoric acid purification by disclosing competitive complexation behavior between fluorine species and metal cations, Sep. Purif. Technol., 2023, 320, 124219 CrossRef CAS.
- M. R. Bruce, Ternary complexes of Al3+ and F− with a third ligand, Coord. Chem. Rev., 1996, 149, 23–32 CrossRef.
- D. Lisbona and K. Steel, Recovery of fluoride values from spent pot-lining: Precipitation of an aluminium hydroxyfluoride hydrate product, Sep. Purif. Technol., 2008, 61(2), 182–192 CrossRef CAS.
| This journal is © The Royal Society of Chemistry 2024 |

