 Open Access Article
Creative Commons Attribution 3.0 Unported Licence
Nanohexagonal iron barium titanate nanoparticles surface-modified NiFe2O4 composite screen-printed electrode for enzymatic glucose monitoring
Hend S. Magar *a,
Amany M. El Nahrawyb,
Rabeay Y. A. Hassan
 ac and
Ali B. Abou Hammadb
aApplied Organic Chemistry Department, National Research Centre (NRC), Dokki, Giza, 12622, Egypt. E-mail: hendamer2000@yahoo.com; Tel: +201121926682
bSolid State Physics Department, Physics Research Division, National Research Centre, 33 El Bohouth St., Dokki, Giza 12622, Egypt
cBiosensors Research Lab, University of Science and Technology (UST), Zewail City of Science and Technology, 6th October City, Giza, 12578, Egypt
First published on 1st November 2024
Abstract
A nanocomposite of iron barium titanate/NiFe2O4 (FBT/NF) was synthesized using sol–gel techniques to form organized hexagonal structures. The effects of NiFe2O4 nanostructures on FBT's phase purity, morphology, and dielectric properties were systematically explored and intensively discussed. TEM imaging confirmed the hexagonal structure, and electrical measurements revealed that para-electric NF influenced the conductivity and impedance of ferroelectric FBT, with a shift in Curie temperature to lower values. The FBT/NF nanocomposite was optimized for use in glucose amperometric biosensors, offering fast and direct electron transfer from glucose oxidase that was chemically immobilized on disposable sensor chips. Thus, the biosensor exhibited high sensitivity (757.14 μA mM−1 cm−2), a fast response time of 50 seconds, and a wide linear range of 0.0027–1.9 mM with a low detection limit of 0.5 μM. Accordingly, the biosensor was exploited for blood glucose detection, showing high precision compared to reference methods. These findings highlighted the potential of the FBT/NF nanocomposite for use in developing biosensor portable devices.
1 Introduction
Over the past few decades, there has been significant research focus on multiferroic-versatile materials that concurrently display ferroelectricity and magnetism within a single structure.1–4 This intense study stems from their promising potential applications in versatile promising fields including data storage, water treatment, energy storage, electromagnetic wave absorption, phase shifting, magnetoelectric (ME) actuators, transducers, and biosensors.5–7Within the field of multiferroics, a specific category of nanocomposites known as perovskite/magnetic metal nanocomposites is emerging as a promising class of nanomaterials to exhibit either a core/shell or random structure, offering a unique avenue to capitalize on both dielectric and magnetic characteristics.8–11 These composites exhibit either a core/shell or random structure, providing a unique opportunity to leverage both dielectric and magnetic properties. This potential is realized through careful selection of the specific types of perovskite and magnetic materials. The alteration of BaTiO3 materials results in an asymmetric displacement of ions or dipoles within the crystal lattice, leading to a modification in the overall electrical polarization and the generation of piezoelectricity.3,4
Until now, diverse magnetic nanoparticles derived from transition metals (such as Co, Fe, Ni) have been combined with dielectric materials like BaTiO3, TiO2, ZnTiO3, ferrite, graphite, and polymers, resulting in successfully prepared nanocomposites with remarkable properties.12–14 These findings highlight that the performance of perovskite/magnetic metal nanocomposites is largely determined by their complex microstructure, as well as their permeability, permittivity, and chemical stability.
On the other hand, electron transfer (ET) in biological systems is a very important phenomenon for the areas of biophysical, biochemical and biomedical sciences. In particular, ET is a major regulating factor for bio-electrochemical systems (BESs) including electrochemical biosensors.15 Basically, a high-performance biosensor with high efficiency of ET is dependent on the platform's material that is used for immobilization of biomolecules.16,17 For instance, in the case of enzyme-based biosensors, denaturation and loss of enzyme bioactivity is resulting from the use of unsuitable platforms for the adsorption of enzymes.18 Thus, recent advances for immobilization strategies were employed to develop enzymatic biosensors.19 In this regard, the use of nanomaterials provided very efficient alternatives for constructing sensitive and selective biosensors due to the stable, active and well-oriented immobilized biomolecules. Nanostructured materials were categorized as inorganic,20 organic21,22 or hybrid (organic–inorganic or metal–organic) nanostructures.23
The fabricated nanostructures-based electrochemical biosensors were designed for the detection of infectious diseases or for health care diagnosis.24 Since the type and structure of nanomaterials have high impact on the performance of BESs, modification of the electrode surface by using nanoparticles (NPs), nanorods, nanotubes or other nanostructures was conducted.25 Perovskite/magnetic metal nanocomposites have been exploited for efficient and sensitive biosensors fabrication.26–28
On the other hand, better electro-catalytic properties of the perovskite/magnetic metal nanocomposites and the ease of fabrication of their nanostructures make them extremely attractive materials for sensitive biosensing devices. Therefore, the immobilization of target biomolecules such as, cholesterol oxidase, glucose oxidase, urease, cytochrome C, tyrosinase or horseradish peroxidase (HRP) on nanostructured metal oxides was successfully obtained. Piezoelectric BaTiO3 materials belong to the category of biomaterials that produce charges in response to slight deformations caused by various modifiers.29,30
Herein, we exploited the benefits of piezoelectric material (Fe0.3BaTi0.7O3) and nanomagnetic NiFe2O4 within a chemical manufacturing process. The objective is to produce glucose biosensors with functionality tailored for accurate glucose monitoring directly in blood samples.
In the current study, Fe0.3BaTi0.7O3@NiFe2O4 nanohexagnoal composites were developed, characterized and utilized for the direct biosensing of glucose. The nanohexagnoal composites with highly electrocatalytic behavior was implemented to support the interaction between the electrode surface and the active site of the immobilized sensing molecules, e.g. glucose oxidase (GOx). Thus, the main goal of this study is the construction of a novel biosensor platform for efficient enzymatic glucose biosensing using the synthesized Fe0.3BaTi0.7O3@NiFe2O4 nanohexagnoal composites on the screen-printed electrodes. Besides, a synergetic electrocatalytic performance of the developed nanocomposite, fast electron communication between the enzyme's active sites and the screen-printed electrode is expected from the new sensing approach.
2 Experimental
2.1. Materials
All chemicals were of analytical reagent grade and used as received. Nickel and ferric nitrates (Ni(NO3)2·6H2O, and Fe(NO3)3·9H2O), barium acetate (Ba(CH3COO)2, 99%), titanium(IV) isopropoxide (Ti[OCH(CH3)2)], iron nitrate, citric acid, and nitric acid were used as a raw materials were obtained from Sigma-Aldrich. Glucose oxidase (GOx, CAS RN:9001-37-0 number: G0050 from Aspergillus niger, 40 U mg−1), β-D(+)-glucose, ascorbic acid, dopamine, uric acid and paracetamol were obtained from Sigma-Aldrich (St. Louis, MO, USA). Glutaraldehyde (GA) was obtained from Fluka (Buchs, Switzerland).Potassium chloride, ferricyanide [Fe(CN)6]3−, and ferrocyanide [Fe(CN)6]4− were purchased from Pio CHEM. Phosphate buffer saline (PBS, tablets with the pH = 7.4) were obtained from MPBio. Commercial screen-printed carbon electrodes with dimensions: 50 × 13 mm (h × w) were purchased from Zensors Company, where printed electrodes which consist of three parts including carbon as working and counter electrodes and silver as reference electrode (The diameter of working electrode is 3.0 mm of graphitic carbon). All other chemicals and solvents were of analytical grade and were used without further purification.
2.2. Apparatus and instrumentation
X-ray diffraction (XRD) with (XPERT, CuKα; λ = 0.15405 nm) was achieved to identify the crystalline phases existing in the fabricated nanocomposites.Transmission electron microscopy (TEM) and high-resolution transmission electron microscopy (HRTEM) were conducted using (FEI TECNAI G2 F20) microscope operating at (200 kV).
Hioki LCR Meter IM3536 was employed to measure the electrical properties of the composite samples in the frequency range from 4 Hz to 8 MHz. Samples were compacted into disks with thickness d and 6 mm radius. A parallel electrodes capacitor technique was used to measure the electrical properties of the samples.
The electric conductivity is given by
 , and R is the resistance in Ω. The electrical impedance of the samples was obtained from the following relation
| Z* = Z′ + jZ′′ |
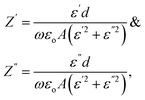
Therefore, the components of the electrical impedance are given by the following equations.18,31
 where C is the recorded capacitance.
2.3. Methods
Nickel and ferric nitrates (Ni(NO3)2·6H2O, and Fe(NO3)3·9H2O) were dissolved individually in deionized water in a 1![[thin space (1/6-em)]](https://www.rsc.org/images/entities/char_2009.gif) :
:![[thin space (1/6-em)]](https://www.rsc.org/images/entities/char_2009.gif) 2 molar ratio in the presence of citric acid. The solutions were then combined and subjected to vigorous stirring for 2 hours at room temperature to achieve a uniformly clear and homogeneous solution before used as a coated layer.
2 molar ratio in the presence of citric acid. The solutions were then combined and subjected to vigorous stirring for 2 hours at room temperature to achieve a uniformly clear and homogeneous solution before used as a coated layer.
The preparation of hexagonal iron barium titanate nanoparticles involved the sol–gel process, employing specified quantities of barium acetate, titanium(IV) iso-propoxide, and iron nitrate as sources for Ba, Ti, and Fe, respectively. Acetic acid (HAc) and acetylacetone (AcAc, C5H8O2) served as appropriate solvents. Titanium(IV) isopropoxide was dissolved in acetylacetone, while barium acetate and iron nitrate were dissolved in acetic acid/water. The resulting solutions stirred for 1 h, and dried at 250 °C. Subsequent thermal treatment at 500 °C for 2 hours yielded shaped iron barium titanate powder.
For FBT coated with xNiFe2O4 (where x = 0, 0.1, 0.3, and 0.5), the resulting FBT nanopowder, post-calcination at 500 °C, was introduced into a NF solution based on the desired weight percentage. The resulting solution underwent stirring for 1.30 min at 70 °C. Upon drying at 250 °C, the solution transformed into a viscous brown gel before transitioning into a xerogel form. Finally, the obtained xerogels underwent calcination at 600 °C. The nanocomposite samples were designated with symbols BN, 1BN, 3BN, and 5BN.
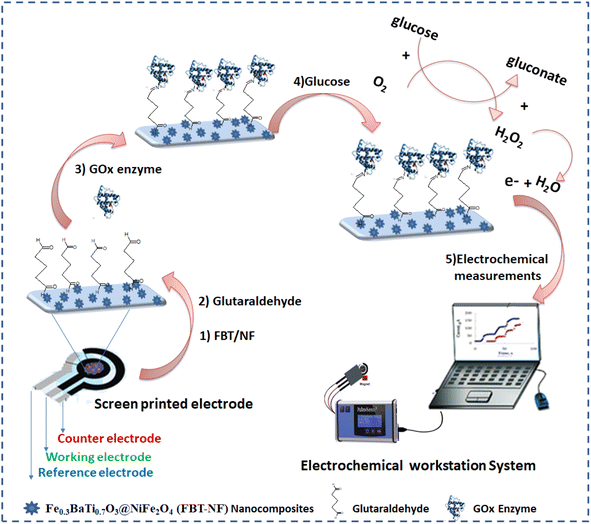
The fabricated biosensor (GOx@GA/FBT/NF@SPE) was washed carefully by PBS buffer solution (pH = 7) to remove any unattached enzymes.
In order to optimize the GOx concentration, the enzymatic solutions were prepared by dissolving different amounts of GOx (100 to 700 μg ml−1) in phosphate buffer saline(pH = 7.4). The modified electrodes were stored at 4 °C overnight for further experimental work.
The EIS data (which used for understanding the surface structure) were carried out with a range of frequency from 0.1 to 100![[thin space (1/6-em)]](https://www.rsc.org/images/entities/char_2009.gif) 000 Hz at open circuit potential under 5 mV potential amplitude and a certain equivalent circuit was selected for fitting the Nyquist impedance plot. Screen printed electrodes and Palmsens4 instrument were used for all electrochemical data measurements.
000 Hz at open circuit potential under 5 mV potential amplitude and a certain equivalent circuit was selected for fitting the Nyquist impedance plot. Screen printed electrodes and Palmsens4 instrument were used for all electrochemical data measurements.
2.4. The application for glucose detection in blood samples
A local clinical lab (El Ahram lab) in Egypt was responsible for collecting and providing the blood samples (Ethical No. 114110923).A freshly prepared GOx@GA@FBT/5NF@SPE biosensor was applied for glucose analysis in ten blood serum samples of patients without any pretreatments for the samples. A certain volume of the samples (300 μl) was added into the electrochemical cell containing 3 ml of the supporting electrolyte. The glucose concertation values which obtained using the proposed biosensor and chronoamperometric analysis were compared and validated with the values which reported by the clinic laboratory (El Ahram lab).
3 Results and discussion
3.1. Phase purity of FBT/NF nanostructures
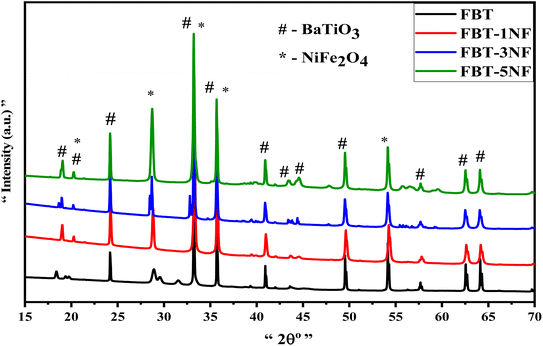
To highlight the distinctive peaks associated with the nanoceramics under consideration, the X-ray diffraction patterns depicted in Fig. 1 show the FBT as a core coated with NF-ferrite nanopowder, focusing on the nanoparticle layer of the FBT core. As shown in Fig. 1, the XRD of pure FBT nanoparticles appeared a crystalline hexagonal BaTiO3 phase with the peaks at 19.06°, 20.25°, 24.17°, 33.3°, 35.68°, 40.8°, 43.4°, 44°, 57.7° and 62.5° which are associated with “101”, “102”, “004”, “112”, “201”, “114”, “106”, “108”, and “118” corresponds to the plane of the hexagonal phase (JCPDS: 34-0129) FBT. Fig. 1 (1–5 NF) for FBT/(1–5) NF samples reveal the existence of NiFe2O4 coated layer, we found an increase in the peaks at 2θ = 19.06°, 20.25°, 28.7°, 33.3°, 35.68°, 44°, 57.7° and 62.5° which indexed to the cubic structure of NiFe2O4 (PDF 03-0875).33 Evidently, the presence of hexagonal FBT and cubic NF phases in the growth signifies the reaction of the lower calcination core FBT nanoparticles with the coated NiFe2O4, resulting in good arrangement within the network structure of Fe0.3BaTi0.7O3@NiFe2O4 composites. The XRD patterns indicate the presence of diffraction peaks corresponding to both phases, suggesting that the FBT@NF core and the coated layer in the nanocomposites maintain distinct identities in their crystalline structures. This confirms the successful fabrication of di-phase nano hexagonal composite ceramics with minimal chemical reaction occurring at the interfaces between the perovskite and ferrite phases. Furthermore, the average crystallite size (approximately 20–27 nm) of the FBT@NF and pure FBT was calculated using the Scherrer formula.3.2. Morphology of nano hexagonal FBT/NF composites
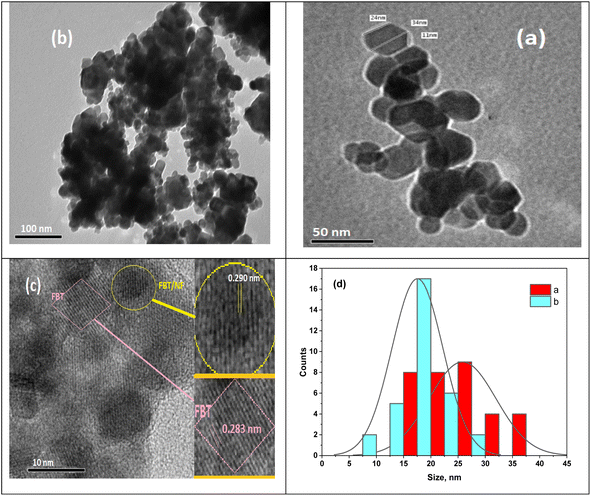
Further insight into the FBT nanoparticles and their surface modification with NF was obtained through transmission electron microscopy (TEM) images presented in Fig. 2. Fig. 2a and b display TEM images of the hexagonal FBT and FBT/5NF samples, while Fig. 2c offers a high-resolution transmission electron microscopy (HRTEM) image of the FBT/5NF sample. The TEM image confirms the well-structured hexagonal arrangement and uniformity of FBT/NF with the existence of highly ordered hexagonal lattice channels, showing a diameter ranging from approximately 20 to 47 nm.As depicted in Fig. 2c, distinct inter-planers are evident in the image, signaling the existence of a nanostructure in FBT/NF characterized by long-range order.
The HRTEM image of the FBT/5NF sample reveals two distinct interplanar spacings, one measuring 0.283 nm for FBT nanoparticles and the other at 0.290 nm, indicating the growth of FBT/NF. The FBT and FBT/5NF samples display noticeable clustering of hexagonal nanoparticles, potentially matching XRD intensity.
Some agglomerated nanoparticles and dark spots appeared in TEM images resulting from FBT shielding by NF, interactions between magnetic NF nanoparticles, and the higher surface energy of FBT. The formation of clustering behavior suggests that the FBT coating supports the uniformly distributed NF nanoparticles over the surface of the FBT. Also, the agglomerations (Fig. 2c) may arise from the attractive forces resulting from the acquired magnetic properties due to coating with magnetic nanoparticles (NF), leading to their proximity or fusion.34,35 The average particle size of the nano hexagons is 18 nm for FBT and 20 nm for FBT/5NF, as illustrated in Fig. 2d aligning well with the observations from the TEM image.
3.3. Electrical properties
| σAC = σDC + Aωs |
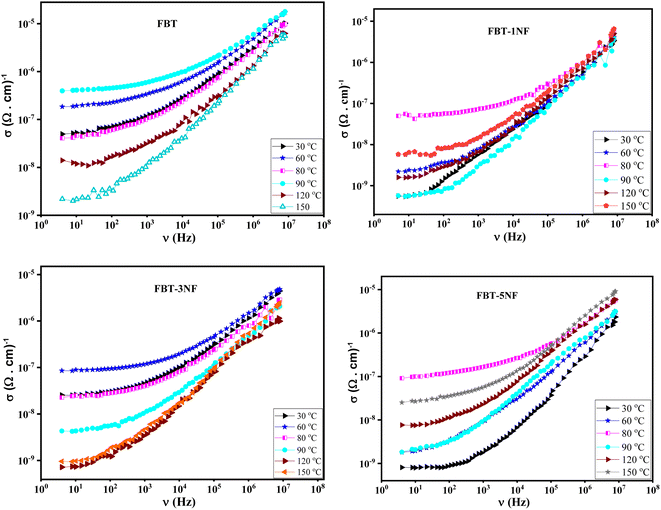 | ||
| Fig. 3 The AC conductivity (σ(ν)) versus frequency at different temperature of iron barium titanate (FBT) and iron barium titanate shielded with nickel ferrite (FBT/xNF). | ||
| Temperature | FBT (Tc ≈ 90 °C) | FBT-1NF (Tc ≈ 75 °C) | FBT-3NF (Tc ≈ 50 °C) | FBT-5NF (Tc ≈ 75 °C) |
|---|---|---|---|---|
| s | s | s | s | |
| 30 | 0.76919 | 0.74 | 0.6489 | 0.8578 |
| 40 | 0.61525 | 0.72429 | 0.58477 | 0.7559 |
| 50 | 0.58289 | 0.7209 | 0.59787 | 0.67227 |
| 60 | 0.61085 | 0.752 | 0.58419 | 0.66026 |
| 70 | 0.6014 | 0.67354 | 0.59273 | 0.61619 |
| 80 | 0.60217 | 0.64476 | 0.5653 | 0.6097 |
| 90 | 0.52224 | 0.7024 | 0.67184 | 0.7022 |
| 100 | 0.57845 | 0.69508 | 0.6684 | 0.7163 |
| 110 | 0.62166 | 0.64528 | 0.7682 | 0.7025 |
The prepared composites belong to the ferroelectric materials. Therefore, they have a unique trend with temperature. As presented in Fig. 3, the conductivity of the prepared composites increases with increasing temperature up to a certain temperature (Curie temperature, Tc) and then decreases with further increase in temperature. This behavior is attributed to increasing the total charge carriers (e.g., electrons or holes) that become thermally excited with increasing temperature below the Curie temperature. Above the Curie temperature, the composite samples lose their spontaneous polarization and transfer to a paraelectric material. Therefore, the conductivity of the composite samples decreases with increasing temperature above Curie temperature. Consequently, the composite samples behave like semiconductors below the Curie temperature and behave like typical dielectric materials above the Curie temperature.28
The Curie temperature of the prepared composite is listed in Table 1. It was found that the Curie temperature of the nano-composite decreases with increasing the concentration of the paraelectric phase (NF) which is expected behavior due to the decreasing of the ferroelectric phase and hence decreasing the total number of spontaneous polarizations. The presence of the paraelectric phase hinders the movement and the interaction between the spontaneous dipole moment, which leads to a decrease in the electrical conductivity compared to the conductivity of FBT as observed in Fig. 3.
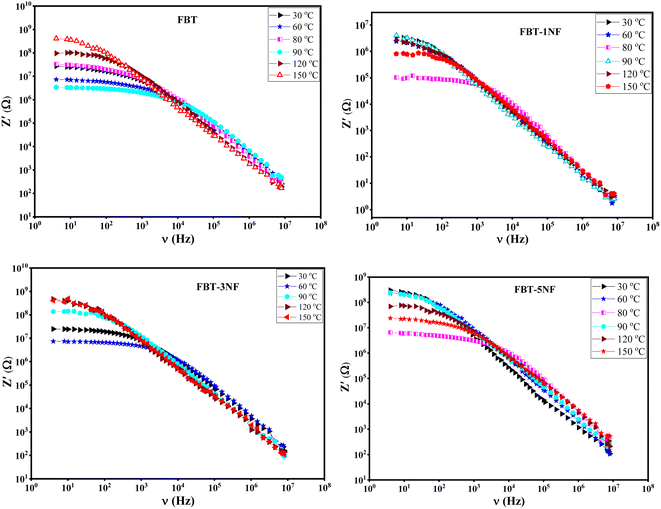 | ||
| Fig. 4 The real impedance (Z′(ν)) versus frequency at different temperature of iron barium titanate (FBT) and iron barium titanate shielded with nickel ferrite (FBT/xNF). | ||
Fig. 5 introduces the imaginary impedance (Z′′(ν)) of the composite samples at different temperatures. It shows the same behavior as the real impedance with appearance of broad asymmetric peaks, that refer to the non-Debye relaxation in the samples. The behavior of the imaginary impedance with temperature confirms the presence of the ferroelectric to paraelectric phase transition.38,39
 | ||
| Fig. 5 The imaginary impedance (Z′′(ν)) versus frequency at different temperature of iron barium titanate (FBT) and iron barium titanate shielded with nickel ferrite (FBT/xNF). | ||
Fig. 6 represents the Nyquist plots and the equivalent circuit. The Nyquist plots show a depressed semicircle with its center below the real impedance axes, which confirms the non-Debye type of relaxation. Also, the semicircles are unsymmetric. The experimental data were fitted, and the estimated equivalent circuit is plotted in Fig. 6. The equivalent circuit shows the presence of two parallel circuits connected in series; each one is represented by a semicircle, which declares the unsymmetric of the total equivalent circuit due to the overlapping between the two semicircles. Polycrystalline materials are composed of conducting grains and insulator grain boundaries. The effect of grains is predominant at the high frequency, while the impact of grain boundaries is predominant at low frequency under the effect of an AC field. The estimated data are presented in Table 2. Cg and Rg represent the effect of the grains, and Rgb and Qgb (p & n) represent the grain boundary effect. The values of the quantum phase element component (p &n) in Table 2 indicate a capacitive effect is dominant in the low frequency.
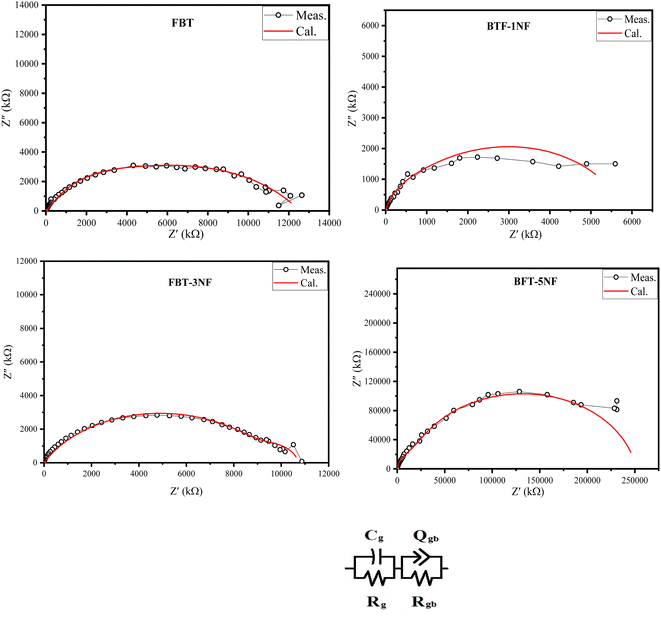 | ||
| Fig. 6 The Nyquist plots at 40 °C and the equivalent circuit of iron barium titanate (FBT) and iron barium titanate shielded with nickel ferrite (FBT/xNF). | ||
| Cg | Rg (Ω) | Rgb(Ω) | Qgb | ngb | |
|---|---|---|---|---|---|
| FBT | 3.8 × 10⁻¹¹ | 1.64 × 10⁶ | 1.1 × 10⁷ | 8.5 × 10⁻¹⁰ | 0.6 |
| BTF-1NF | 2.8 × 10⁻⁹ | 4.34 × 10⁵ | 5.3 × 10⁶ | 3.7 × 10⁻⁹ | 0.8 |
| BFT-3NF | 6.3 × 10⁻⁹ | 1.07 × 10⁶ | 9.7 × 10⁶ | 2.26 × 10⁻¹⁰ | 0.69 |
| BFT-5NF | 1.4 × 10⁻¹¹ | 1.46 × 10⁷ | 2.4 × 10⁸ | 2.3 × 10⁻¹¹ | 0.9 |
3.4. Bio-sensing platform construction and optimization
| Electrode | Ia (μA) | Ic (μA) | Eoxd. (V) | Ered. (V) | E1/2 (V) | Rs (Ω) | Rct (Ω) | C (μF) | W (Ω) |
|---|---|---|---|---|---|---|---|---|---|
| Bare (unmodified) | 124 | −158 | 0.274 | −0.06 | 0.107 | 424 | 1400 | 0.136 | 0.0028 |
| FBT | 153 | −188 | 0.233 | −0.05 | 0.09 | 389 | 427 | 0.243 | 0.0023 |
| FBT/1NF | 159 | −189 | 0.268 | 0.01 | 0.139 | 324 | 161 | 0.432 | 0.02216 |
| FBT/3NF | 169 | −202 | 0.334 | −0.03 | 0.152 | 186 | 118 | 0.573 | 0.00227 |
| FBT/5NF | 171 | −216 | 0.227 | 0.045 | 0.136 | 273 | 88 | 1.231 | 0.0020 |
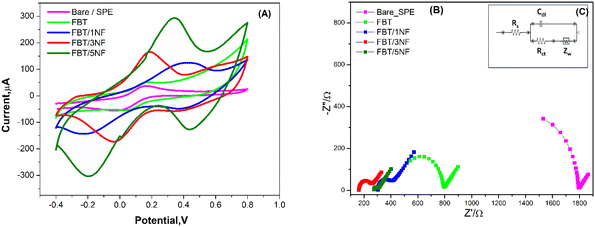
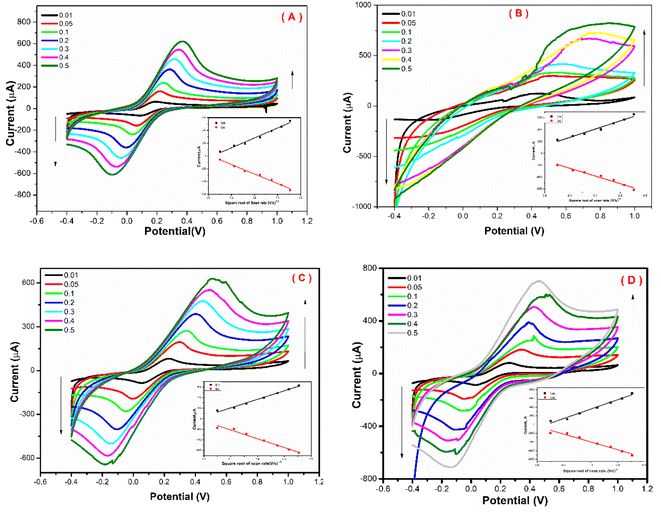
As a result, surface modification with the FBT/5NF provided the highest current readout activity compared with the others coating materials (i.e. the FBT, FBT/1NF and FBT/3NF). Consequently, the effective electrochemical active surface area (EASA) of unmodified vs. the modified surface with the FBT/1NF, FBT/3NF and FBT/5NF@SPE were calculated from Iox/Ired versus square root of scan rate plot as an inset in Fig. 8A–D by using Randles–Sevcik equation ref. 40:
| Ip = 2.69 × 10⁵ × n3/2 × A × D1/2 × Cu1/2 |
For evaluating the biosensor performance, direct electron transfer was measured from the oxidation of glucose to gluconic acid and generation of peroxide as an electrochemically active bi-product to be oxidized at the active nanomaterial substrate41–44 as shown in eqn (1).
 | (1) |
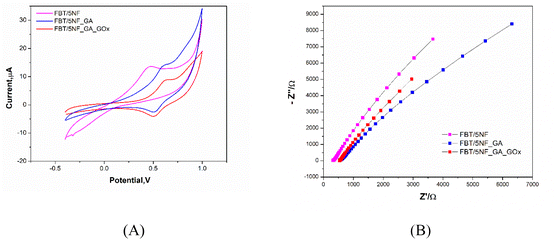
3.4.3.1 Electrochemical characterization of the enzymatic biosensor platform. The sequences of GOx enzyme immobilization on the FBT/5NF@SPE surface by glutaraldehyde (2.5%) as crosslinker were studied by cyclic voltammetry and EIS spectra as shown in Fig. 9 and Table 4. First, 5 μl of 5 mg FBT/5NF suspended in 1 ml double distilled water was drop casted on the SPE surface then immobilize 5 μl of GOx enzyme (500 μg/1 ml PBS buffer) on FBT/5NF@SPE surface by glutaraldehyde (2.5%) as crosslinker and left to dry at room temperature. The layer-by-layer sensor preparation was characterized by FCN redox probe solution using cyclic voltammetry (CV) and electrochemical impedance spectroscopy (EIS) techniques. For cyclic voltammetry studies (see Fig. 9A), every layer drop-casted on the SPE surface led to a decrease in the redox peak current of FCN solution due to the blocking of active surface area with the enzyme layer. This decrease in the voltammetric signals, combined with an increase in the impedimetric responses (see Fig. 9B and Table 4) which indicated the chemical immobilization and stability of the enzymatic layer onto the nanostructured surface.
| Electrode type | Ia (μA) | Ic (μA) | Eoxd. (V) | Ered. (V) | E1/2 (V) | Rs (Ω) | Rct (1) (Ω) | CPE (μF) | n | W (Ω) |
|---|---|---|---|---|---|---|---|---|---|---|
| FBT/5NF | 14.02 | 1.5 | 0.45 | 0.46 | 0.45 | 328.05 | 290.06 | 4.99 | 0.74 | 11.08 |
| FBT/5NF@GA | 14.8 | −2.9 | 0.58 | 0.52 | 0.55 | 560.7 | 44![[thin space (1/6-em)]](https://www.rsc.org/images/entities/char_2009.gif) 053 053 |
8.06 | 0.77 | 4.62 |
| FBT/5NF@GA@GOx | 8.75 | −4.1 | 0.61 | 0.51 | 0.56 | 547.7 | 81![[thin space (1/6-em)]](https://www.rsc.org/images/entities/char_2009.gif) 864 864 |
11.3 | 0.78 | 0.432 |
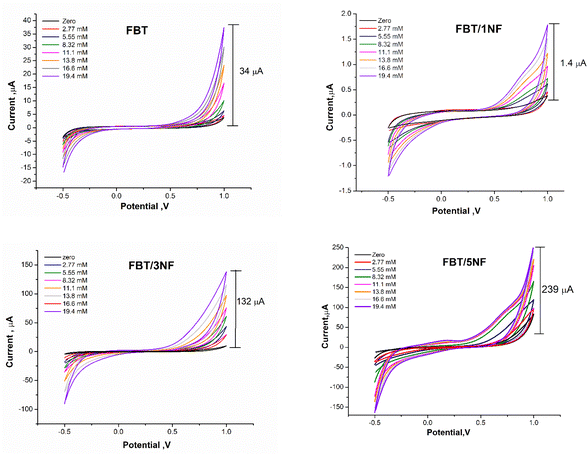
3.4.3.2 Influence of FBT/NF nanocomposite ratio on the enzymatic biosensor sensitivity. The enzymatic bio-sensing performance of different ratios of nanocomposite modified SPE surfaces was studied whereas the 5 μl of GOx enzyme (500 μg ml−1) was immobilized after drop cast 5 μl GA (2.5%) on sensor chips surface which modified with 5 μl of 25 mg ml−1 FBT, FBT/1NF, FBT/3NF, or FBT/5NF. As a result, cyclic voltammetry graphs showed an obvious response towards the addition of glucose concentration (the targeting analyte) with all modified surfaces, while the highest voltammetric oxidation peak current feedback was presented by the GOx@GA@FBT/5NF@SPE surface (see Fig. 10). Accordingly, the GOx immobilization by GA onto the FBT/5NF-based SPE surface was assigned for the glucose biosensing platform construction.
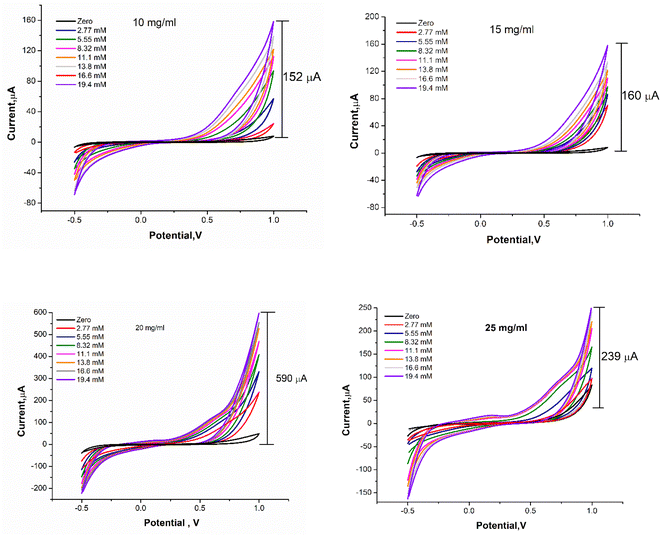
Further optimization was carried out whereas the concentration of FBT/5NF nanocomposite was studied over a range of concentration (10, 15, 20 and 25 mg ml−1) in GOx@GA@FBT/5NF@SPE surface. As shown in Fig. 11, the concentration of 20 mg ml−1 of FBT/5NF presented the highest oxidation peak current readout against different additions of glucose.
3.5. Chronoamperometric measurements
To optimize the fabricated biosensor response toward glucose detection, different parameters were studied including accumulation potential, enzyme concentration and pH effect of supporting electrolyte.| Electrode composite | Applied potential | Linearity (mM) | LOD (μM) | Sample | Life time | Ref. |
|---|---|---|---|---|---|---|
| a Abbreviations mentioned in the table: PENDI: polymerized N,N0-bis(2-hexyl)-2,6-(3,4 ethylene dioxy-thiophene)-1,4,5,8-naphthalenimide; PGE: pencil graphite electrode, rGO: reduced graphene oxide, Pin: polymerization of indole, CS: chitosan, PEI: poly-ethylenimine. | ||||||
| Nafion/GOx/carbon fibre-hemain AuNP/graphite electrode | −0.10 V (vs. Ag/AgCl) | 0.1–0.9 | 5 0 | — | — | 45 |
| Pencil graphite electrode modified with naphthalenedimide/3,4-ethylenedioxythiophene conjugated polymer and enrichedwith Au nanoparticles | −0.7 V (Ag/AgCl) | 0.009–0.33 | 40 | Orange juice | 3 weeks | 46 |
| Au@rGO/PIn/ferritin/GOx/GCE | — | — | — | — | 47 | |
| GOx-chitosan/rGOAuNPs/ | −0.30 V(vs. Ag/AgCl) | 0.1–1.3 | 76 | — | 36 days | 48 |
| Graphite NPs-pyrene-GOx/GCE | 0.60 V (vs. Ag/AgCl) | 0–2.2 7 | 50 | Urine | 30 days | 49 |
| GOx-graphene-thiol/Au nanocube/Au disk | −0.40 V (vs. Ag/AgCl) | 0–0.8 | — | — | 14 days | 50 |
| GOD-CS/AgNWs/GCE | −0.15 V (vs. saturated calomel electrode) | 0.01–0.8 | 2.83 | Human blood glucose | 10 days | 51 |
| Nafion/GOx/Au–Ni coaxial nanorod array/Au electrode | 0.40 V (−) | 0.028–27.5 | 5.5 | — | 30 days | 52 |
| GOx-Au/Pd-MWCNT/SPCE | — | — | 70 | Human blood glucose | 14 days | 53 |
| GOx@GA@FBT/5NF@SPE | 0.7 V (vs. Ag) | 0.0027–1.9 | 0.50 | Human blood glucose | 30 days | This work |
3.6. Selectivity testing
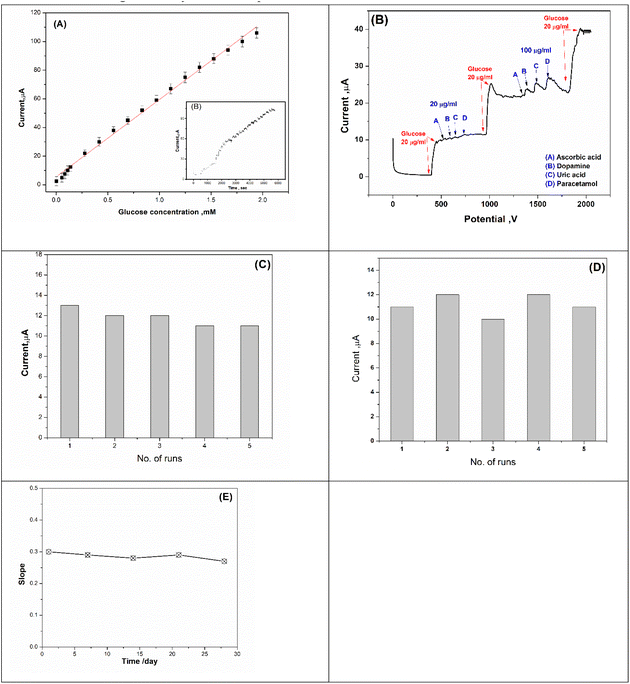
For selectivity study, the proposed biosensor (GOx@GA@FBT/5NF@SPE) response towards non-targeting analytes (such as dopamine, ascorbic acid, paracetamol and uric acid) were tested, as shown in Fig. 13B. The enzymatic chronoamperometric feedback was only positive toward the glucose addition, while exposing the biosensor chips toward the other foreign molecules did exhibit reasonable electrochemical signals.3.7. Repeatability, reproducibility and lifetime
The repeatability of the prepared biosensor (GOx@GA@FBT/5NF@SPE) was studied by measuring the amperometric response toward 20 μM glucose using the same electrode for six consecutive measurements (see Fig. 13C). The results showed a tiny variation (1.6%) which indicates the high repeatability of the sensing chips.Furthermore, the reproducibility testing was carried out using five different freshly prepared sensor chips, whereas each chip was exposed to glucose concentration (20 μM) while the electrochemical signals were collected from all chips (Fig. 13D). As a result, a small variation among all tested chips (2.3%) was obtained. Eventually, the lifetime of the prepared and stored biosensor chips was tested, whereas a batch (a group of) chips was prepared and stored at 4 °C, while the electrochemical performance of each chip was tested over different duration (as shown in Fig. 13E). The results showed a high stability for the chips.
3.8. Application for glucose detection in blood samples
In reality, glucose monitoring for health care is very crucial. Therefore, the newly developed sensor chips were applied for rapid detection of glucose in blood samples. As shown in Table 6, high recovery was obtained (90–110%); whereas all analyzed samples were confirmed with a reference laboratory test.| Sample no. (Age/year) | Biosensor mg dl−1 ± SDa | Laboratory mg dl−1 | Recovery% |
|---|---|---|---|
| a SD: standard deviation. | |||
| 1 (16) | 110 ± 4.0 | 100 | 110 |
| 2 (30) | 135 ± 6.0 | 140 | 96 |
| 3 (25) | 95 ± 6.0 | 100 | 95 |
| 4 (42) | 165 ± 8.0 | 153 | 107 |
| 5 (33) | 134 ± 5.0 | 130 | 103 |
| 6 (65) | 170 ± 3.0 | 167 | 101 |
| 7 (45) | 195 ± 7.0 | 203 | 96 |
| 8 (21) | 92 ± 6.0 | 102 | 90 |
| 9 (41) | 105 ± 9.0 | 115 | 91 |
| 10 (53) | 210 ± 5.0 | 214 | 98 |
4 Conclusion
Multiferroic nano-hexagonal FBT@NF composites were fabricated via solgel chemical reactions of sol nickel ferrite as coated layer and iron barium titanate@nickel ferrite powders. XRD analysis validates the successful fabrication of the di-phase FBT and NF composite nanomaterial with high crystalline degree. The TEM supports the well-organized hexagonal structure of FBT/NF, with highly ordered hexagonal lattice channels, providing clear visualization of the structural precision within the material.The conductivity of the ferroelectric/paraelectric (FBT/NF) composite was affected by the ratio, where the paraelectric particle hindered the interaction between the permanent dipoles of the ferroelectric. The conductivity and the Curie temperature of the composite systems decreased compared to the ferroelectric phase FBT. The electrical properties of the ferroelectric/paraelectric composites demonstrate the successful influence of each other, as well as the possibility of benefiting from the combination of anisotropic materials to produce materials with new properties that combine the properties of their components.
Nanostructures-based electrochemical biosensors provide powerful platforms for constructing reliable and portable biosensing devices. Thus, in the current study, the use of SPE for entrapping of a catalytically active enzyme (GOx) on the new nanostructures FBT/NF was performed. The developed sensor can be used for glucose detection with a wide linear of 2.7–1900 μM with a detection limit of 0.5 μM by using chronoamperometric technique. The biosensor was applied for glucose detection in blood samples without any treatment before analysis with high recovery compared with reference method. The obtained fast and high efficiency direct electron transfer from the redox active center of immobilized enzyme and screen-printed electrode by using the new synthesized FBT/NF nanostructures is a promising avenue for fabricating further excellent electrochemical biosensors. Which could be useful for monitoring cancer and infectious disease, drugs and analyzing disease biomarkers.
Data availability
The authors confirm that the data supporting the findings of this study are available within the article.Conflicts of interest
The authors declare that they have no known competing financial interests or personal relationships that could have appeared to influence the work reported in this paper.Acknowledgements
This research was funded under the auspices of its internal project (withID: 13020103 and 13020236), National Research Centre in Giza, Egypt.References
- A. M. El Nahrawy, A. Bakr, A. Hammad and B. Hemdan, Appl. Nanosci., 2020, 10, 3585–3601 CrossRef.
- A. Hammad, A.-F. Darwish and A. M. El Nahrawy, Appl. Phys. A, 2020, 126, 504 CrossRef.
- S. P. Muduli, L. Lipsa, A. Choudhary, S. Rajput and S. Parida, ACS Appl. Electron. Mater., 2023, 5, 3023–3037 CrossRef CAS.
- S. Maity, A. Sasmal and S. Sen, Mater. Sci. Semicond. Process., 2023, 153, 107128 CrossRef CAS.
- A. A. Aal, T. R. Hammad, M. F. Zawrah, I. K. Battisha and A. B. A. Hammad, Acta Phys. Pol., A, 2014, 126, 1318–1321 CrossRef.
- A. B. Abou Hammad, A. M. Mansour and A. M. El Nahrawy, Phys. Scr., 2021, 96, 125821 CrossRef.
- A. M. El Nahrawy, A. Hammad and A. e.-f. Mansour, Phys. Scr., 2021, 96, 115801 CrossRef.
- C. Polley, T. Distler, C. Scheufler, R. Detsch, H. Lund, A. Springer, D. Schneidereit, O. Friedrich, A. R. Boccaccini and H. Seitz, Mater. Today Bio, 2023, 21, 100719 CrossRef CAS PubMed.
- J. Jacob, N. More, K. Kalia and G. Kapusetti, Inflammation Regener., 2018, 38, 2 CrossRef PubMed.
- K. Kapat, Q. T. H. Shubhra, M. Zhou and S. Leeuwenburgh, Adv. Funct. Mater., 2020, 30, 1909045 CrossRef CAS.
- R. Atchudan, N. Muthuchamy, T. J. I. Edison, S. Perumal, R. Vinodh, K. H. Park and Y. R. Lee, Biosens. Bioelectron., 2019, 126, 160–169 CrossRef CAS PubMed.
- A. Mayeen, K. S, D. J. M. S, S. Thomas, D. Rouxel, J. Philip, R. Bhowmik and N. Kalarikkal, Dalton Trans., 2017, 47, 2039 RSC.
- Y. Cui, J. Briscoe, Y. Wang, N. V. Tarakina and S. Dunn, ACS Appl. Mater. Interfaces, 2017, 9, 24518–24526 CrossRef CAS PubMed.
- S. Selvarajan, P. Malathy, A. R. B. Suganthi and M. Rajarajan, J. Ind. Eng. Chem., 2017, 53, 201–212 CrossRef CAS.
- H. S. Magar, R. Y. A. Hassan and A. Mulchandani, Sensors, 2021, 21, 6578 CrossRef CAS PubMed.
- H. S. Magar, P. K. Brahman and R. Y. A. Hassan, Biosens. Bioelectron.: X, 2022, 10, 100124 CAS.
- H. S. Magar, H. Abdelghany, M. N. Abbas, U. Bilitewski and R. Y. A. Hassan, Microchem. J., 2023, 193, 109097 CrossRef CAS.
- H. S. Magar, M. E. Ghica, M. N. Abbas and C. M. A. Brett, Talanta, 2017, 167, 462–469 CrossRef CAS PubMed.
- H. S. Magar, M. E. Ghica, M. N. Abbas and C. M. A. Brett, Electroanalysis, 2017, 29, 1741–1748 CrossRef CAS.
- H. S. Magar, R. Y. A. Hassan and M. N. Abbas, Sci. Rep., 2023, 13, 2034 CrossRef CAS PubMed.
- M. N. Abbas and H. S. Magar, J. Solid State Electrochem., 2018, 22, 181–192 CrossRef CAS.
- H. S. Magar, M. N. Abbas, M. B. Ali and M. A. Ahmed, J. Solid State Electrochem., 2020, 24, 723–737 CrossRef CAS.
- H. S. Magar, E. E. A. E. Magd, R. Y. A. Hassan and A. M. Fahim, Microchem. J., 2022, 182, 107885 CrossRef CAS.
- M. N. Abbas and H. S. Amer, Curr. Pharm. Anal., 2008, 4, 90–100 CrossRef CAS.
- E. S. M. Duraia, B. M. Adebiyi, S. Das, H. S. Magar, G. W. Beall and R. Y. A. Hassan, Phys. E, 2024, 159, 115902 CrossRef CAS.
- T. H. Bui and J. H. Shin, Microchem. J., 2023, 191, 108924 CrossRef CAS.
- B. Ai, Z. Fan and Z. J. Wong, Microsyst. Nanoeng., 2022, 8, 5 CrossRef CAS PubMed.
- M. Shellaiah and K. W. Sun, Chemosensors, 2020, 8, 55 CrossRef CAS.
- G. L. Lin, A. X. Lin, M. Y. Liu, X. Q. Ye and D. W. Lu, Sens. Actuators, A, 2022, 346, 113885 CrossRef CAS.
- S. Dacrory, A. B. Abou Hammad, A. M. El Nahrawy, H. Abou-Yousef and S. Kamel, ECS J. Solid State Sci. Technol., 2021, 10, 083004 CrossRef CAS.
- A. B. Abou Hammad, B. A. Hemdan and A. M. El Nahrawy, J. Environ. Manag., 2020, 270, 110816 CrossRef CAS PubMed.
- A. B. A. Hammad, H. S. Magar, A. M. Mansour, R. Y. A. Hassan and A. M. E. Nahrawy, Sci. Rep., 2023, 13, 9048 CrossRef CAS PubMed.
- Y. Chen and K. Liu, Powder Technol., 2017, 313, 44–53 CrossRef CAS.
- M. Kurian and S. Thankachan, Open Ceram., 2021, 8, 100179 CrossRef CAS.
- W. Feng, J.-P. Hanke, X. Zhou, G.-Y. Guo, S. Blügel, Y. Mokrousov and Y. Yao, Nat. Commun., 2020, 11, 118 CrossRef CAS PubMed.
- C. R. Bowen and D. P. Almond, Mater. Sci. Technol., 2006, 22, 719–724 CrossRef CAS.
- D. Pradhan, S. Kumari, V. Sreenivas, P. T. Das, D. Pradhan, A. Kumar, J. Scott and R. Katiyar, Phys. Chem. Chem. Phys., 2016, 19, 210–218 RSC.
- S. F. Chérif, A. Chérif, W. Dridi and M. F. Zid, Arabian J. Chem., 2020, 13, 5627–5638 CrossRef.
- T. Rhimi, M. Toumi, K. Khirouni and S. Guermazi, J. Alloys Compd., 2017, 714, 546–552 CrossRef CAS.
- R. Nehru, T.-W. Chen, S.-M. Chen, T.-W. Tsen and X. Liu, Int. J. Electrochem. Sci., 2018, 7778–7788, DOI:10.20964/2018.08.14.
- R. Batool, A. Rhouati, M. H. Nawaz, A. Hayat and J. L. Marty, Biosensors, 2019, 9, 46 CrossRef CAS PubMed.
- M. Adeel, K. Asif, M. Rahman, S. Daniele, V. Canzonieri and F. Rizzolio, Adv. Funct. Mater., 2021, 31, 2106023 CrossRef CAS.
- G. Valdés-Ramírez and L. Galicia, Chemosensors, 2023, 11, 345 CrossRef.
- C. Li, M. Kurniawan, D. Sun, H. Tabata and J. J. Delaunay, Nanotechnology, 2014, 26, 015503 CrossRef PubMed.
- O. Smutok, T. Kavetskyy, T. Prokopiv, R. Serkiz, R. Wojnarowska-Nowak, O. Šauša, I. Novák, D. Berek, A. Melman and M. Gonchar, Anal. Chim. Acta, 2021, 1143, 201–209 CrossRef CAS PubMed.
- B. Tan and F. Baycan, ChemistrySelect, 2022, 7, e202103437 CrossRef CAS.
- M. A. Alharthi, M. Luqman, N. Shakeel and M. I. Ahamed, Inamuddin, J. Nanostruct. Chem., 2022, 13, 349–359 CrossRef.
- X. Bai and K.-K. Shiu, J. Electroanal. Chem., 2014, 720–721, 84–91 CrossRef CAS.
- Y. Piao, D. J. Han and T. S. Seo, Sens. Actuators, B, 2014, 194, 454–459 CrossRef CAS.
- Z. Chu, Y. Liu, Y. Xu, L. Shi, J. Peng and W. Jin, Electrochim. Acta, 2015, 176, 162–171 CrossRef CAS.
- L. Wang, X. Gao, L. Jin, Q. Wu, Z. Chen and X. Lin, Sens. Actuators, B, 2013, 176, 9–14 CrossRef CAS.
- C.-W. Hsu and G.-J. Wang, Biosens. Bioelectron., 2014, 56, 204–209 CrossRef CAS PubMed.
- V. Guzsvány, J. Anojčić, E. Radulović, O. Vajdle, I. N. Stanković, D. Madarász, Z. Kónya and K. Kalcher, Microchim. Acta, 2017, 184, 1987–1996 CrossRef.
| This journal is © The Royal Society of Chemistry 2024 |


