 Open Access Article
Effect of magnetic field on the rate performance of a Fe2O3/LiFePO4 composite cathode for Li-ion batteries†
Emmanuel Iheonu
Nduka‡
 a,
Nazgul
Assan‡
 a,
Mukagali
Yegamkulov
b,
Aliya
Mukanova
 ab and
Zhumabay
Bakenov
 *abc
*abc
aDepartment of Chemical and Materials Engineering, School of Engineering and Digital Sciences, Nazarbayev University, Astana 010000, Kazakhstan. E-mail: zbakenov@nu.edu.kz
bNational Laboratory Astana, Nazarbayev University, Astana 010000, Kazakhstan
cInstitute of Batteries LLC, Nazarbayev University, Astana 010000, Kazakhstan
First published on 11th November 2024
Abstract
Lithium iron phosphate (LiFePO4 or LFP) is a widely used cathode material in lithium-ion batteries (LIBs) due to its low cost and environmental safety. However, LFP faces challenges during high-rate operation and prolonged cycling. Magnetic field (MF) can enhance ionic conductivity and reduce polarization in the LFP cathode, particularly when magnetically sensitive iron oxide is added to the cathode. In this study, LiFePO4 was optimized by simply adding Fe2O3 (FO) nanoparticles and drying the composite cathode (FO/LFP) with and without applying MF. Electrochemical tests demonstrated that the optimized samples prepared at two concentrations of Fe2O3 (1 wt% and 3 wt%) exhibited improved electrochemical characteristics and inhibited polarization upon operation. Lithium-ion diffusion coefficient calculations revealed an increase in this value in the case of the MF-assisted samples compared to their non-MF counterparts. The 1 wt% FO/LFP cathode dried under an MF showed noticeably high reversible capacity, slow capacity decay, and enhanced rate capability, especially when cycled at a high current density of 5C. This research successfully demonstrated a relatively facile method to improve the rate performance of LiFePO4 cathodes that can be easily incorporated into the large-scale battery production.
1. Introduction
Lithium-ion batteries (LIBs) have become the base of modern energy storage systems, powering everything from handheld gadgets to electric vehicles and grid-scale energy storage systems, due to their low maintenance, high power, excellent performance, and longevity.1–3 Among LIB cathodes, lithium iron phosphate (LiFePO4) is regarded as one of the most widely used cathode materials. Nevertheless, its drawbacks include relatively low operating potential, insufficient rate performance, weak electron conductivity, low Li ion diffusion coefficient, and low volumetric specific capacities across electrodes, making LiFePO4 an unviable cathode material from an economic standpoint.2–7 To overcome these challenges, many efforts have relied on internal strategies, such as modifying or optimizing the cell components via coating and doping, morphological control, and particle size reduction.6,8–10 Although these strategies could improve the electrochemical performances, they still have their advantages and disadvantages. For instance, increased surface area necessitates using more binders during electrode fabrication, which increases cell polarization. Moreover, a decrease in the particle size reduces the tap density, and the actual role of metal doping has been complicated and contentious thus far.11,12 There is another effective technique of applying an external force, for example magnetic field (MF), which is able to affect the electrochemical characteristics of LIBs. It was shown that the Li ion diffusion in LiFePO4 primarily occurs through one-dimensional channels along the crystal b-axis (010). However, by controlling the particle shape based on anisotropy, which significantly influences the crystal growth, LiFePO4 can achieve a high rate of Li+ diffusion, thereby enabling excellent performances in LiFePO4 batteries.13,14 According to Gao et al., when an MF is imposed perpendicular to an electrode surface, the tiny crystals align along the b-axis coordinate (010), with the half-cell's operating direction, thereby increasing Li+ diffusion along the channel.1 Another research demonstrated that when an MF is applied in the synthetic process of electrode materials, the nucleation and growth processes shift, resulting in anisotropy and modifying the crystal lattice, thereby decreasing the surface energy, directional expansion along the easy axis and increasing dipoles.15 Further, it was shown that when magnetic moments of materials are exposed to an MF, they exhibit a precise level of magnetism known as magnetization, modifying the crystal orientation and boosting the high-rate and cycling performance in LIBs.16 For example, Zhou et al. aligned LiFePO4 monocrystalline platelets along the b-axis to enhance high-rate performance and increase Li+ diffusion coefficients, which boosted the capacity for rapid discharge using a 0.5 T MF.4 C. Kim et al. investigated the magnetism and magnetic susceptibility of LiFePO4, demonstrating lower electrode polarization and higher reversible capacity using a 6 T superconducting magnet system.5Although the MF shows a positive effect towards better performance in LIBs, the use of magneto-sensitive additives such as iron-based oxides (α-Fe2O3) is being investigated as a promising approach to enhance this effect and obtain even better electrochemical, magnetic, and structural characteristics of LIB electrodes.17,18 In the synthesis of LiFePO4, Fe2O3 (FO) has been seen as a promising magnetic-sensitive nanoparticle (MNP) due to its abundance, chemical stability, high theoretical specific capacity, low cost, and environmentally friendly attributes.19 Liu et al. synthesized a LiFePO4/C cathode material using Fe2O3, which showed excellent capacity retention and reversibility with 145.8 mA h g−1 at 0.2C.17 Wang et al. synthesized LiFePO4/C composites by a carbothermal reduction method using Fe2O3 as an iron source, and the maximum discharge capacity (156 mA h g−1) was achieved using sucrose as a carbon source at 0.1C.20 Further, Ho-Ming et al. applied γ-Fe2O3 at different concentrations to prepare LiFePO4 composite cathodes, and among them, the electrode containing 15 wt% γ-Fe2O3 demonstrated a high average specific discharge capacity at a cycling rate of 10C.21 This suggests that incorporating Fe2O3 into the electrode during slurry preparation offers a simple and less expensive strategy to enhance the power density and cycling life of LIBs.
Hence, to solve the above-mentioned issues, we conducted an experimental study to assess how MF and magnetically responsive Fe2O3 nanoparticles affect the performance of fast-charging LIBs. Specifically, we used a permanent magnet with an intensity of 0.3 T solely during the fabrication of the cathode slurry. In contrast to the results of previous reports,4,5 where a monocrystalline active material (LiFePO4) was synthesized and aligned along the b axis via magnetic orientation to investigate the rate performance of LiFePO4, we employed a polycrystalline commercial LiFePO4 active material and mixed it with Fe2O3 MNPs during slurry preparation, and the thus-prepared slurry was dried on a permanent 0.3 T magnet. We believe that utilizing MF with a moderate intensity of 0.3 T makes it easy to incorporate the investigated process into the LIB plants with large production lines, which along with the use of commercial polycrystalline LFP makes this process attractive for practical applications.
2. Materials and methods
2.1. Chemicals and instruments
Commercial lithium iron phosphate (LiFePO4, purity 99.9%, MTI Corporation, USA) was used as an active material, acetylene black (AB, purity 99.9%, MTI Corporation, USA) with a net weight of 50 g per bottle was used as a conductive substance, and iron(III) oxide was used as magnetic-sensitive nanoparticles (dispersion nanoparticles, Sigma-Aldrich, Co., USA). The binder was polyvinylidene fluoride with a net weight of 1100 kg mol−1 (PVDF, purity 99.5%, MTI Corporation, USA). The solvent was N-methyl 2-pyrrolidone (NMP, purity 99.8%, Sigma-Aldrich, Co., USA). Before slurry preparation, the active material, PVDF, and conductive additives were pre-dried in a vacuum oven at 60 °C for 12 hours to minimize the residual moisture content.A neodymium magnet (diameter: 70 mm; thickness: 40 mm) with an intensity of 0.3 T (Astana, Kazakhstan) was used during the electrode drying process.
2.2. Sample characterization
The crystal and phase structures of the prepared electrode materials were determined by X-ray diffraction (XRD, MiniFlex benchtop, Rigaku Co., Japan) with Cu Kα radiation (λ = Kα = 1.541862 Å) at 2θ in the range from 10° to 70° at a scanning speed of 1° min−1. The electrodes were fabricated by a doctor blade technique using an Al foil current collector and dried for 6 hours with and without MF. The dried samples were punched into circular electrodes of 14 mm diameter.Two types of scanning electron microscopes (SEM, JSM-7500F JEOL, Japan, and Crossbeam 540, ZEISS, Germany) were used to analyze the sample particle size, morphology, and thickness. To analyze the average thickness of each electrode, a total of 100 points were measured for each of the electrode samples using the JMicroVision software (v1.3.4), as shown in Fig. S3a (ESI).† This process was repeated five times for all electrodes to ensure the accuracy and reliability of the measurements. Further, transmission electron microscopy (TEM, JEM-1400 plus, JEOL, Japan) was performed to determine the particle size of Fe2O3 (FO).
2.3. Preparation and characterization of Fe2O3
First, 25 mL of Fe2O3 nanoparticle dispersion was placed in a vial and subjected to drying using a freeze dryer (Labconco, Co., USA) at −50 °C under reduced pressure (10 Pa) for two days. The resulting yellow-colored FO nanoparticle powder was transferred to a plastic tube for storage. The nanoparticles were stored at 60 °C in a vacuum oven to prevent moisture effects and potential degradation. To determine the particle size of FO, 5 mg of FO was diluted in 5 mL of ethanol, and the solution was dropped onto a holey carbon support film-coated Cu microgrid (Ted, Pella, Inc., USA). Within 5 minutes, the grid was transferred to a vacuum oven and dried overnight. Then, the grid underwent hydrophilic treatment in a glow discharge irradiation chamber and used for TEM investigations at an accelerating voltage of 80 kV. To analyze the average particle size, 100 points were measured for each TEM image analysis using the JMicroVision software (v1.3.4), as shown in Fig. S3b (ESI).† This process was repeated five times for all images to ensure the accuracy and reliability of the measurements.2.4. Cathode preparation
The cathode slurries consisted of LiFePO4, PVDF, AB, and Fe2O3 prepared in weight ratios of 80![[thin space (1/6-em)]](https://www.rsc.org/images/entities/char_2009.gif) :
:![[thin space (1/6-em)]](https://www.rsc.org/images/entities/char_2009.gif) 10
10![[thin space (1/6-em)]](https://www.rsc.org/images/entities/char_2009.gif) :
:![[thin space (1/6-em)]](https://www.rsc.org/images/entities/char_2009.gif) 10
10![[thin space (1/6-em)]](https://www.rsc.org/images/entities/char_2009.gif) :
:![[thin space (1/6-em)]](https://www.rsc.org/images/entities/char_2009.gif) 0, 80
0, 80![[thin space (1/6-em)]](https://www.rsc.org/images/entities/char_2009.gif) :
:![[thin space (1/6-em)]](https://www.rsc.org/images/entities/char_2009.gif) 10
10![[thin space (1/6-em)]](https://www.rsc.org/images/entities/char_2009.gif) :
:![[thin space (1/6-em)]](https://www.rsc.org/images/entities/char_2009.gif) 9
9![[thin space (1/6-em)]](https://www.rsc.org/images/entities/char_2009.gif) :
:![[thin space (1/6-em)]](https://www.rsc.org/images/entities/char_2009.gif) 1, and 80
1, and 80![[thin space (1/6-em)]](https://www.rsc.org/images/entities/char_2009.gif) :
:![[thin space (1/6-em)]](https://www.rsc.org/images/entities/char_2009.gif) 10
10![[thin space (1/6-em)]](https://www.rsc.org/images/entities/char_2009.gif) :
:![[thin space (1/6-em)]](https://www.rsc.org/images/entities/char_2009.gif) 7
7![[thin space (1/6-em)]](https://www.rsc.org/images/entities/char_2009.gif) :
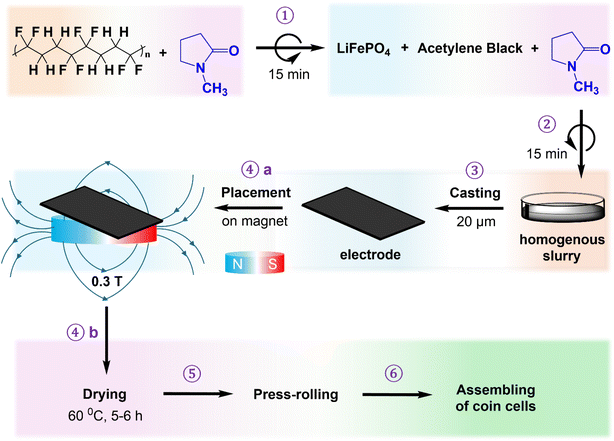
:![[thin space (1/6-em)]](https://www.rsc.org/images/entities/char_2009.gif) 3 in 600 μL n-methyl pyrrolidone solvent (NMP). The slurries were mixed using planetary centrifugal vacuum mixers (ARV-310CE, Japan) at 1200 rpm and under 98.2 kPa for 15 minutes. The samples were mixed into two cycles (30 minutes total) to achieve homogenous distribution of the slurry components (Scheme 1, steps 1 and 2). The slurry was then coated onto an Al foil current collector with a 20 μm doctor blade (Scheme 1, step 3), placed on a magnet of 0.3 T (Scheme 1, step 4a), and dried at 60 °C under vacuum for 6 hours to obtain a uniformly dispersed cathode (Scheme 1, step 4b), denoted as LFP-MF, 1% FO/LFP-MF, and 3% FO/LFP-MF, respectively. The reference slurries were dried without a magnet to produce a naturally distributed cathode labeled as LFP, 1% FO/LFP, and 3% FO/LFP, respectively.
3 in 600 μL n-methyl pyrrolidone solvent (NMP). The slurries were mixed using planetary centrifugal vacuum mixers (ARV-310CE, Japan) at 1200 rpm and under 98.2 kPa for 15 minutes. The samples were mixed into two cycles (30 minutes total) to achieve homogenous distribution of the slurry components (Scheme 1, steps 1 and 2). The slurry was then coated onto an Al foil current collector with a 20 μm doctor blade (Scheme 1, step 3), placed on a magnet of 0.3 T (Scheme 1, step 4a), and dried at 60 °C under vacuum for 6 hours to obtain a uniformly dispersed cathode (Scheme 1, step 4b), denoted as LFP-MF, 1% FO/LFP-MF, and 3% FO/LFP-MF, respectively. The reference slurries were dried without a magnet to produce a naturally distributed cathode labeled as LFP, 1% FO/LFP, and 3% FO/LFP, respectively.
2.5. Electrochemical cell assembly and electrochemical characterization
The dried cathodes were roll-pressed using a calendaring machine (Nonheating WCRP-1015G, Hohsen Co., Japan) and punched into disks of 14 mm diameter, which were used for electrochemical tests. The electrochemical properties of the electrodes were evaluated in CR2032 coin-type cells (Hohsen Co., Japan), which were assembled in an Ar-filled glovebox (oxygen and water <0.1 ppm, LabMaster, Mbraun, Germany). The separator and electrolyte were polypropylene membrane (Celgard 2400) and 1 M LiPF6 in ethylene carbonate and dimethyl carbonate (DMC![[thin space (1/6-em)]](https://www.rsc.org/images/entities/char_2009.gif) :
:![[thin space (1/6-em)]](https://www.rsc.org/images/entities/char_2009.gif) EC, 1
EC, 1![[thin space (1/6-em)]](https://www.rsc.org/images/entities/char_2009.gif) :
:![[thin space (1/6-em)]](https://www.rsc.org/images/entities/char_2009.gif) 1 v/v), respectively, with a lithium metal chip as a reference and counter electrode. The cyclic voltammogram (CV) measurements were performed at room temperature on a VMP3 potentiostat/galvanostat (Biologic Inc., France) at different scan rates ranging within 0.1–0.5 mV s−1 from 2.8 to 4.2 V vs. Li/Li+. Galvanostatic charge/discharge cycling was carried out at cutoff potentials 2.8 to 4.2 V vs. Li/Li+ at various cycling rates from 0.1 to 5C using a Neware battery tester (Neware Co., China). AC electrochemical impedance spectroscopy (EIS) was performed using a potentiostat/galvanostat within a frequency range of 100 kHz to 0.1 Hz and an amplitude of 10 mV. The LFP cathode prepared with or without magnetic field were investigated using a Hall effect measurement system (HMS-5500, Ecopia Inc., South Korea), with a magnetic field of 0.53 T at a temperature of 297.83 ± 1.72 K. The sample's slurries were doctor blade-coated to a thickness of 20 μm onto a non-conductive polymer-laminated aluminum foil and were cut into 1 × 1 cm samples after drying. The samples were tested at 5 mA and 15 mA (Fig. 6 and S6 (ESI)†).
1 v/v), respectively, with a lithium metal chip as a reference and counter electrode. The cyclic voltammogram (CV) measurements were performed at room temperature on a VMP3 potentiostat/galvanostat (Biologic Inc., France) at different scan rates ranging within 0.1–0.5 mV s−1 from 2.8 to 4.2 V vs. Li/Li+. Galvanostatic charge/discharge cycling was carried out at cutoff potentials 2.8 to 4.2 V vs. Li/Li+ at various cycling rates from 0.1 to 5C using a Neware battery tester (Neware Co., China). AC electrochemical impedance spectroscopy (EIS) was performed using a potentiostat/galvanostat within a frequency range of 100 kHz to 0.1 Hz and an amplitude of 10 mV. The LFP cathode prepared with or without magnetic field were investigated using a Hall effect measurement system (HMS-5500, Ecopia Inc., South Korea), with a magnetic field of 0.53 T at a temperature of 297.83 ± 1.72 K. The sample's slurries were doctor blade-coated to a thickness of 20 μm onto a non-conductive polymer-laminated aluminum foil and were cut into 1 × 1 cm samples after drying. The samples were tested at 5 mA and 15 mA (Fig. 6 and S6 (ESI)†).
3. Results and discussions
The crystalline characteristics of the LiFePO4 powder sample and related cathodes, prepared with and without MF, were investigated by XRD (Fig. 1). The significant diffraction peaks of the sample match the LiFePO4 standard pattern, and the absence of any additional peaks suggests that the polycrystalline LFP samples contained no impurities. The LFP (Fig. 1a), 1% FO/LFP (Fig. 1b), and 3% FO/LFP (Fig. 1c) electrodes dried with and without magnet acquire diffraction peaks of the orthorhombic Pnma space group, which corresponds to the standard software data (PDF-4+ 2023, JCPDS card no. 01-090-1862, shown in Fig. S1, ESI†). According to the literature data,4 the preferred growth pattern of particles may be studied by using the intensity ratio I(020)/I(111). A higher ratio than the standard value of 0.87 (from JCPDS card no. 01-090-1862) indicates a layered structure and usually represents preferred orientation along the atomic planes. For LFP-MF, the ratio increases to 0.90, compared to 0.88 for LFP. This shows that magnetic placement causes LFP to position itself perpendicularly to the (020) surface. Considering the ratio of 1% FO/LFP-MF and 3% FO/LFP-MF, it increases to 1.01 and 1.10, respectively, while for 1% FO/LFP and 3% FO/LFP, the values are 0.90 and 0.98. This decrease suggests that the magnetic field (MF) enhances the positioning along the (020) plane; this also affects the electrode compactness.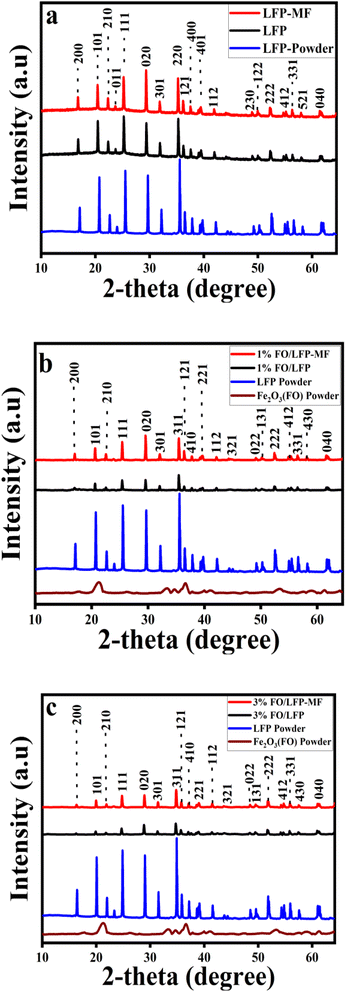 | ||
| Fig. 1 XRD patterns of the cathodes: (a) LFP and LFP-MF; (b) 1% FO/LFP and 1% FO/LFP-MF; and (c) 3% FO/LFP and 3% FO/LFP-MF. | ||
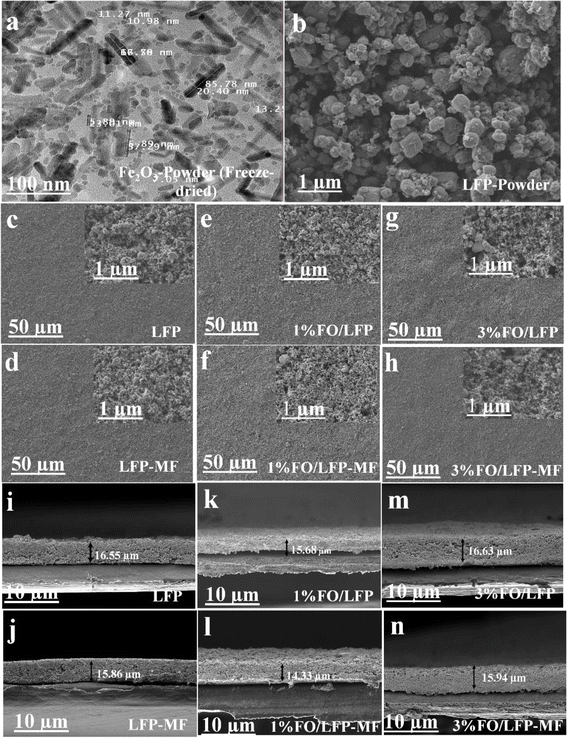
TEM was used to analyze the particle size of Fe2O3, with the results shown in Fig. 2. These measurements revealed an average FO nanoparticle size of approximately 91.18 ± 2.26 nm, showcasing rod-shaped and spherical morphologies. Further, SEM was conducted to examine the morphology of the LiFePO4 cathode powder, and the possible effect of MF on the electrode thickness. At first, we checked the possible morphological changes by top-view SEM imaging. From Fig. 2b, it was observed that the particles in the initial LiFePO4 powder are spherical, with evenly dispersed grains. Further, Fig. 2c and d show the top-view SEM image of the LFP and LFP-MF cathodes, while Fig. 2e and f demonstrate 1% FO/LFP and 1% FO/LFP-MF cathodes, and Fig. 2g and h show the top-view SEM images of 3% FO/LFP and 3% FO/LFP-MF cathodes. The images reveal that the cathode powders were well mixed with carbon in composite electrodes. No difference could be observed in the top-view images of all electrodes subjected to MF and without MF because the polycrystalline nature of the particles does not allow tracking their rotation like in the case of single-crystal particles or nanosheets.1 Next, we investigated the changes in the cross-sectional thickness of all electrodes by SEM. As shown in Fig. 2i and j, the cross-sectional SEM images of the electrodes revealed the cathode thickness for LFP to be 16.55 μm with a standard mean error (SME) of 0.54 μm, while LFP-MF had a smaller thickness of 15.85 ± 0.82 μm. Fig. 2k and l show the thickness of 1% FO/LFP 15.68 ± 0.70 μm, while for 1% FO/LFP-MF, it was around 14.33 ± 0.71 μm. In Fig. 2m and n, the cathode thickness of 3% FO/LFP is measured at 16.63 ± 0.88 μm, while 3% FO/LFP-MF electrodes show a thickness of 15.94 ± 0.98 μm. Despite the thicknesses for the samples with/without MF overlap within the SME, it can be seen that the MF treatment affects the cathode thickness. Notably, there is a consistent trend across the different electrode compositions, with the cathodes treated with MF exhibiting reduced thickness compared to those without MF. The mechanism behind this phenomenon could be possibly attributed to the fact that the magneto-sensitive particles (FO) and LFP may be pulled towards the bottom of the electrode by a MF. This process could shrink the thickness of the electrode, forming a one-dimensional channel through which Li+ can move and diffuse more easily, therefore, enhancing the porosity of the electrode. This effect turned out to be significant for 1% FO-MF, resulting in a lower thickness, but was not pronounced for 3% FO-MF. The reasons for such a phenomenon require further investigation, including other electrode materials, such as LiCoO2 and, probably, some other ‘less paramagnetic’ materials, to further clarify and distinguish the role of the magnetic particle additives (FO) in compacting the electrode.
The above-mentioned results emphasize the significance of the MF treatment and FO in affecting the electrodes' structural properties, which could have implications for the overall performance and efficiency of the battery.
The CV experiments were performed to investigate the MF effect on the electrochemical performance of the electrodes. The potential peak position differences (ΔV) between the oxidation and reduction peaks were calculated using the data from the fourth cycle of each cell to evaluate the performance variation due to the magnetic field effect.4 All electrodes displayed distinct reversible redox peaks (Fig. 3) corresponding to the electrochemical transformation of Fe2+/Fe3+ phases, indicating highly reversible Li+ deintercalation and intercalation processes.5,22,23 As shown in Fig. 3a–c, the LFP-MF, 1% FO/LFP-MF, and 3% FO/LFP-MF electrodes exhibit notable anodic peaks at 3.53, 3.52 and 3.58 V (vs. Li/Li+ for all electrochemical measurements) and cathodic peaks around 3.34, 3.33, and 3.29 V, respectively. The cathodic and anodic peak differences (ΔV) of the electrodes, which also reflect the kinetic polarization upon REDOX processes, in this case, were 0.19, 0.18, and 0.29 V, respectively. This is lower than that of non-MF counterparts LFP (0.20 V), 1% FO/LFP (0.22 V), and 3% FO/LFP (0.36 V). The prominent anodic peaks of LFP, 1% FO/LFP, and 3% FO/LFP occurred at 3.54, 3.55, and 3.61 V, while the cathodic peaks occurred at 3.34, 3.33, and 3.25 V. It should be noted that a lower ΔV indicates enhanced electrode kinetics and reversibility, thus reflecting lower electrochemical polarization.4 The higher CV test activity of the cells with MF can be attributed to the influence of magnetic placement on the macrostructure and particle packing of the polycrystalline LFP material during the electrode preparation, such as particle orientation, their denser particle packing, and requiring shorter Li ion diffusion in a thinner electrode. These effects led to an enhanced electrochemical performance, including a stronger CV response. Further increasing the additive content increases the polarization, which slows down the electrode's kinetics, affecting its performance negatively. Therefore, these results imply that the electrodes, dried under MF, exhibit improved electrode kinetics, reversibility, and slower capacity deterioration during long-term cycling, as shown in Fig. S5,† while exhibiting higher current (which reflects the reaction rate) values than those of all the electrodes prepared without magnetic field (WMF).
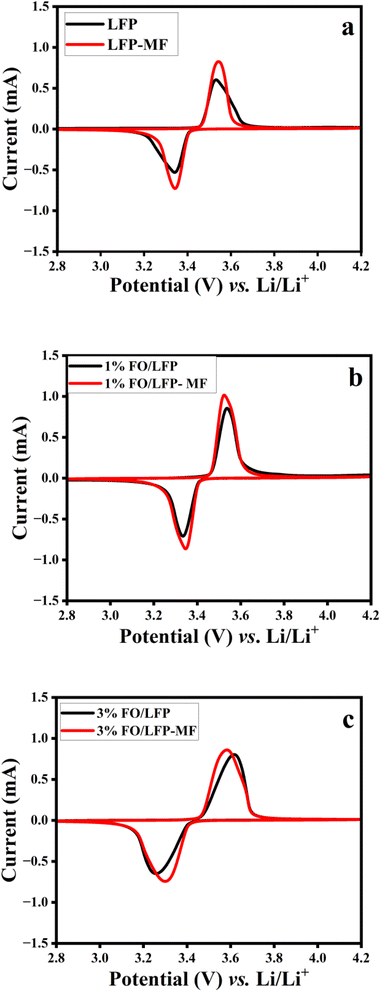 | ||
| Fig. 3 (a) CV scans (4th cycle) of LFP and LFP-MF; (b) 1% FO/LFP and 1% FO/LFP-MF; and (c) 3% FO/LFP and 3% FO/LFP-MF. | ||
Following the CV-confirmed evidence of positive MF's effects on the FO/LFP electrode kinetics, the diffusion coefficients for the studied systems were estimated to confirm the impact of MF on the electrode operation. The diffusion coefficient was estimated based on the CV measurements at scan rates ranging from 0.5 to 0.1 mV s−1. The results of these investigations are presented in Fig. 4 and Table 1. Notably from Fig. 4, as the scan rate increases, distinct redox peaks arise in the CV profiles of the electrodes, thus indicating a rise in the electrochemical reaction rate. At the same time, the redox peaks potential difference increases as well (Fig. S2a–c, ESI†), showing that the electrode polarization rises. The Randles–Sevcik equation was used to determine the diffusion coefficient of Li+ (DLi+) for the electrodes.24 From Fig. 4a, the LFP displays a decrease in the current peaks and a diffusion coefficient of 2.14 × 10⁻⁴ cm2 s−1 compared with LFP-MF (Fig. 4b) that has a higher current peak and diffusion coefficient of 4.14 × 10⁻⁴ cm2 s−1 (Fig. S2a, ESI†). As per Fig. 4c and d, the diffusion coefficient of the 1% FO/LFP cathode is 2.45 × 10⁻⁴ cm2 s−1, which is lower than that of 1% FO/LFP-MF (4.06 × 10⁻⁴ cm2 s−1, Fig. S2b, ESI†). Further, Fig. 4e shows that 3% FO/LFP exhibits a slight decrease in the current peaks and a lower diffusion coefficient of 1.32 × 10⁻⁴ cm2 s−1 compared with 3% FO/LFP-MF (2.30 × 10⁻⁴ cm2 s−1) in Fig. 4f and S2c (ESI).† However, all the electrodes dried under MF exhibited superior electrochemical properties and higher lithium diffusion coefficients (Table 1) than those of the WMF electrodes (dried without MF). These results confirm that a magnetic field treatment could enhance the Li+ movement by improving the lithium diffusion kinetics and the overall performance of the battery.
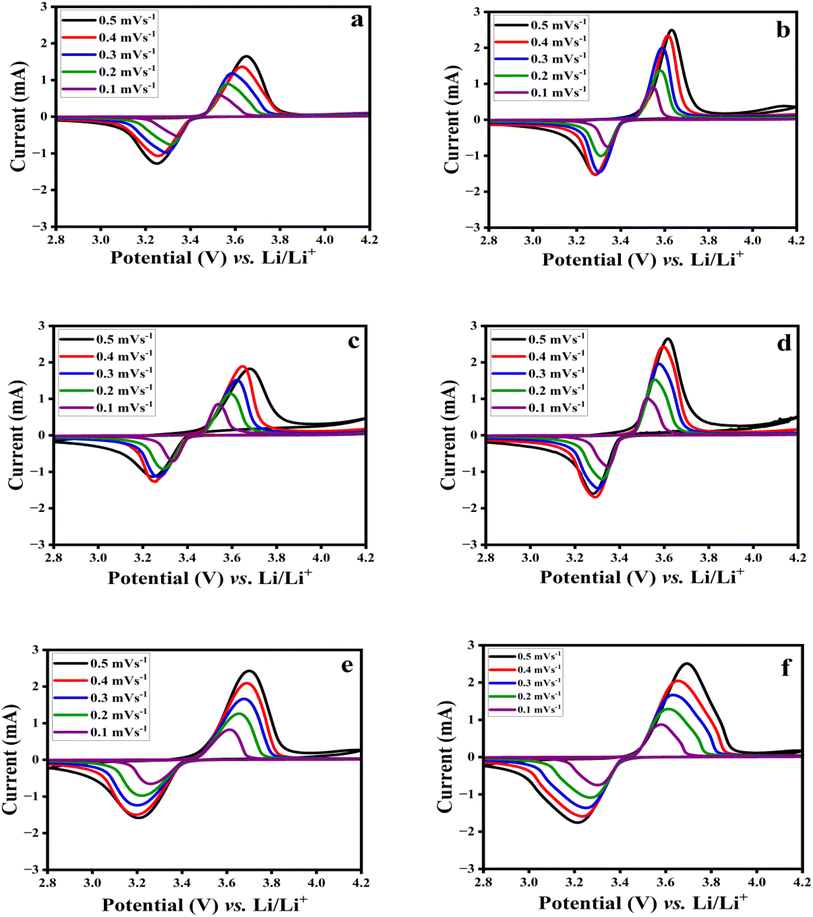 | ||
| Fig. 4 CV curves at various rates from 0.1 to 0.5 mV s−1 for (a) LFP, (b) LFP-MF, (c) 1% FO/LFP, (d) 1% FO/LFP-MF, (e) 3% FO/LFP, and (f) 3% FO/LFP-MF. | ||
| Sample | Li+ diffusion coefficient (cm2 s−1) | Charge-transfer resistance (R2) after the 5th CV scan (ohm) | ||
|---|---|---|---|---|
| Bare | MF | Bare | MF | |
| LFP | 2.14 × 10⁻⁴ | 4.14 × 10⁻⁴ | 35.79 | 31.44 |
| 1% FO/LFP | 2.45 × 10⁻⁴ | 4.06 × 10⁻⁴ | 20.52 | 18.64 |
| 3% FO/LFP | 1.32 × 10⁻⁴ | 2.30 × 10⁻⁴ | 45.51 | 30.40 |
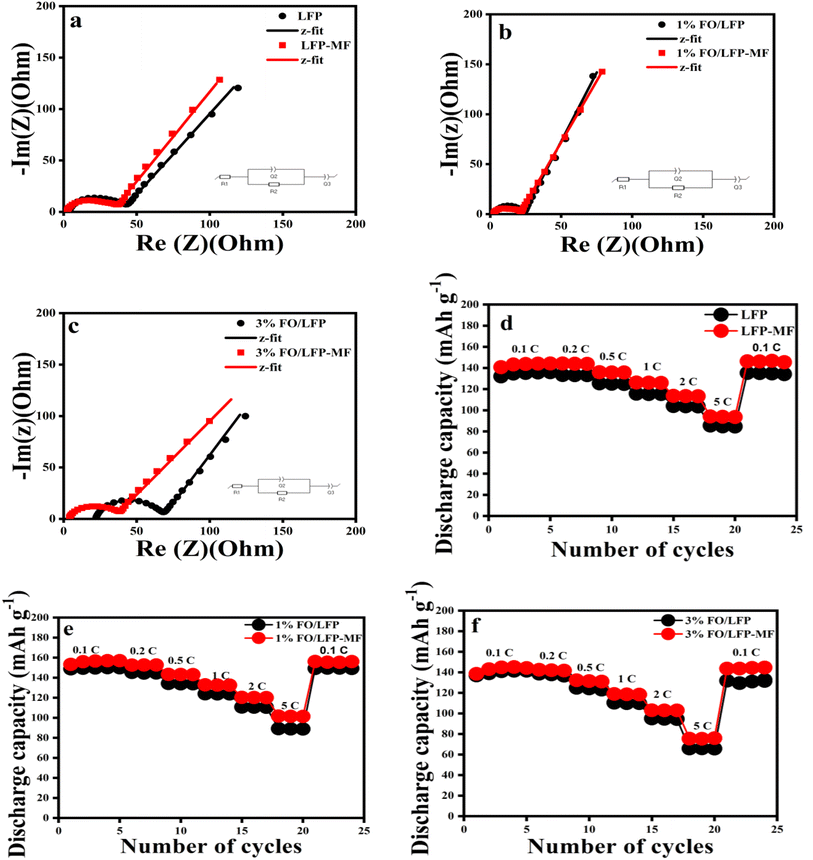
Further, the EIS analysis was utilized to assess the effect of MF on the charge transfer resistance of the electrodes. Fig. 5 shows the Nyquist plots for all cathodes after the 5th CV cycle for all electrodes scanned at 0.1 mV s−1. All EIS spectra consist of a semicircle in the high- to medium-frequency range and a straight line in the low-frequency range. The first semicircle in the high- to medium-frequency region is attributed to R1 and Q elements in the equivalent circuit (Fig. 5), where R1 represents particle-to-particle and particle-to-collector contact resistances, while R2 signifies the charge-transfer resistance between the electrolyte and the active material. Q represents the constant phase element (CPE), and W (Q3) denotes a Warburg impedance primarily associated with the Li+ diffusion within the bulk electrode.4,5 From the EIS data, all cathodes dried under MF exhibited lower charge transfer resistances than those of the WMF cathode. Thus, the circuit's total resistance is primarily determined by the sum of R2 and R1. After fitting using the Biologic (EC-Lab software, V11.60), the R2 values of LFP-MF, 1% FO/LFP-MF, and 3% FO/LFP-MF samples were determined to be 31.44, 18.64, and 30.40 Ω, respectively. Comparatively, the internal resistance of LFP, 1% FO/LFP, and 3% FO/LFP samples was higher than those placed on a magnetic field, as seen in Table 1. The higher internal resistance observed in the 3% FO/LFP compared to the 1% FO/LFP electrode can be attributed to the low conductivity of FO, and probably caused by recurrent electrode expansion/shrinkage due to a thermal release or Li+ insertion/de-insertion within the multilayer structure for the electrode.4 In the case of the electrode samples dried under a magnetic field, the electrochemical impedance decreases during cycling versus the WMF electrodes due to reduced polarization. These results indicated that MF could improve the reaction kinetics, resulting in a higher rate capability and enhanced performance of the electrode materials.
The galvanostatic charge–discharge performance of the cathodes was assessed to comprehensively investigate any changes in their electrochemical behavior caused by the magnet's placement during the preparation of the cathode. Fig. S4a–c (ESI)† depicts the charge–discharge profiles for all electrodes at 0.1 and 0.2C rates and 4.2–2.8 V cutoff potentials for the 4th cycle. The 4th cycle was selected because the cell performance stabilizes during the initial cycles. According to the data in Fig. S4a–c (ESI),† the specific discharge capacities for LFP, 1% FO/LFP, and 3% FO/LFP at 0.1C were 150.2, 148.8, and 144.3 mA h g−1, respectively, which are slightly lower than those of LFP-MF (152.0 mA h g−1), 1% FO/LFP-MF (150.0 mA h g−1), and 3% FO/LFP-MF (148.6 mA h g−1). At a higher cycling rate of 0.2C, the capacity gap between two batches of samples became slightly more obvious, with the electrodes placed under a magnetic field showing a higher discharge capacity. Further, Fig. S5 (ESI)† shows a prolonged cycling performance of 1% FO/LFP-MF at 0.2C over 100 cycles. The results confirm the stability and durability of the electrode material in extended cycling with excellent capacity retention.
Furthermore, the electrochemical performance of LiFePO4 electrodes was investigated at different C rates. Fig. 5d–f shows the rate capability of the electrodes, and it can be seen that the electrodes dried under MF had a higher reversible capacity and a slower capacity degradation compared to their counterparts. Expectedly, the capacity of all electrodes (with and without MF) decreases as the charge–discharge rate rises due to the kinetics limitations. Although there is no obvious difference between the discharge capacities of LFP electrodes placed under MF and WMF at a rate less than 1C, as observed in Fig. 5d–f, the significant variations become evident at a higher discharge rate. At 1C, the discharge capacities of LFP-MF, 1% FO/LFP-MF, and 3% FO/LFP-MF were approximately 9.21, 7.01, and 7.73% higher than WMF-electrodes. At 2C, LFP-MF exhibited a 9.25% higher capacity, while 1% FO/LFP-MF and 3% FO/LFP-MF showed minor improvements of 8.78% and 9.02%, respectively, compared with the WMF-electrode samples. At 5C, all the LFP electrodes with MF displayed higher discharge capacities than the WMF-electrode, with increases of 10.65% for LFP-MF, 15.90% for 1% FO/LFP-MF, and 15.63% for 3% FO/LFP-MF. It can be seen that the cells with the electrode containing 1% FO had the highest average capacity at a rate of 5C. This implies that 1% FO concentration functions with a less negative effect at this loading. As a result, a notable difference in discharge capacities between LFP electrodes placed under MF and WMF at higher charge–discharge rates is probably due to the severe polarization induced by a high current. This effect, enhanced by the magnetic field during the drying process, influences the overall performance of the battery system and contributes to the observed differences in discharge capacities. LFP-MF electrodes have an accelerated Li+ diffusion, accompanied by increased discharge capacities, slower capacity decay, and high reversibility at high rates compared to LFP without magnet placement.
The effect of the magnetic field and FO on the conductivity of the obtained LFP cathode samples was investigated using Hall effect measurements, as presented in Fig. 6. The highest conductivity, 1.12 S cm−1, was observed for the 1% FO/LFP-MF sample, optimizing the electron transport. The differences in conductivity values for the LFP samples are shown in Fig. 6. However, when the FO percentage increased to 3%, the conductivity worsened, indicating that excess FO impairs electron transport.
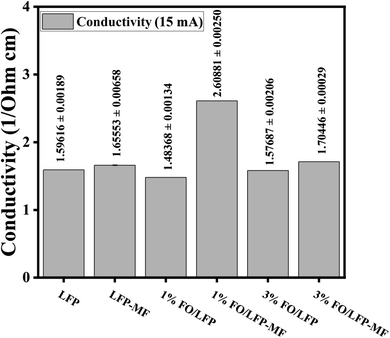 | ||
| Fig. 6 Hall effect measurement results of LFP, 1% FO/LFP and 3% FO/LFP samples with/without MF at 5 mA. | ||
Thus, the FO additive enhances the electrochemical performance of LiFePO4 cathodes, both with and without the application of a magnetic field. Despite observing no significant changes in the morphology or crystalline characteristics following SEM and XRD analyses (Fig. 1 and 2), the electrodes prepared under the magnetic field exhibited not only higher density but also improved pathways for Li ion migration, crucial for enhancing the battery performance, while the electrodes prepared without MF appeared thicker and loosen, with randomly dispersed Li ion migration paths. Further, the electrodes with 1% FO/LFP benefited from enhanced FO infusion under a magnetic field, resulting in improved electrochemical performance. However, the electrodes containing 3% FO/LFP experienced a decrease in their performance, supposedly, due to the FO low electrical and ionic conductivity, which may have affected the network necessary for efficient Li ion insertion/de-insertion. This phenomenon worsens charge transfer resistance, as evidenced by our EIS measurements (Fig. 5c), thereby impeding the electrode's charge and discharge kinetics. Therefore, while LiFePO4 cathodes with MF-assisted FO incorporation could enhance the electrode density and Li ion pathways, the electrical and ionic conductivities of FO play a critical role in determining the electrochemical performance and efficiency of the electrode in practical battery applications.
4. Conclusion
In this study, Fe2O3 powder was added into commercial LiFePO4 at two concentrations to prepare composite cathodes, which were dried with and without the application of MF of 0.3 T. From the XRD results, it can be observed that this modification of the preparation process with MF did not alter the fundamental structural characteristics of the cathode materials. The SEM observations revealed consistent morphology of the electrodes, and reduced electrode thickness for the samples prepared ‘with MF’, which potentially enhanced the porosity of the electrodes for improved Li-ion diffusion and battery performance. The CV experiments confirmed that the MF-treated electrodes displayed lower polarization and higher currents of electrochemical reactions, indicating improved electrode kinetics and lithium diffusion compared to non-MF-treated electrodes. Based on the obtained EIS spectra, LFP-MF, 1% FO/LFP-MF, and 3% FO/LFP-MF show a lower charge transfer resistance than that of the counter electrodes, which were not affected by MF during drying. According to the results obtained from the electrochemical tests, the electrodes placed under the MF upon drying showed improved electrochemical characteristics and suppressed polarization, thus contributing to a superior electrochemical performance of battery. However, there was no obvious difference between the discharge capacities of LFP subjected to MF and WMF electrodes at a cycling rate less than 1C. In contrast, the batteries with the electrode containing 1% FO exhibited the highest average capacity at a rate of 5C, which implies that 1% FO additive functions better under these conditions.The advantageous effect of MF during electrode preparation significantly enhanced the electrochemical performance of the cathodes. Employing MF to enhance the Li-ion diffusion and electrochemical kinetics of the reactions in LiFePO4 leads to increased discharge capacities and enhanced stability even at high cycling rates. The findings of this study demonstrate that MF-treated cathodes exhibit enhanced electrochemical performance compared to those prepared without MF, resulting in reduced polarization, enhanced Li-ion diffusion, and improved capacity retention. This research highlights a relatively facile method to improve the rate capability of the commercial LiFePO4 cathodes that can be incorporated into the large-scale battery production.
Data availability
The data supporting this article have been included as part of the ESI.†Author contributions
Emmanuel Iheonu Nduka: investigations, methodology, data collection, writing – original draft. Mukagali Yegamkulov: investigation, data collection. Nazgul Assan: investigations, methodology, data collection, validation, writing – review and editing. Aliya Mukanova: conceptualization, validation, writing – review and editing. Zhumabay Bakenov: supervision, funding acquisition, conceptualization, validation, resources, writing – review & editing.Conflicts of interest
The authors state that they have no known competing financial interests or personal relationships that could have impacted the research provided in this paper.Acknowledgements
The authors acknowledge the financial support of the Program Targeted Funding BR21882402 “Development of new material technologies and energy storage systems for a green economy” from the Ministry of Science and Higher Education of the Republic of Kazakhstan and the Research Grant 0122022FD4136 “Combined effect of magnetic field and ultrasound waves on fast-charging lithium-ion batteries” from Nazarbayev University.References
- D. Gao, J. Yang, D. Zhang and C. Chang, An effective strategy to enhance the electrochemical performance of LiNi0.6Mn0.2Co0.2O2: optimizing a Li diffusion pathway via magnetic alignment of single-crystal cathode material under an ordinary 0.4-T magnetic field, Ceram. Int., 2022, 48(21), 31598–31605 CrossRef CAS.
- K. Shen, X. Xu and Y. Tang, Recent progress of magnetic field application in lithium-based batteries, Nano Energy, 2022, 92, 106703 CrossRef CAS.
- Z. Chen, Q. Zhang and Q. Liang, Carbon-Coatings Improve Performance of Li-Ion Battery, Nanomaterials, 2022, 12, 1936 CrossRef CAS PubMed.
- J. Zhou, D. Zhang, G. Sun and C. Chang, B-axis oriented alignment of LiFePO4 monocrystalline platelets by magnetic orientation for a high-performance lithium-ion battery, Solid State Ionics, 2019, 338, 96–102 CrossRef CAS.
- C. Kim, Y. Yang, D. Ha, D. H. Kim and H. Kim, Crystal alignment of a LiFePO4 cathode material for lithium ion batteries using its magnetic properties, RSC Adv., 2019, 9(55), 31936–31942 RSC.
- N. Bai, H. Chen, W. Zhou, K. Xiang, Y. Zhang and C. Li, et al., Preparation and electrochemical performance of LiFePO4/C microspheres by a facile and novel co-precipitation, Electrochim. Acta, 2015, 167, 172–178 CrossRef CAS.
- D. Li, X. Liu and H. Zhou, The Size-Dependent Phase Transition of LiFePO4 Particles during Charging and Discharging in Lithium-Ion Batteries, Energy Technol., 2014, 2(6), 542–547 CrossRef CAS.
- Y. Gao, K. Chen, H. Chen, X. Hu, Z. Deng and Z. Wei, Surfactant assisted solvothermal synthesis of LiFePO4 nanorods for lithium-ion batteries, J. Energy Chem., 2017, 26(3), 564–568 CrossRef.
- N. Bai, K. Xiang, W. Zhou, H. Lu, X. Zhao and H. Chen, LiFePO4/carbon nanowires with 3D nano-network structure as potential high performance cathode for lithium ion batteries, Electrochim. Acta, 2016, 191, 23–28 CrossRef CAS.
- Y. Hu, G. Wang, C. Liu, S. L. Chou, M. Zhu and H. Jin, et al., LiFePO4/C nanocomposite synthesized by a novel carbothermal reduction method and its electrochemical performance, Ceram. Int., 2016, 42(9), 11422–11428 CrossRef CAS.
- Q. f. Zhao, Y. h. Yu, Q. s. Ouyang, M. y. Hu, C. Wang and J. h. Ge, et al., Surface Modification of LiFePO4 by Coatings for Improving of Lithium-ion Battery Properties, Int. J. Electrochem. Sci., 2022, 17, 221142 CrossRef CAS.
- G. Yang, K. Pan, F. Lai, Z. Wang, Y. Chu and S. Yang, et al., Integrated co-modification of PO43− polyanion doping and Li2TiO3 coating for Ni-rich layered LiNi0.6Co0.2Mn0.2O2 cathode material of lithium-ion batteries, Chem. Eng. J., 2021, 421, 129964 CrossRef CAS.
- Y. Zou, G. Chang, S. Chen, T. Liu, Y. Xia and C. Chen, et al., Alginate/r-GO assisted synthesis of ultrathin LiFePO4 nanosheets with oriented (0 1 0) facet and ultralow antisite defect, Chem. Eng. J., 2018, 351, 340–347 CrossRef CAS.
- W. W. Yang, J. G. Liu, X. Zhang, L. Chen, Y. Zhou and Z. G. Zou, Ultrathin LiFePO4 nanosheets self-assembled with reduced graphene oxide applied in high rate lithium ion batteries for energy storage, Appl. Energy, 2017, 195, 1079–1085 CrossRef CAS.
- N. A. Chernova, G. M. Nolis, F. O. Omenya, H. Zhou, Z. Li and M. S. Whittingham, What can we learn about battery materials from their magnetic properties?, J. Mater. Chem., 2011, 21(27), 9865–9875 RSC.
- Y. Sun, S. Zhang, W. Yuan, Y. Tang, J. Li and K. Tang, Applicability study of the potting material based thermal management strategy for permanent magnet synchronous motors, Appl. Therm. Eng., 2019, 149, 1370–1378 CrossRef CAS.
- W. C. Chien, K. N. Liu, S. C. Chang and C. C. Yang, Effects of α-Fe2O3 size and morphology on performance of LiFePO4/C cathodes for Li-ion batteries, Thin Solid Films, 2018, 660, 931–937 CrossRef CAS.
- S. Wu, Y. Jin, D. Wang, Z. Xu, L. Li and X. Zou, et al., Fe2O3/carbon derived from peanut shell hybrid as an advanced anode for high performance lithium ion batteries, J. Energy Storage, 2023, 68, 107731 CrossRef.
- J. Guo, M. Lan, S. Wang, Y. He, S. Zhang and G. Xiang, et al., Enhanced saturation magnetization in buckypaper-films of thin walled carbon nanostructures filled with Fe3C, FeCo, FeNi, CoNi, Co and Ni crystals: the key role of Cl, Phys. Chem. Chem. Phys., 2015, 17(27), 18159–18166 RSC.
- Y. Wang, H. Li, M. Chen, X. Yang and D. Jiang, Synthesis and electrochemical performance of LiFePO4/C cathode materials from Fe2O3 for high-power lithium-ion batteries, Ionics, 2017, 23(2), 377–384 CrossRef CAS.
- H. M. Cheng, F. M. Wang and J. P. Chu, Effect of Lorentz force on the electrochemical performance of lithium-ion batteries, Electrochem. Commun., 2017, 76, 63–66 CrossRef CAS.
- L. Yang, J. Chen, L. Chen, P. Yang, J. Zhang and A. Li, et al., LiFePO4 nanoplates with {010} exposed active planes prepared by hydrothermal method, J. Mater. Sci.: Mater. Electron., 2016, 27(11), 12258–12263 CrossRef CAS.
- J. M. Tarascon and M. Armand, Issues and challenges facing rechargeable lithium batteries, Nature, 2001, 414, 359–367 CrossRef CAS PubMed.
- Y. Hu, D. Gu, H. Jiang, L. Wang, H. Sun and J. Wang, et al., Electrochemical Performance of LiFePO/C via Coaxial and Uniaxial Electrospinning Method, Adv. Chem. Eng. Sci., 2016, 6(2), 149–157 CrossRef CAS.
Footnotes |
| † Electronic supplementary information (ESI) available. See DOI: https://doi.org/10.1039/d4ra06707j |
| ‡ These authors contributed equally. |
| This journal is © The Royal Society of Chemistry 2024 |

