 Open Access Article
Single and combined treatment processes for rhodamine B removal by coagulation–flocculation and adsorption
Meriem Chebbi a,
Soufiane Youcef
 a,
Leila Youcef
 *a,
Amina Soudani
 b,
Chafika Dridic,
Amane Sahli
 d,
Aya Houchete and
Chaima Derouese
aCivil Engineering and Hydraulic Department, LARHYSS Laboratory, Mohamed Khider University Biskra, Algeria. E-mail: l.youcef@univ-biskra.dz
bIndustrial Chemistry Department, LARHYSS Laboratory, Mohamed Khider University Biskra, Algeria
cLARHYSS Laboratory, Mohamed Khider University Biskra, Algeria
dCRND, Draria, Algiers. EESD Laboratory, National Polytechnic School, Algiers, Algeria
eCivil Engineering and Hydraulic Department, Mohamed Khider University Biskra, Algeria
First published on 26th November 2024
Abstract
In this paper, two physico-chemical methods were adopted for the removal of rhodamine B from aqueous solutions. The first one is the adsorption process using biochar derived from olive stones (OSB). Results demonstrated that the removal efficiency reached 97.79% within an equilibrium time of one hour. It was observed that the pH had no significant effect on the degradation of rhodamine B by OSB. The adsorption process was characterized by the endothermic nature, spontaneity, favorability, and disorder at the solid–liquid interface. Langmuir isotherm analysis revealed a maximum adsorption capacity of 11.82 mg g−1, and the prepared biochar could be reused for up to four cycles. For the second method, coagulation–flocculation using FeCl3 as a coagulant was investigated. The findings displayed that an increase in the dosage of FeCl3 enhanced the degradation process, with the best performance registered at a dose of 2000 mg L−1 of FeCl3. The optimum pH for this process was found to be 2. A combination approach by these two methods, starting with coagulation–flocculation and followed by adsorption, was also investigated. The results showed that the combined approach improved the removal performance compared to each process alone, with minimal doses of both coagulant and adsorbent. Thus, the combination of these two physico-chemical processes allows benefits from the advantages and reduces the disadvantages of each individual method.
1. Introduction
Synthetic dyes are frequently used in industries, which are producing large quantities of wastewater.1,2 These dyes are characterized by an intricate composition and large molecular size, tenacious and resistant characteristics, and poisonous, oncogenic, and gene-altering properties.3,4 Thus, the discharged effluents contain these types of pollutants that have the potential to cause substantial ecological damage by increasing wastewater turbidity, obstructing sunlight penetration at deeper levels, altering the photosynthetic activity of aquatic environments, and deteriorating the water quality, consequently leading to ecosystem imbalances.5 The presence of dyes in different water samples have been studied by different research works (ref. 6). The study presented by (ref. 7) demonstrated the presence of nine selected dyes including disperse dyes with concentration ranging from 0.01 to 6.81 μg L−1 in the upstream and downstream discharges of Piracicaba River and the effluent of a wastewater treatment plant (WWTP) in Americana, Brazil. Another work of (ref. 8) pointed that the malachite green is present in the laundry effluent, paper effluent, printing effluent and textile effluent with dose levels of 1320, 620, 790 and 1680 μg L−1. Among these dyes is rhodamine B, an organic dye used in tinted glass and dyeing industries,9 which can present a high toxicity to the ecosystem.10,11 The presence of rhodamine B in water bodies was determined by (ref. 12), revealing its wide presence in wastewater effluent (62 and 37 ng L−1) and surface water (4.8 ng L−1) in Taiwan. The report of (ref. 13) stated the contamination of Zalew Biskupice Brzozki dam in Poland with a concentration of 0.0594 μg L−1. The harmful effects of long-term rhodamine B accumulation in water include negative impacts on the metabolic and physiological processes of aquatic plants,11 the hindrance of aquatic photosynthesis by limiting sunlight exposure,14 which results in reduced dissolved oxygen levels, increased bacterial and viral growth, and a steady deterioration of water quality.9 Rhodamine B also poses significant hazards to human health, microbial diversity, and other organisms. It not only causes irritation to the eyes, skin, and respiratory tract but is also characterized by its high mutagenic, neurotoxic, and carcinogenic potential in humans.15 Thus, a key priority is to implement sustainable methods for treating these dyes before they enter the environment, thereby securing clean water for future generations.14 Biological,16,17 physico-chemical,18,19 and membrane processes20,21 have been applied for dye removal in water samples. However, some of these techniques have drawbacks, such as high costs, sludge generation, and the need for extensive maintenance.22 Additionally, the use of strong oxidizing agents can produce undesirable by-products.23,24 Furthermore, some dyes are resistant to chemical agents and require higher dosages, indicating that the excessive use of chemicals could cause secondary pollution.22,23The coagulation–flocculation approach is extensively implemented in wastewater treatment due to its well-documented methodology, operational simplicity, cost-effectiveness, and exceptional efficiency.18,24 Coagulants facilitate the aggregation of colloids and suspended particles and form larger flocs, which settle easily.25 Ferric chloride (FeCl3) is one of the coagulants that has revealed good removal efficiencies for dyes.26,27 Adsorption technology widely uses low-cost materials, such as those based on agricultural wastes for dye removal from wastewater, namely, biochar, which are carbon-rich materials obtained from the pyrolysis of biomass waste under limited oxygen conditions.28
Algeria boasts a longstanding tradition in olive cultivation. Data from the International Olive Council indicate that the country's olive oil production surged from 6000 tons in 1990 to 82![[thin space (1/6-em)]](https://www.rsc.org/images/entities/char_2009.gif) 500 tons in 2017.29 The significant production of oils is accompanied by substantial amounts of wastes as olive stones, which should be valorized. It has been demonstrated that olive stones have good adsorption properties for contaminants reported by (ref. 2 and 30). Olive biomass waste presents a viable option for adsorbing dyes, including rhodamine B, from wastewater.4,31 This finding was also supported by the ecological and economic feasibility of the adsorbents based on olive stones32 as well as the dyes' high adsorption and desorption removal capacities by such adsorbents.32–34
500 tons in 2017.29 The significant production of oils is accompanied by substantial amounts of wastes as olive stones, which should be valorized. It has been demonstrated that olive stones have good adsorption properties for contaminants reported by (ref. 2 and 30). Olive biomass waste presents a viable option for adsorbing dyes, including rhodamine B, from wastewater.4,31 This finding was also supported by the ecological and economic feasibility of the adsorbents based on olive stones32 as well as the dyes' high adsorption and desorption removal capacities by such adsorbents.32–34
Accordingly, the aim of this research is to apply a combination of two physico-chemical processes, coagulation–flocculation (using FeCl3), which is a process currently used in water treatment systems, followed by adsorption (using olive stones biochar), which is an eco-friendly and effective process, as an efficient technique for rhodamine B removal from aqueous solutions. This approach is designed to ensure optimal performance and effectively uses the advantages of each process while minimizing the requirement of coagulant and adsorbent dosages.
In this context and before applying a combination technique, a study of both single adsorption treatment and single coagulation–flocculation treatment of rhodamine B removal was done and is described herein. For each process, the effects of reaction parameters were thoroughly examined. Additionally, the study identified the optimal conditions and the mechanism by which olive stones biochar (OSB) and FeCl3 remove rhodamine B during the adsorption and coagulation–flocculation treatment, respectively. Finally, the study analyzed the combined coagulation–flocculation/adsorption process to provide the best performance under optimum conditions.
2. Materials and methods
2.1. Dye solutions and measuring techniques
A 100 mg L−1 stock solution of rhodamine B dye was prepared. The physico-chemical properties of rhodamine B are as follows: chemical formula: C28H31ClN2O3, class: cationic dye, molar mass (g mol−1): 479.02, solubility in water (20 °C) (g L−1): 50, λmax (nm): 554.A series of rhodamine B solutions with well-defined concentrations for standard solutions (0 to 12 mg L−1) and for adsorption and coagulation–flocculation tests was prepared in distilled water by dilution from the 100 mg L−1 stock solution. The absorbance of each solution sample was read on a UV spectrophotometer (Optizen 2120 UV) at a wavelength of 554 nm, and the corresponding rhodamine B contents (mg L−1) were determined according to Beer–Lambert's relation.
2.2. Preparation of coagulant solution
Iron chloride solution was prepared using FeCl3 (iron(III) chloride, reagent grade 97%). The substance identified is available as a black powder. Due to its rapid reactivity with air, FeCl3 was handled with extreme caution. Consequently, the FeCl3 coagulant was quickly removed from its container, which was immediately sealed to preserve its contents. The stock solution of iron chloride was prepared by dissolving 10 g of FeCl3 in 1 L of distilled water and saved for coagulation–flocculation tests.2.3. Biochar preparation
A sample of olive stones from Ghoufi town, Batna, Algeria was washed with tap water until the washing water became clear and then dipped in distilled water, followed by air-drying. After crushing, the pits were oven-dried for 24 hours at 105–110 °C and sieved to retain particles between 1 and 2 mm in size. The mixture was carbonized under limiting oxygen condition for 2 hours at 700 °C, then soaked in 0.1 N HCl to remove the resulting mineral matters from pyrolysis and washing with distilled water until the pH of the washing water was in the range of 6 to 7. The produced biochar was dried at 105–110 °C for 24 hours. Therefore, olive stones biochar (OSB) was ready for adsorption tests.2.4. Adsorbent feature analysis
A PerkinElmer Spectrum Two instrument was used to identify the chemical groups in the prepared adsorbent (OSB) using Fourier transform infrared (FTIR) spectroscopy. A Tescan Vega3 instrument was employed for scanning electron microscopy (SEM) imaging and energy dispersive X-ray (EDX) spectroscopy. The analysis of adsorption/desorption isotherms of nitrogen gas (N2) provided the textural properties of the prepared biochar OSB using ASAP 2010 V5.00E. For the determination of the point of zero charge (pHpzc), which refers to the pH at which the net charge on the surface of an adsorbent material is zero, the procedure outlined by (ref. 35) was followed. In short description, a set of NaCl (0.1 M) solutions with initial pH values ranging from 2 to 12 was prepared, after which the adsorbent with a concentration of 4 g L−1 was added in the NaCl solutions. The final pH of each solution was determined after 12 hours of stirring. The pHpzc is determined by plotting the pH of the final solution against the initial pH. The point when initial and final pH are equal is the pHPZC of OSB.2.5. Description of dye removal tests
Rhodamine B removal was tested by one step of treatment, adsorption treatment and coagulation–flocculation treatment, and by coupling of the two processes, namely, coagulation–flocculation, followed by an adsorption step.The adsorption tests were performed by magnetic mixing, after introducing a pre-measured quantity of biochar to rhodamine B solutions (volume of 50 mL). The samples taken after adsorption tests were vacuum-filtered through a 0.45 μm pore size membrane. Several factors that impact the process were investigated.
• Adsorption kinetics: the kinetics study was monitored from 2 minutes to 6 hours for 10 mg L−1 initial rhodamine B and 4 g L−1 of the prepared biochar at 20 °C of temperature.
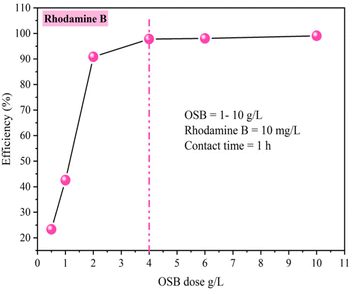
• Impact of adsorbent dosage: to ascertain the optimal amount of OSB, a range of OSB dose (1–10 g L−1) was added to 10 mg L−1 of rhodamine B solution at 20 °C temperature.
• The impact of the initial pH: the range of pH studied was from 2 to 12, and in order to set the initial pH of the solutions to the designated value, 0.1 M HCl and 0.1 M NaOH solutions were used. The concentration of biochar adopted is 4 g L−1 and that of rhodamine B is 10 mg L−1.
• The influence of the initial pollutant content: the study on the adsorption isotherms of biochar was investigated using different concentrations of rhodamine B solutions from 1 mg L−1 to 100 mg L−1 at 20 °C temperature in a period corresponding to the equilibrium time, established from the kinetics testing.
• The effect of adsorbent dose: in this test, rhodamine B concentrations were fixed at 10 mg L−1 and the adsorbent content (OSB) was altered from 1 to 10 g L−1 at 20 °C.
• The impact of solution temperature: the study of temperature impact on the adsorption process was implemented for a series of rhodamine B solutions with concentrations from 1 to 100 mg L−1 at temperatures of 20, 30, 40 and 50 °C with a fixed adsorbent content of 4 g L−1.
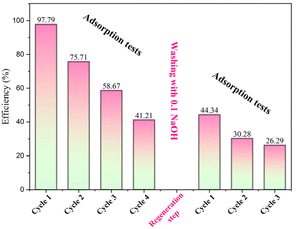
• Reuse and regeneration: the reuse step involves using the recovered adsorbent from the first adsorption test (cycle 1) for the subsequent adsorption test (cycle 2) with the same concentrations of rhodamine B (10 mg L−1) and OSB adsorbent (4 g L−1). The regeneration step involves rinsing the adsorbent using NaOH solution (0.1 M) and successive washing with distilled water up to the moment where the filtrate is neutralized.
The coagulation–flocculation tests were done using a flocculator, adding a set amount of FeCl3 to 300 mL of pre-set rhodamine B solution concentrations. The samples were mixed with high-speed stirring for 3 min and then at slow speed of stirring for 17 min, and then the time was completed in one hour for the sedimentation stage and filtered using a 0.45 μm pore membrane under vacuum. The initial content of rhodamine B and FeCl3 were tested.
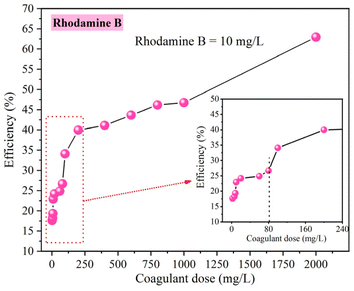
• The effect of coagulant dose: the JAR TEST were carried out for coagulant concentration range from 10 mg L−1 to 2000 mg L−1 with a fixed rhodamine B concentration of 10 mg L−1.
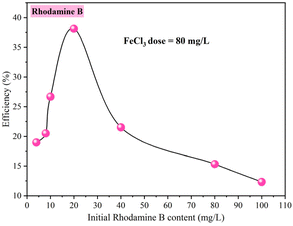
• Influence of rhodamine B concentration: The range of rhodamine B concentration studied was from 1 mg L−1 to 100 mg L−1, with a fixed coagulant dose of 80 mg L−1.
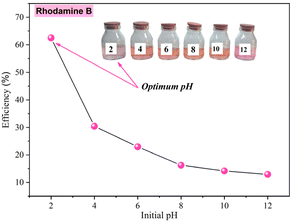
• The effect of pH: the pH was studied in the range from 2 to 12 under the same operational condition of coagulant dose (80 mg L−1) and 10 mg L−1 of rhodamine B concentration.
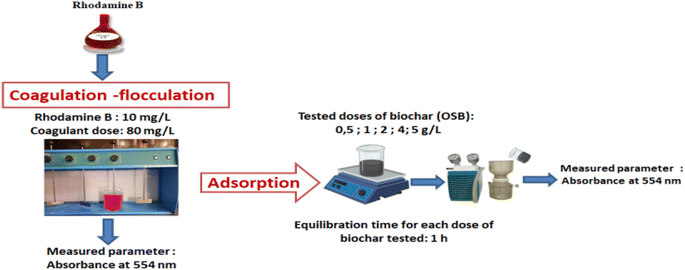
The treatment test for the combination of two processes was started by the coagulation–flocculation step using 80 mg L−1, followed by the adsorption step. The amount of the adsorbent was varied within the range from 0.5 g L−1 to 5 g L−1 (Fig. 1).
The adsorption capacities of rhodamine B on OSB (qt (mg g−1)) at time t, equilibrium (qe (mg g−1)), and the efficiencies of dye removal (%) were assessed according to eqn (1)–(3).
 | (1) |
 | (2) |
 | (3) |
2.6. Statistic tests
Chi-square (χ2) and R-square (R2) are both statistical measures used to assess the fit between the predicted data obtained by fitting the adsorption models qe,cal and experimental data obtained by experience qe,exp, the (R2) statistic coefficient (eqn (4)) should converge towards 1, and the (χ2) test statistic (eqn (5)) should be close to zero.36,37
 | (4) |
 | (5) |
3. Results and discussion
3.1. Adsorbent feature analysis
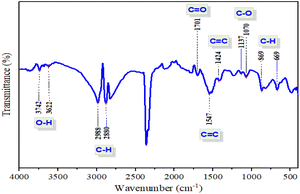
The examination of the ATR-FTIR spectrum of the prepared biochar (Fig. 2) reveals that OSB possesses a variety of chemical groups, which may contribute to bond formation with that of rhodamine B present in the solution. The main groups that may participate in hydrogen bond formation are OH and NH, which are present in the biochar prepared in this work, confirmed by the presence of 3742, 3622 cm−1 (ref. 38) and 1547 cm−1 (ref. 39) peaks, respectively. According to (ref. 40), the vibration at wavenumbers of 1547 cm−1 can also indicate the C–C ring elongation of aromatics. The broad band located at the wavenumber of 1701 cm−1 may be attributed to C![[double bond, length as m-dash]](https://www.rsc.org/images/entities/char_e001.gif) C bonds.41 The C–H stretching vibration of the symmetric or asymmetric of aliphatic acid was verified by the peaks presented at 2880 and 2988 cm−1.42,43 The peaks centered at 1424 cm−1 characterized the C
C bonds.41 The C–H stretching vibration of the symmetric or asymmetric of aliphatic acid was verified by the peaks presented at 2880 and 2988 cm−1.42,43 The peaks centered at 1424 cm−1 characterized the C![[double bond, length as m-dash]](https://www.rsc.org/images/entities/char_e001.gif) O stretching vibration or the N–H in-plane bending.39 The set wavenumbers in the range of 1000–1200 cm−1 (the peaks verified are 1070 and 1137 cm−1) corresponding to the vibration of C–O bonds (ref. 44) indicated that the vibration of the C–H moiety in the pyridine ring and that of the out-of-plane deformation are obtained at wavenumbers of 669 and 869 cm−1.
O stretching vibration or the N–H in-plane bending.39 The set wavenumbers in the range of 1000–1200 cm−1 (the peaks verified are 1070 and 1137 cm−1) corresponding to the vibration of C–O bonds (ref. 44) indicated that the vibration of the C–H moiety in the pyridine ring and that of the out-of-plane deformation are obtained at wavenumbers of 669 and 869 cm−1.
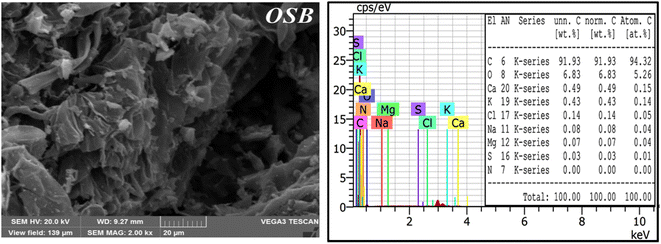
Fig. 3 exhibits the SEM images of the synthesized biochar. The image shows the porous structure of OSB, which is irregular in size and shape, indicating relatively high surface areas. On the other hand, EDX analysis of the biochar clearly indicated that the elementary composition contains atomic percentages of 94.32% and 5.26% for carbon and oxygen, respectively.
BET analysis revealed that OSB has a highly developed pore structure and SBET (specific surface area) of 475.05 m2 g−1 with an average pore diameter of 15.74 Å (1.57 nm).
3.2. Single adsorption treatment results
| qt = qe(1 − e−K1t) | (6) |
 | (7) |
| qt = Kintt1/2 + C | (8) |
The corresponding parameters are K1, K2, C and Kint; PFO speed constant in (min−1), PSO speed constant in (g min−1 mg−1), boundary layer depth constant (mg g−1) and Weber–Morris rating constant in (mg g−1 min−1/2).
The evolution of adsorption capacity of OSB had a positive correlation with the progression of contact duration prior to achieving the equilibrium (Fig. 4a). Optimal removal conditions were determined to have an equilibrium time of 1 hour, a removal efficiency of 97.79%, and a capacity of adsorption of 2.445 mg g−1, as shown in Fig. 4a.
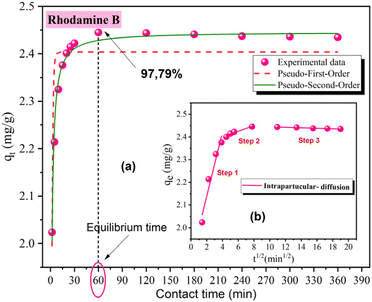 | ||
| Fig. 4 Experimental data for rhodamine B adsorption on OSB (a) non-linear fit of PFO, PSO models. (b) Intra-particle diffusion model ([rhodamine B] = 10 mg L−1; OSB = 4 g L−1; T = 20 °C). | ||
To elucidate the adsorption mechanism of rhodamine B on OSB, data obtained from the experiment were well fitted by three models of adsorption kinetics: PFO, PSO and intra-particle diffusion kinetic model. As shown in Fig. 4a and Table 1, the adjustment results of the non-linear models for PFO and PSO are very satisfactory. This is evidenced by the values of the statistic coefficient (R2), which is close to 1, and the chi-square (χ2), which is close to 0.
To select the most suitable fitting model, comparison between the estimated adsorption capacity through model fitting to the experimental points (qe,cal) with the maximum adsorption capacity obtained experimentally (qe,exp) was done, which corresponds to the equilibrium time for rhodamine B adsorption (1 h). According to the results obtained and presented in Table 1, It seems then that the PSO kinetic model is more appropriate than the PFO model for modeling rhodamine B adsorption kinetics since qe2,cal is closer to that obtained experimentally (qe,exp). This implies that rhodamine B adsorption on OSB is largely chemical than a physical process.
As illustrated in Fig. 4b, the intra-particle diffusion plots show three lines, and it was also clear that the first line does not intersect the origin, implying that the adsorption behavior was not solely governed by the intra-particle diffusion mechanism but also by multiple mechanisms, which can take place during the adsorption of the pollutant onto the adsorbent.48,49 The values obtained for the intra-particle diffusion rate (Table 1) could be ranked in the prescribed arrangement: Kint,1 > Kint,2 > Kint,3 (Table 1). This result leads to the inference that the transfer of rhodamine B molecules from the solution to OSB external surfaces occurs rapidly at the first time of adsorption. The lower slopes in the last linear parts suggest that the intra-particle diffusion rates of the pollutant decline as equilibrium is progressively achieved. The contact between the surface internal and the rhodamine B molecules were translated by the internal diffusion or what is called the pore filling mechanism, which depends on the scale of the adsorbate and that of the adsorbent pore.50 Therefore, OSB is a highly porous material (average pore diameter of 1.57 nm) with key factors of surface area (475.05 m2 g−1), which can enhance the adsorption capacity. As stated by (ref. 51), the molecular structure of rhodamine B and its dimer formation viewed from different directions present dimensions such as 0.5 width and 1.22 height. These dimensions allow them to pass easily into the pores of the OSB.
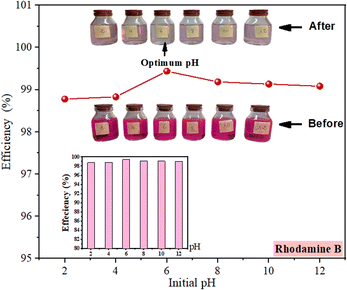 | ||
| Fig. 6 Rhodamine B removal efficiencies as a function of initial pH of treated solutions ([rhodamine B]0 = 10 mg L−1; pH = 2 to 12; OSB = 4 g L−1; contact time = 1 h; T = 20 °C). | ||
When plotted on a small scale, the graph indicates a tendency that firstly increases and then decreases (Fig. 6). On the other hand, at reduced pH levels, the abundant H+ ions encourage the protonation of the functional groups in the surface of adsorbent, resulting in a more positively-charged surface and consequently repelling positively-charged dye molecules.2 Specifically, rhodamine B dye is a xanthene dye existing in cationic form as rhodamine BH+ in the pH range from 1.0 to 3.0 and zwitterion rhodamine B ± at pH > 4.0.51,53 When the positive charges are located on the ![[double bond, length as m-dash]](https://www.rsc.org/images/entities/char_e001.gif) N+ groups and the negative ones on the COO− group in the molecule of this dye.54 According to ref. 2, the H+ ions also compete with rhodamine B molecules, which exist in monomeric and cationic forms,55 for occupying the adsorption sites. Conversely, as the pH of the solution increases (pH > pHpzc (5.52)), the charge at the adsorbent's surface becomes negative, resulting from the adsorption of OH groups and chemical functionalities deprotonation, thus enhancing the adsorption through electrostatic attraction. The slight decline in the efficiency of removal at higher pH values (pH > 8) is attributed to the formation of hydrated rhodamine B ions, which form larger molecular structures (dimers) that obstruct the dye's entry into the material's pores.2,55 However, the overall removal efficiency fluctuates within a 1% range, remaining within the acceptable error bar tolerance. Thus, while the electrostatic effect is present, it does not have a strong influence on the adsorption process. This outcome is in accordance with the findings of (ref. 56).
N+ groups and the negative ones on the COO− group in the molecule of this dye.54 According to ref. 2, the H+ ions also compete with rhodamine B molecules, which exist in monomeric and cationic forms,55 for occupying the adsorption sites. Conversely, as the pH of the solution increases (pH > pHpzc (5.52)), the charge at the adsorbent's surface becomes negative, resulting from the adsorption of OH groups and chemical functionalities deprotonation, thus enhancing the adsorption through electrostatic attraction. The slight decline in the efficiency of removal at higher pH values (pH > 8) is attributed to the formation of hydrated rhodamine B ions, which form larger molecular structures (dimers) that obstruct the dye's entry into the material's pores.2,55 However, the overall removal efficiency fluctuates within a 1% range, remaining within the acceptable error bar tolerance. Thus, while the electrostatic effect is present, it does not have a strong influence on the adsorption process. This outcome is in accordance with the findings of (ref. 56).
The electrostatic interactions, hydrophobic interactions, pore-filling, hydrogen bonding, π–π and n–π interactions are the main interaction that can occur between organic pollutants and biochar.50 For rhodamine B, the electrostatic forces do not have a strong effect on the process. According to (ref. 57), the hydrogen bonding and π–π interaction are the primary mechanism applicable in rhodamine B adsorption onto biochar. The hydrogen bonds occur between the OH, COOH, and NH groups in the prepared biochar (OSB) as H donor and the oxygen, nitrogen atoms rhodamine B as H acceptor.50,58 Additionally, rhodamine B has a carboxyl group (–COOH) as the H-donor, which can interact with oxygen, nitrogen-containing biochar as an H acceptor.57 π–π interactions are the interactions that occur between a π-electron donor and π-electron acceptor.59 The aromatic groups of dye can interact with the aromatic ring of biochar via π–π stacking.58 On the other hand, the π–π interaction can occur between the oxygen-containing OH groups of the prepared biochar and the benzene ring in the dye.58 The n–π interactions are another type of electron donor–acceptor interaction that can occur between the oxygen in the carbonyl groups (electron donors) of the OSB prepared in this work (FTIR spectroscopy results) and the aromatic rings (electron acceptors) of rhodamine B.60 The pore-filling mechanism can be controlled by the diffusion of rhodamine B molecule on the surface and inside the biochar pores. The hydrophobic interactions can be applied between the hydrophobic groups of biochar and the hydrophobic groups of rhodamine B.59
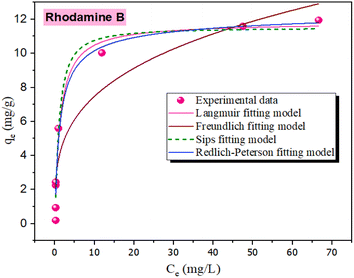 | ||
| Fig. 7 Modeling of experimental data at equilibrium (OSB = 4 g L−1, T = 20 °C; rhodamine B = 1–100 mg L−1. | ||
To get more information about the adsorption process and to determine the maximum adsorption capacity of rhodamine on OSB, the adjustment of experimental data at equilibrium is recommended. Thus, Langmuir61 (eqn (9)), Freundlich62 (eqn (10)), Redlich Peterson63 (eqn (11)), and Sips64 (eqn (12)) isothermal models were applied in this research paper.
 | (9) |
 | (10) |
 | (11) |
 | (12) |
The related parameters of these models are: Langmuir adsorption capacity (Qmax (mg g−1)), the Langmuir constant (KL (L mg−1)), Freundlich constants (KF (mg g−1)/(mg L−1)1/n, and n (dimensionless)), Redlich–Peterson constants (KRP (L g−1) and aRP (mg L−1)−β), where β must be between 0 and 1, Sips adsorption capacity (qs (mg g−1)), Sips constant (Ks (L mg−1)), and the adsorbent's heterogeneity (ns).
Based on the findings outlined in Table 2, the Langmuir model, with a high determination coefficient (R2 = 0.972) and lower error value (χ2 = 0.784), showed the greatest consistency with the experimental data compared to the other fitted models. This suggests that rhodamine B was adsorbed on the homogeneous adsorbent surface-forming monolayers,58 with a Qmax (maximum adsorption capacity of Langmuir) of 11.82 mg g−1. For comparison, this capacity is higher than that obtained when using the activated raw materials such as treated banana peel (9.52 mg g−1),65 cinnamon wood biochar (2.01 mg g−1)66 and comparable with a capacity obtained with a coconut shell-derived biochar with Fe–N co-modification of 12.41 mg g−1.67
The dimensionless parameter RL is used to determine whether adsorption is favorable or not,68 and the equation for calculating RL is as follows (eqn (13))
 | (13) |
Adsorption is favorable when RL lies between 0 and 1, is unfavorable if RL exceeds 1, and is irreversible when RL is 0.69 For the adsorption of rhodamine B on OSB, the RL: 0 < RL (0.013 to 0.562) < 1; as a result, the adsorption process is favorable. This hypothesis is also confirmed by the fitting results of Freundlich isotherm (Table 2), which indicate a value of 1/n less than 1 (0.288 < 1), reflecting a favorable adsorption of the tested dye on OSB.
| ΔG° = ΔH° − TΔS° | (14) |
ΔG° = −RT![[thin space (1/6-em)]](https://www.rsc.org/images/entities/char_2009.gif) ln(Kc) ln(Kc)
| (15) |
By replacing eqn (14) in eqn (15), the equation obtained is named the Van't Hoff relation (eqn (16)).
 | (16) |
The KC equilibrium constant is dimensionless, calculated as a function of KL (L mg−1) (the Langmuir isotherm constant for each temperature); this constant was calculated using eqn (17), as noted by (ref. 71).
| KC = KL × Madsorbate × 55.5 × 10³ | (17) |
Fig. 8a shows the results of the determination of KL (L mg−1) from the adsorption curves of rhodamine B on OSB in the equilibrium state at 20, 30, 40 and 50 °C, while Fig. 8b shows the representation of the Van't Hoff straight-line plot.
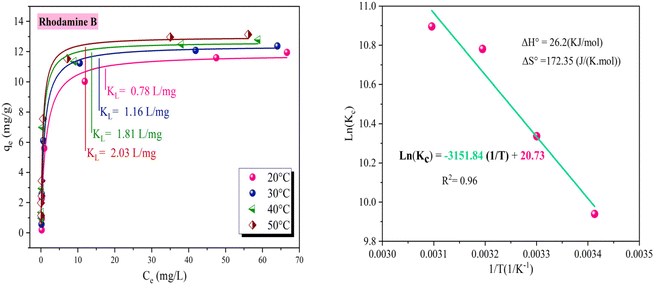 | ||
| Fig. 8 Adsorption behavior of rhodamine B on OSB across different temperatures ([OSAC] = 1 g L−1, [rhodamine B]0 = 10–400 mg L−1, T = 20–50 °C, contact time = 1 h). | ||
The ΔG° value is varied from −29.26 to −24.21 kJ mol−1 (Table 3), and all Gibbs energy changes are negative, indicating the spontaneous and favorable nature of the adsorption process.
| T (K) | KL (L mg−1) | KC | Van't Hoff equation | ΔG° (kJ mol−1) | ΔH° (kJ mol−1) | ΔS° (J K−1 mol−1) |
|---|---|---|---|---|---|---|
| 298 | 0.78 | 20![[thin space (1/6-em)]](https://www.rsc.org/images/entities/char_2009.gif) 736.78 736.78 |
y = −3151.84x + 20.73 | −24.21 | 26.2 | 172.35 |
| 303 | 1.16 | 30![[thin space (1/6-em)]](https://www.rsc.org/images/entities/char_2009.gif) 839.31 839.31 |
−26.04 | |||
| 313 | 1.81 | 48![[thin space (1/6-em)]](https://www.rsc.org/images/entities/char_2009.gif) 119.95 119.95 |
−28.06 | |||
| 323 | 2.03 | 53![[thin space (1/6-em)]](https://www.rsc.org/images/entities/char_2009.gif) 968.79 968.79 |
−29.26 |
The ΔG° values varied from −29.26 to −24.21 kJ mol−1 (Table 3) and all Gibbs energy changes values were negative, indicating the spontaneous and favorable nature of the adsorption process.72,73 Considering the values of ΔH° (>0) in Table 3 and Fig. 8b, the adsorption of rhodamine B is endothermic,74 accompanied by heat absorption from the surroundings, contributing to an increase in the internal energy of the system. Additionally, the system exhibits a positive value of (ΔS°), which reflects the increased randomness and disorder at the adsorbent/adsorbate phase throughout the adsorption,72,73 implying that rhodamine B molecules are not structured in a specific manner upon adsorption.
3.3. Single coagulation–flocculation treatment
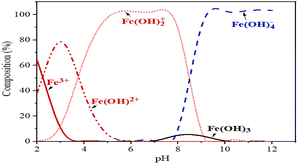
The initial pH significantly influences the removal of rhodamine B through coagulation–flocculation using ferric chloride (FeCl3). At lower pH levels, the efficiency of rhodamine B removal increases due to enhanced coagulation mechanisms. As mentioned above, rhodamine B dye is in the cationic form as rhodamine BH+ at pH 1.0–3.0 and in the zwitterionic form as rhodamine B ± at pH > 4.0. Using the concept at acidic pH, ferric ions hydrolyze to form ferric ions and positively-charged ferric hydroxides, mainly Fe3+, Fe(OH)2+, and Fe(OH)2+ (Fig. 12). The electrostatic attraction of rhodamine B molecules is less favorable at such a low pH. However, at low pH, the high removal efficiency of rhodamine B may be related to the potential influence of other forces, such as hydrogen bonding and hydrophobic interactions, to exert a greater influence than electrostatic interaction. Additionally, the process of sweep flocculation becomes more effective at lower pH levels as the precipitation of ferric hydroxides traps the dye particles within the flocs, thus improving the overall removal efficiency. Studies have shown that optimal removal occurs at an initial pH of about 3.5, where charge neutralization and sweep flocculation are most effective, leading to dye removal efficiencies as high as 96.53% (ref. 78). Further, (ref. 79) reported that the mechanisms driving this process include the adsorption of rhodamine B onto the ferric hydroxides and the subsequent formation of flocs, which are more stable and larger at lower pH, thus facilitating their removal from the solution.
3.4. Coagulation–flocculation followed by adsorption treatment results
In order to reduce the use of high doses of coagulant (FeCl3), high levels of residual iron should be avoided in the treated water when using the high dose of adsorbent, which will increase the removal efficiencies. A combination of the two processes was tested.The treatment test was begun by the coagulation–flocculation treatment while introducing a coagulant dose of 80 mg L−1. This dose was chosen as it is lower than the optimum dose obtained in previous tests (FeCl3 = 2000 mg L−1, R% = 62.95%). The removal efficiency when using 80 mg L−1 FeCl3 was 26.68% (Fig. 10 and 14). The sample taken after coagulation–flocculation was subjected to adsorption tests over 4 hours of contact time. The amount of OSB used was adjusted from 0.5 g L−1 to 5 g L−1. Fig. 14 shows that the rhodamine B removal efficiency increases with increasing OSB dose. These efficiencies are significantly higher than those obtained after each treatment alone (Fig. 14). It can also be concluded that this combination allows the use of a low dose of coagulant compared with that required (2000 mg L−1) to achieve an effective rhodamine B removal rate as well as a low dose of adsorbent (<2 g L−1) to achieve a removal efficiency of over 90%. Table 4 summarizes some research work on rhodamine B removal by adsorption and coagulation–flocculation. It seems that the combination of coagulation–flocculation, followed by adsorption, significantly enhances the removal efficiency while simultaneously reducing the required adsorbent dose, underscoring the synergistic interaction between the two processes for optimized dye removal.
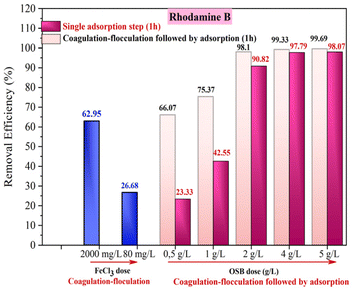 | ||
| Fig. 14 Comparison of rhodamine B removal efficiencies by coagulation–flocculation, adsorption and combined coagulation–flocculation followed by adsorption. | ||
| Coagulation–flocculation | ||||||
|---|---|---|---|---|---|---|
| Coagulant | Time | Coagulant dose (mg L−1) | pH | Rhodamine B concentration | Efficiency (%) | References |
| Bentonite sodium alginate bentonite + sodium alginate | 1 min flash mixing + 10 min slow mixing + 30 min sedimentation | 200 | 9 | 10 (g L−1) | 53.7 | 82 |
| 20 | 9 | 10 (g L−1) | 1.8 | 82 | ||
| 160 + 4 | 9 | 10 (g L−1) | 91.5 | 82 | ||
| FeCl3 | 3 min flash mixing + 17 min slow mixing + 40 min sedimentation | 2000 | 2 | 10 (mg L−1) | 62.95 | This study |
| Coagulation–flocculation followed by adsorption | ||||||
|---|---|---|---|---|---|---|
| Coagulant | Adsorbent | Coagulant dose (mg L−1) | Adsorbent dose (g L−1) | Rhodamine B concentration (mg L−1) | Efficiency (%) | References |
| FeCl3 | Olive stone biochar | 80 | 2 | 10 | 98.10 | This study |
4. Conclusion
From the results obtained and discussed, it seems clear that in the single adsorption treatment process, the kinetics study indicated that adsorption equilibrium was achieved within one hour, resulting in an efficiency of removal of about 97.79%. The PSO kinetic model well fitted the experimental data of 4 g L−1; thus, the adsorption is a chemical rather than a physical process. The Langmuir isotherm model well describes the results, which mean that rhodamine B molecules were adsorbed on the homogeneous adsorbent surface, forming monolayers. In the single coagulation–sedimentation treatment process, it seems that a high dose of FeCl3 was recommended for reaching a high removal efficiency of 2000 mg L−1 of FeCl3 for an efficiency of 62.95%. Combining the two conventional processes, coagulation–flocculation, followed by adsorption on OSB, proved to be an effective technique as it minimizes the disadvantages of each process when used individually. This satisfactory result is based on the fact that this combination allows for the use of a lower dose of coagulant and adsorbent than that required when each process is used alone. In addition, OSB is a highly effective and recyclable adsorbent for rhodamine B removal. Therefore, the combination of the two treatment processes is considered as a key solution for wastewater treatment, offering methods that can be easily implemented in various industrial settings.Data availability
The authors confirm that the data used to support the findings of this study are included within the article and are available from the corresponding author upon reasonable request.Author contributions
Meriem Chebbi: investigation, formal analysis, writing – original draft, Soufiane Youcef: writing – review & editing, Leila Youcef: supervision, conceptualization, writing – original draft, review & editing, Amina Soudani: writing – review & editing, Dridi Chafika: writing – review & editing, Amane Sahli: formal analysis, Aya Houchet: investigation, formal analysis, Chaima Deroues: investigation, formal analysis.Conflicts of interest
The authors state that they possess no pecuniary conflicts of interest or personal connections that might have influenced the research presented in this work.Acknowledgements
This work was performed at LARHYSS Laboratory, Biskra University, Algeria.References
- S. Chen, J. Zhang, C. Zhang, Q. Yue, Y. Li and C. Li, Desalination, 2010, 252, 149–156 CrossRef CAS.
- V. da Silva Lacerda, J. B. López-Sotelo, A. Correa-Guimarães, S. Hernández-Navarro, M. Sánchez-Báscones, L. M. Navas-Gracia, P. Martín-Ramos and J. Martín-Gil, J. Environ. Manage., 2015, 155, 67–76 CrossRef PubMed.
- P. C. L. Muraro, S. R. Mortari, B. S. Vizzotto, G. Chuy, C. Dos Santos, L. F. W. Brum and W. L. da Silva, Sci. Rep., 2020, 10, 3055 CrossRef CAS PubMed.
- I. I. Albanio, P. C. L. Muraro and W. L. da Silva, Water, Air, Soil Pollut., 2021, 232, 214 CrossRef CAS.
- S. Lalnunhlimi and V. Krishnaswamy, Braz. J. Microbiol., 2016, 47, 39–46 CrossRef CAS PubMed.
- A. Tkaczyk, K. Mitrowska and A. Posyniak, Sci. Total Environ., 2020, 717, 137222 CrossRef CAS PubMed.
- F. I. Vacchi, J. A. de Souza Vendemiatti, B. F. da Silva, M. V. B. Zanoni and G. de Aragão Umbuzeiro, Sci. Total Environ., 2017, 601, 230–236 CrossRef PubMed.
- M. R. Khan, S. M. Wabaidur, R. Busquets, M. A. Khan, M. R. Siddiqui and M. Azam, Process Saf. Environ. Prot., 2019, 126, 160–166 CrossRef CAS.
- R. Ma, D. Nie, M. Sang, W. Wang and G. Nie, Bioresour. Technol., 2023, 386, 129548 CrossRef CAS PubMed.
- P. S. Priya, P. P. Nandhini, S. Vaishnavi, V. Pavithra, M. H. Almutairi, B. O. Almutairi, S. Arokiyaraj, R. Pachaiappan and J. Arockiaraj, Comp. Biochem. Physiol. C, Comp. Pharmacol. Toxicol., 2024, 280, 109898 CAS.
- J. Sharma, S. Sharma, U. Bhatt and V. Soni, J. Hazard. Mater. Lett., 2022, 3, 100069 CrossRef CAS.
- T.-L. Chiang, Y.-C. Wang and W.-H. Ding, J. Chin. Chem. Soc., 2011, 59, 1–5 Search PubMed.
- A. Tkaczyk-Wlizło and K. Mitrowska, Chemosphere, 2023, 313, 137432 CrossRef PubMed.
- A. K. Behera, K. P. Shadangi and P. K. Sarangi, Chemosphere, 2024, 354, 141702 CrossRef CAS PubMed.
- M. A. A. H. Allah, H. K. Ibrahim, H. A. Alshamsi and H. R. Saud, J. Photochem. Photobiol., A, 2024, 449, 115413 CrossRef.
- B. B. Hameed and Z. Z. Ismail, Environ. Technol., 2021, 42, 2991–3010 CrossRef CAS PubMed.
- J. Fan, W. Li, B. Zhang, W. Shi and P. N. Lens, Bioresour. Technol., 2022, 357, 127347 CrossRef CAS PubMed.
- S. Goudjil, S. Guergazi, D. Ghernaout, D. Temim and T. Masmoudi, Desalin. Water Treat., 2024, 319, 100539 CrossRef.
- K. Hamida, H. Rehali, H. Menasra, F. Bekiri and A. Aidi, React. Kinet., Mech. Catal., 2024, 137, 1189–1207 CrossRef CAS.
- S. Saja, A. Bouazizi, B. Achiou, H. Ouaddari, A. Karim, M. Ouammou, A. Aaddane, J. Bennazha and S. A. Younssi, J. Eur. Ceram. Soc., 2020, 40, 2453–2462 CrossRef CAS.
- C. Yang, W. Xu, Y. Nan, Y. Wang, Y. Hu, C. Gao and X. Chen, J. Colloid Interface Sci., 2020, 562, 589–597 CrossRef CAS PubMed.
- M. J. Abbas, R. Mohamed, M. Al-Sahari, A. Al-Gheethi and A. M. Mat Daud, Songklanakarin J. Sci.Technol., 2021, 43, 1094–1102 CAS.
- G. A. Ismail and H. Sakai, Chemosphere, 2022, 291, 132906 CrossRef CAS PubMed.
- M. D. Khan, A. Singh, M. Z. Khan, S. Tabraiz and J. Sheikh, J. Water Process Eng., 2023, 53, 103579 CrossRef.
- A. H. Jagaba, A. H. Birniwa, A. K. Usman, N. D. Mu’azu, N. S. A. Yaro, U. B. Soja, K. J. Abioye, N. M. Y. Almahbashi, B. N. S. Al-dhawi and A. Noor, J. Cleaner Prod., 2023, 429, 139543 CrossRef CAS.
- H. Kristianto, L. Verren, S. Prasetyo and A. K. Sugih, AIP Conf. Proc., 2021, 2370, 040003 CrossRef CAS.
- S. Rudra Paul, N. H. Singh and A. Debnath, Int. J. Environ. Anal. Chem., 2022, 104, 2874–2894 CrossRef.
- Z.-W. Zeng, X. Fei Tan, Y.-G. Liu, S.-R. Tian, G.-M. Zeng, L.-H. Jiang, S.-B. Liu, J. Li, N. Liu and Z.-H. Yin, Front. Chem., 2018, 6, 1–11 CrossRef PubMed.
- B. Khezzani, H. Z. Messaoud, H. Ghezal and Y. Halis, Ann. Arid Zone, 2019, 58, 79–89 Search PubMed.
- S. Youcef, S. Guergazi and L. Youcef, Model. Earth Syst. Environ., 2022, 8, 3927–3940 CrossRef.
- S. Najar-Souissi, A. Ouederni and A. Ratel, Glob. J. Pure Appl. Sci., 2004, 10, 91–94 CAS.
- S. M. Alardhi, H. G. Salih, N. S. Ali, A. H. Khalbas, I. K. Salih, N. M. C. Saady, S. Zendehboudi, T. M. Albayati and H. N. Harharah, Sci. Rep., 2023, 13, 21063 CrossRef CAS PubMed.
- R. Hazzaa and M. Hussein, Environ. Technol. Innovation, 2015, 4, 36–51 CrossRef.
- M. A. Al-Ghouti and R. S. Al-Absi, Sci. Rep., 2020, 10, 15928 CrossRef CAS PubMed.
- A. Soudani, L. Youcef, L. Bulgariu, S. Youcef, K. Toumi and N. Soudani, Chem. Eng. Res. Des., 2022, 188, 972–987 CrossRef CAS.
- M. C. Ncibi, J. Hazard. Mater., 2008, 153, 207–212 CrossRef CAS PubMed.
- N. Ayawei, A. Newton Ebelegi and D. Wankasi, J. Chem., 2017, 2017, 11 Search PubMed.
- S. Wang, J.-H. Kwak, M. S. Islam, M. A. Naeth, M. G. El-Din and S. X. Chang, Sci. Total Environ., 2020, 712, 136538 CrossRef CAS PubMed.
- S. M. Alshuiael and M. A. Al-Ghouti, PLoS One, 2020, 15, e0232997 CrossRef CAS PubMed.
- O. J. Al-Sareji, R. A. Grmasha, M. Meiczinger, R. A. Al-Juboori, V. Somogyi, C. Stenger-Kovács and K. S. Hashim, Chemosphere, 2024, 351, 141189 CrossRef CAS PubMed.
- A. Iles, F. Zaoui, B. E. Daouadji, M. A. Zorgani, L. A. Siddig, A. S. Abdelhamid, S. Abubakar, B. Bounaceur, E. Choukchou-Braham and F. Lebsir, J. Water Process Eng., 2024, 66, 105960 CrossRef.
- Y. Wafaa, S. Akazdam, S. Zyade, M. Chafiq, Y. G. Ko, M. Chafi, M. Tahiri, A. A. Alrashdi and H. Lgaz, J. Saudi Chem. Soc., 2023, 27, 101692 CrossRef CAS.
- E. Magioglou, Z. Frontistis, J. Vakros, I. D. Manariotis and D. Mantzavinos, Catalysts, 2019, 9, 419 CrossRef.
- K. B. Cantrell, P. G. Hunt, M. Uchimiya, J. M. Novak and K. S. Ro, Bioresour. Technol., 2012, 107, 419–428 CrossRef CAS PubMed.
- S. K. Lagergren, Sven. Vetenskapsakad. Handingarl, 1898, 24, 1–39 Search PubMed.
- Y. S. Ho and G. McKay, Water Res., 2000, 34, 735–742 CrossRef CAS.
- W. J. J. Weber and J. C. Morris, J. Sanit. Eng. Div., 1963, 89, 31–59 CrossRef.
- L. Cruz-Lopes, M. Macena, B. Esteves and I. Santos-Vieira, Appl. Sci., 2022, 12, 933 CrossRef CAS.
- A. C. Martins, O. Pezoti, A. L. Cazetta, K. C. Bedin, D. A. Yamazaki, G. F. Bandoch, T. Asefa, J. V. Visentainer and V. C. Almeida, Chem. Eng. J., 2015, 260, 291–299 CrossRef CAS.
- B. Qiu, Q. Shao, J. Shi, C. Yang and H. Chu, Sep. Purif. Technol., 2022, 300, 121925 CrossRef CAS.
- W. Rao, P. Piliouras, X. Wang, A. Guido, K. Kugler, B. Sieren, L. Wang, G. Lv and Z. Li, Appl. Clay Sci., 2020, 197, 105790 CrossRef CAS.
- X. Zhang, T. Zhang, J. Guo, M. Ahmad, H. Yang, X. Su, F. Huang, Y. Jin, H. Xiao and J. Song, Arabian J. Chem., 2022, 15, 103904 CrossRef CAS.
- K. G. Bhattacharyya, S. SenGupta and G. K. Sarma, Appl. Clay Sci., 2014, 99, 7–17 CrossRef CAS.
- I. L. Arbeloa and P. R. Ojeda, Chem. Phys. Lett., 1982, 87, 556–560 CrossRef.
- S. Gul, H. Gul, M. Gul, R. Khattak, G. Rukh, M. S. Khan and H. A. Aouissi, Water, 2022, 14, 2987 CrossRef CAS.
- W. Xiao, Z. N. Garba, S. Sun, I. Lawan, L. Wang, M. Lin and Z. Yuan, J. Cleaner Prod., 2020, 253, 119989 CrossRef CAS.
- S. Guo, Z. Zou, Y. Chen, X. Long, M. Liu, X. Li, J. Tan and R. Chen, Environ. Pollut., 2023, 320, 121060 CrossRef CAS PubMed.
- E. A. Azim, M. Samy, M. Hanafy and H. Mahanna, J. Environ. Manage., 2024, 357, 120738 CrossRef PubMed.
- T. Ambaye, M. Vaccari, E. D. van Hullebusch, A. Amrane and S. Rtimi, Int. J. Environ. Sci. Technol., 2021, 18, 3273–3294 CrossRef CAS.
- M. Mercurio, S. J. Olusegun, K. Malińska, K. Wystalska, J. Sobik-Szołtysek, A. Dąbrowska, P. Krysiński and M. Osial, Desalin. Water Treat., 2023, 288, 72–86 CrossRef CAS.
- I. Langmuir, J. Am. Chem. Soc., 1918, 40, 1361–1403 CrossRef CAS.
- H. Freundlich, Z. fur Phys. Chem., 1907, 57, 385–470 CrossRef CAS.
- O. Redlich, D. L. Peterson and J. Physic, Chem, 1959, 63, 1024–1024 CAS.
- R. Sips, J. Chem. Phys., 1948, 16, 490–495 CrossRef CAS.
- A. A. Oyekanmi, A. Ahmad, K. Hossain and M. Rafatullah, PLoS One, 2019, 14, e0216878 CrossRef CAS PubMed.
- W. Abeyrathna, A. Cooray and J. Walpita, FESympo-Proceedings-2022, 2022, p. 97 Search PubMed.
- X. Li, J. Shi and X. Luo, Bioresour. Technol., 2022, 343, 126103 CrossRef CAS PubMed.
- H. N. Tran, S.-J. You, A. Hosseini-Bandegharaei and H.-P. Chao, Water Res., 2017, 120, 88–116 CrossRef CAS PubMed.
- A. Günay, B. Ersoy, S. Dikmen and A. Evcin, Adsorption, 2013, 19, 757–768 CrossRef.
- K. A. Adegoke, O. R. Adegoke, A. O. Araoye, J. Ogunmodede, O. S. Agboola and O. S. Bello, Bioresour. Technol. Rep., 2022, 18, 101082 CrossRef CAS.
- E. C. Lima, A. Hosseini-Bandegharaei, J. C. Moreno-Piraján and I. Anastopoulos, J. Mol. Liq., 2019, 273, 425–434 CrossRef CAS.
- R. Ghibate, O. Senhaji and R. Taouil, Case Stud. Chem. Environ. Eng., 2021, 3, 100078 CrossRef CAS.
- H. N. Tran, S.-J. You and H.-P. Chao, J. Environ. Chem. Eng., 2016, 4, 2671–2682 CrossRef CAS.
- L. Pompeu, D. Druzian, L. Oviedo, A. Viana, S. Mortari, G. Pavoski, D. Espinosa, B. Vizzotto, L. Fernandes and W. da Silva, Inorg. Chem. Commun., 2023, 158, 111509 CrossRef CAS.
- H. Patel and R. Vashi, J. Saudi Chem. Soc., 2012, 16, 131–136 CrossRef CAS.
- X. Liu, H. Yin, J. Zhao, Z. Guo, Z. Liu and Y. Sang, Water Sci. Technol., 2021, 83, 2377–2388 CrossRef CAS PubMed.
- Q. Wei, Y. Zhang, K. Zhang, J. I. Mwasiagi, X. Zhao, C. W. Chow and R. Tang, Korean J. Chem. Eng., 2022, 39, 1850–1862 CrossRef CAS.
- S. S. Moghaddam, M. A. Moghaddam and M. Arami, J. Hazard. Mater., 2010, 175, 651–657 CrossRef PubMed.
- R. Saini and P. Kumar, J. Environ. Chem. Eng., 2016, 4, 673–680 CrossRef CAS.
- B. Kayranli, M. Bilen, I. Y. Seckin, T. Yilmaz, A. Dinc, F. Akkurt and H. Simsek, Chemosphere, 2024, 364, 143056 CrossRef CAS PubMed.
- B. Isik, Biomass Convers. Biorefin., 2024, 1–12 CAS.
- F. O. Mcyotto, Q. Wei, C. W. Chow, Z. Nadeem, Z. Li and J. Liu, J. Earth Sci. Environ., 2020, 5, 51–60 Search PubMed.
| This journal is © The Royal Society of Chemistry 2024 |

