 Open Access Article
Effect of Bi(III)-to-metal ion concentration ratios on stripping voltammetric response of bismuth-film glassy carbon electrodes
Hongwei Guo ,
Bin Chen,
Yingmin Luo,
Ruiyang Wang,
Qichang Tian and
Yanping Chang*
School of Chemistry and Environment, Jiaying University, Meizhou, Guangdong 514015, China. E-mail: changyp09@163.com
First published on 12th December 2024
Abstract
The effect of Bi-to-metal ion concentration ratio (cBi/cM ratio) on key evaluation indicators, including sensitivity, precision, and cathodic potential range, has been investigated for the determination of Cd and Pb at in situ prepared bismuth film electrodes. Unlike the usual recommendation of at least a 10-fold excess of Hg(II) for anodic stripping experiments at in situ prepared mercury film electrodes, it is found that the cBi/cM ratios in the 1–10 range are sufficient to obtain a high determination sensitivity, but that the signal decreases significantly when the ratio exceeds 40. Further analysis shows that the precision of the analytical results is good when the cBi/cM ratio is in the range of 5–10. The precision is even better in the range of 10–20, but too high a ratio cannot further improve the precision of the results. Therefore, it is recommended to keep the cBi/cM in the range of 5 to 40 to balance the sensitivity and precision in detection. The study also finds that the optimum cathodic potential range is related to the total concentration of metal ions. Therefore, for metals susceptible to hydrogen evolution (e.g., zinc), additional consideration should be given to inhibiting the hydrogen evolution reaction when selecting the cBi/cM ratio. This work is the first to investigate the effect of the cBi/cM ratio on the morphology and thickness of deposits using EIS, SEM, and AFM. It is found that increasing the cBi/cM ratio leads to an increase in the coverage and thickness of the bismuth film on the electrode surface, which enhances the sensitivity of the determination. However, this change is also accompanied by an increase in the electrode resistance, resulting in a significant decrease in signal when the ratio is too large. In addition, when the cBi/cM ratio is <5, the precision of the bismuth film electrode is relatively poor due to the rapid increase of the bismuth coverage on the electrode surface. The uneven thickening of the deposit also affects the cathodic potential range. Based on these findings, standard curves with cBi/cM ratios ranging from 5–25 are prepared and successfully applied to the analysis of river water and wastewater.
1. Introduction
Differential pulse anodic stripping voltammetry (DPASV) combines a unique preconcentration of the analyte with the advanced electrochemical stripping techniques and is considered a powerful electroanalytical tool for the determination of trace metals.1,2 Traditionally, mercury-based electrodes have been used to achieve high reproducibility and sensitivity in stripping analysis. Mercury has remarkable properties suitable for stripping analysis due to its high cathodic hydrogen overpotential and its ability to form amalgams with many metals.3,4 However, the toxicity of mercury and its compounds prevents them from being used for on-site monitoring of heavy metals.5 Extensive efforts are therefore being made to find an environmentally friendly alternative.Bismuth has been proposed as an environmentally friendly element for electrochemical analysis.6,7 In addition, it can form alloys with various metals such as zinc, lead, cadmium, thallium and indium,8–10 facilitating the nucleation process during the preconcentration of metal ions. The overall performance of bismuth film electrodes (BiFEs, consisting of thin films of bismuth deposited on a conductive substrate) has been shown to be close to or in some cases superior to that of mercury electrodes, with attractive properties such as high reproducibility, high sensitivity and a wide cathodic potential range.11–13 There is a growing interest in the use of BiFEs for the determination of trace metals.14
There are currently many different ways of preparing BiFEs. Among them, the in situ bismuth deposition method is the most widely used. In situ bismuth films are formed by co-deposition of bismuth with analytes. The film thickness can be controlled by adjusting the concentration of Bi3+ ions. The optimum bismuth film thickness is usually sought based on the concentration of the target analyte. Too thin films will quickly become saturated with the deposited metal ions, while too thick films will cause mass transfer resistance to metal ions diffusing out of the film during the stripping process.15 An empirical rule suggests that the concentration of Bi3+ ions must be at least 10 times greater than that of the analyte to avoid saturation.16 But other people set forth completely different argument concerning this case. Baldrianova et al. have suggested that a Bi-to-metal ion concentration ratio (cBi/cM ratio) of less than 10 is optimal or equally effective for the determination of Pb and Cd ions on carbon paste and gold electrode substrates.15 In addition, it has also been reported in the literature that bismuth film thickness has little effect on the stripping voltammetry signal for some metals.17 These conclusions are quite different from the general rule.
The aim of this work is to provide new insights into the influence of cBi/cM ratio on the DPASV response. The optimization of the bismuth film thickness is primarily aimed at improving the sensor performance in terms of sensitivity, precision, and cathodic potential range. However, most of the reported studies on bismuth concentration optimisation (as shown in Table 1) have focused on obtaining higher signal intensity by adjusting the bismuth concentration. Although these studies have improved the sensitivity of bismuth-modified sensors to a certain extent, the evaluation of electrode performance is not limited to the single indicator of sensitivity, but also considers a number of indicators, such as precision, cathode potential range, and so on. This over-pursuit of a single indicator may lead to an increase in sensitivity at the expense of other key characteristics. Therefore, in order to comprehensively evaluate and optimise the effect of the cBi/cM ratio on the performance of BiFEs. For the first time, we have systematically investigated the effect of cBi/cM ratio on the evaluation indicators of the DPASV determination, such as sensitivity, precision and cathodic potential range, using BiFEs with Cd and Pb as model analytes. It is expected to find the law of influence of the cBi/cM ratio on each parameter and the optimal range of the cBi/cM ratio, so as to make BiFEs show the best comprehensive performance in practical applications and provide theoretical basis for the performance optimisation of BiFEs.
| Electrode | Metals | cBi/cM ratio | Optimisation indicators | Ref. |
|---|---|---|---|---|
| a Bi-GCE: bismuth film-modified glassy carbon electrode, Bi/MCNTs-CPE: bismuth-modified multiwalled carbon nanotubes doped carbon paste electrode, Bi-SPCNTE: bismuth film-modified screen-printed carbon nanotubes electrodes, Bi-CNT: bismuth-modified carbon nanotube electrode, Bi-CPE: bismuth-coated carbon paste electrode. | ||||
| Bi-GCE | Se(IV) | 63 | Sensitivity | 18 |
| Bi-GCE | Zn, Cd, Pb, Cu | 33 | Sensitivity | 19 |
| Bi/MCNTs-CPE | Cd | 4 | Sensitivity and selectivity | 20 |
| Bi-SPCNTE | Pb, Cd, Zn | 3 | Sensitivity | 21 |
| Bi-CNT | Pb, Cd, Zn | 10 | Sensitivity | 22 |
| Bi-CPE | Pb, Cd | 1–10 | Sensitivity and linearity | 15 |
2. Experimental
2.1 Chemicals and solutions
The 1 g L−1 atomic absorption standard solutions of Cd(II), Pb(II) and Bi(III) were supplied by the National Standard Reference Materials Center of China. All other reagents used were of analytical grade. Ultrapure water (18.2 MΩ cm) was used throughout the experiments. The working stock solutions of Cd and Pb were prepared by appropriately diluting 1 g L−1 of the standard solutions with ultrapure water, while the working stock solutions of Bi were prepared by appropriately diluting 1 g L−1 of the standard solution with 0.1 mol L−1 HNO3. Acetate buffer solution (1 mol L−1, pH = 4.5) was prepared from CH3COOH and CH3COONa as a supporting electrolyte for this study.2.2 Apparatus
DPASV and linear sweep voltammetry (LSV) were performed using a CHI 660e potentiostat/galvanostat (CH Instrument Co., China). Electrochemical impedance spectroscopy (EIS) was performed using a Zennium electrochemical workstation (Zahner, Germany). A glass cell with a three-electrode configuration was used for all experiments. The working electrode was a glassy carbon disc (3 mm diameter) coated with the bismuth film. The reference electrode was a Hg/Hg2Cl2 (saturated KCl) and the auxiliary electrode was a Pt sheet. The morphologies of the BiFEs were examined using a Sigma 500 scanning electron microscope and a cspm 5500 atomic force microscope.2.3 Measurement procedure
Prior to use, the glassy carbon electrode (GCE) was mechanically polished with Al2O3 suspensions (1.0 μm and 0.3 μm), then sonicated with absolute ethanol and water for 1 min, respectively, and rinsed with water after each cleaning step. Subsequently, the pre-treated GCE was then immersed, together with the other two electrodes, in a acetate buffer solution (pH 4.5) containing the required concentration of Bi ions and model heavy metals (Cd and Pb).For the DPASV experiments, in situ BiFEs were prepared by simultaneous deposition of Bi and model metals on the surface of GCE surface with stirring at – 1.0 V for 20 s. Stirring was then stopped and, after a resting period of 60 s, DPASV was recorded at a potential range of −1.0 to 0.4 V (with a step of 0.004 V, amplitude of 0.05 V, pulse width of 0.05 s and sampling width of 0.0167 s). Following each measurement, a potential of 1.0 V was applied to the electrode to remove residual metals from the electrode surface under stirring conditions.
LSV and EIS measurements were performed using the same deposition, resting, and cleaning procedures as for DPASV analysis (Eacc = −1.0 V, tacc = 20 s, tquiet = 60 s, Ecleaning = 1.0 V, tcleaning = 240 s). LSV measurements were performed in a acetic acid buffer (pH 4.5) at a scan rate of 5 mV s−1. EIS spectra were recorded in a solution of Fe(CN)63−/Fe(CN)64− (5 mmol L−1) at open-circuit potential (Eoc) in the frequency range 1 Hz to 100 kHz with an amplitude of 5 mV.
2.4 Sample preparation
River water was taken from the Zhouxi River in Meizhou, China. The effluent was collected from the silica sand purification process. Samples were filtered and stored in a refrigerator prior to analysis. Acetate buffer solution (pH 4.5) was prepared with the pretreated samples (river water and wastewater) and used for the determination of Cd and Pb.3. Results and discussion
3.1 Effect of cBi/cM ratio on the sensitivity of Cd and Pb determinations
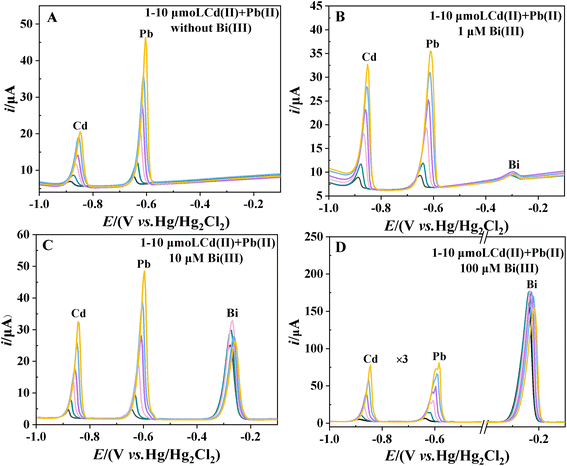
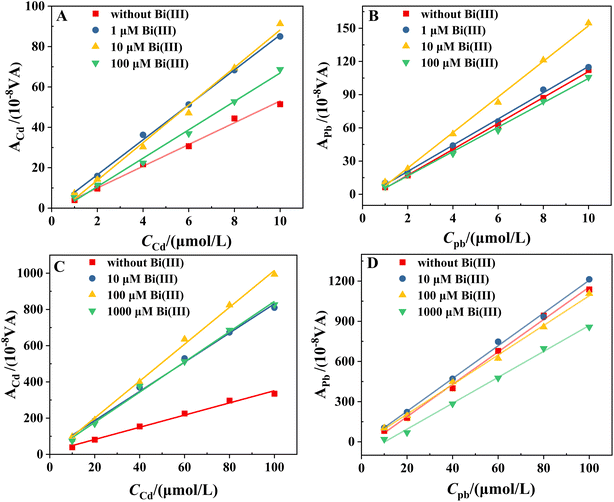
The sensitivity of the determination of Cd and Pb is determined from the slopes of the calibration curves for these two analytes. Fig. 1A–D shows the stripping voltammograms in the Cd2+ + Pb2+ solutions at concentrations of 1, 2, 4, 6, 8 and 10 μM in the presence of 0, 1, 10 and 100 μM Bi(III), respectively. It can be seen that in all cases, the stripping peaks of Cd, Pb and Bi appear at −0.88, −0.65 and −0.30 to 0.24 V versus Hg/Hg2Cl2 (saturated KCl), respectively (similar to the documented values of GCEs23,24). The potential of the three stripping peaks shows a gradual positive shift with increasing concentrations of Cd and Pb. Fig. 1A and B shows that even at low cBi/cM ratios (0 and 1 μM Bi), the stripping voltammograms show well-defined signals, but with the sloping baselines. Increasing the Bi concentration (10 and 100 μM Bi) flattens the baseline. However, at a higher Bi concentration (100 μM Bi), the Pb stripping peaks are either deformed or even split into two (Fig. 1D). It can be reasonably inferred that the peak with more negative potentials corresponds to weakly bonded Pb (formed preferentially in thinner films), while the peak with more positive potentials corresponds to bulk Pb (formed on top of the former in thicker films).The calibration curves for Cd and Pb in the presence of 0, 1, 10 and 100 μM Bi are shown in Fig. 2A and B. Fig. 2 shows that the cBi/cM ratio has a significant effect on the sensitivity of Cd and Pb determinations. It can be seen that the sensitivity of Cd and Pb determinations increases significantly when the concentration of Bi is increased from 0 μM to 10 μM. However, when the concentration of Bi is further increased to 100 μM (cBi/cM ratio: 10–100), the sensitivity of the Cd and Pb determinations decreases. Fig. 1 and 2 demonstrate that a cBi/cM ratio of less than 10 is adequate to obtain high quality and sensitivity data at BiFEs, even better than those obtained with a 10- to 100-fold Bi excess. This finding is consistent with the previous report that a cBi/cM ratio of less than 10 is quite effective at carbon paste and gold electrodes.15
The effect of the cBi/cM ratio on the sensitivity of the determination is further investigated when the initial concentrations of Cd and Pb are different. The calibration curves for Cd and Pb in the presence of 0, 10, 100 and 1000 μM Bi in the range of 10 to 100 μM are shown in Fig. 2C and D. It can be seen that the highest sensitivities for Cd and Pb determinations are obtained when the cBi/cM ratio is in the range of 1–10 (100 μM Bi) and 0.1–1 (10 μM Bi), respectively, whereas further increases in Bi concentration leads to a decrease in sensitivity. This suggests that a cBi/cM ratio of less than 10 is sufficient to achieve high sensitivity detection. This result is in general agreement with the above findings. However, closer inspection of the data shows that the optimum cBi/cM ratio for Pb decreases with increasing initial concentration (from 1–10 to 0.1–1), while it remains constant for Cd. This difference may be due to the fact that the BiFEs are more effective in increasing the sensitivity of Cd determination compared to Pb (Fig. 2). This difference may also be related to the negative effect of increasing the thickness of the bismuth film. Too thick a bismuth film can cause mass transfer resistance as the metal ions diffuse out of the film.
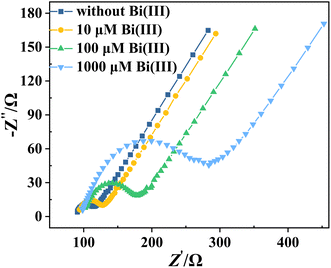
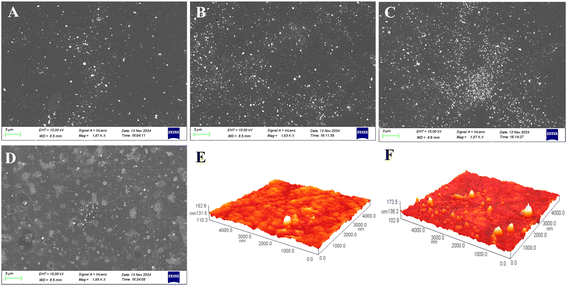
To verify the above speculation, we perform EIS measurements on several BiFEs using [Fe(CN)6]3−/4− as the electroactive species (as shown in Fig. 3). To prepare these electrodes, Cd and Pb are co-deposited at a concentration of 10 μM each, together with different concentrations of Bi (0, 10, 100 and 1000 μM, respectively). The aim of this analysis is to investigate how the electrodes behave in terms of polarisation resistance (Rp), which is a measure of how the material resists transferring the electron to electroactive species in solution. The lower the value of Rp is, the easier the electrons can be transferred, the faster the redox reaction occurs, and therefore the higher the stripping signal and the sensitivity obtained in the electroanalysis are.25–27 The value of Rp can be estimated from the loop diameter observed in the Nyquist spectra.28 As shown in Fig. 3, the lowest Rp is observed for the electrode without co-deposited Bi (the smallest ring formed), and the Rp of the electrode gradually increases with increasing Bi concentration. This finding suggests that the metal film deposited on the surface of the electrode hinders the transfer of electrons from the surface of the electrode to the [Fe(CN)6]3−/4− in the solution. And the thicker the film is, the greater the resistance to electron transfer is, and consequently the lower the sensitivity of the detection is. DPASV and EIS measurements show that the cBi/cM ratio has a dual effect on the sensitivity of Cd and Pb determinations. Increasing the thickness of the bismuth film improves the sensitivity of the determination. However, the increase in sensitivity is accompanied by a simultaneous increase in electrode resistance, which reduces the sensitivity. This conclusion is supported by the SEM pictures. Fig. 4A–D shows SEM images of the different BiFEs prepared by simultaneous co-deposition of different concentrations of Bi(III) (0, 10, 100 and 1000 μM) and 10 μM Cd2+ + Pb2+ on the surface of GCE. The electrode surface of undeposited bismuth is relatively smooth, with a small part of the surface covered by square or nearly spherical agglomerates (Fig. 4A). Increasing the concentration of Bi(III) from 0 to 100 μM results in a gradual increase in the number of deposit particles and a gradual decrease in particle size (Fig. 4B and C). The reduction in particle size indicates that the addition of Bi promotes the nucleation of the metal during electrodeposition, resulting in more uniform metal deposition. This also increases the specific surface area of the electrode, providing more binding sites for heavy metal ions and further enhancing the enrichment capacity of heavy metal ions. At the higher concentration of Bi(III) (Fig. 4D, 1000 μM), the small deposit particles aggregate into island-like microstructures that cover most of the surface of the electrode. AFM images are also taken to further investigate the surface of the electrodes (Fig. 4E and F). As shown, the electrode surface becomes visibly thicker and rougher as the Bi(III) concentration increases from 0 to 100 μM. To some extent, the rougher the film is, the more active sites and surface area are available for metal detection. Fig. 4 provides further evidence that increasing the cBi/cM ratio significantly increases the bismuth coverage and the bismuth film thickness on the electrode surface, which in turn improves the sensitivity of the determination. At the same time, this change also leads to an increase in the Rp of the electrode.
As can be seen in Fig. 2A and C, the sensitivity of the Cd determination shows a marked increase with increasing Bi concentration in both concentration ranges studied when the cBi/cCd ratio is less than 10. Although an increase in the cBi/cCd ratio results in a corresponding increase in the electrode resistance, an appropriate increase in the cBi/cCd ratio still significantly improves the sensitivity of the Cd determination, and thus the optimum cBi/cCd ratio for Cd determination remains constant. The situation is different for Pb. When the Pb concentration is low (Fig. 2B), an increase in the cBi/cPb ratio (in the range of cBi/cPb ratio <10) is still effective in improving the sensitivity. At higher Pb concentrations (Fig. 2D), an increase in the cBi/cPb ratio results in a smaller increase in sensitivity and an increase in electrode resistance due to the thickening of the bismuth film. Therefore, the optimum cBi/cPb ratio for Pb determination decreases with increasing concentration. Although the optimum cBi/cM ratio varies depending on the type of metal and the initial concentration, this study suggests that a cBi/cM ratio of less than 10 is indeed adequate to obtain highly sensitive data at BiFEs for the two concentration ranges studied, in some cases even better than that obtained with 10–100 times the excess of Bi.
3.2 Effect of cBi/cM ratio on the precision of Cd and Pb determinations
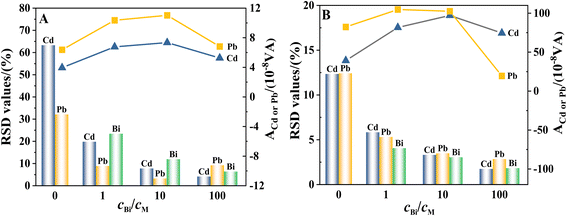
The precision of the determination is assessed based on the calculation of the relative standard deviation (RSD) of the anodic stripping peak areas of Cd and Pb. For the determination of the peak area, equal amounts of Cd and Pb (at concentrations of 1 μM and 10 μM, respectively) are simultaneously injected into acetate buffer solutions in the presence of 0, 1, 10 and 100-fold Bi and the corresponding stripping voltammograms are recorded. Each measurement is repeated at least five times within the same day and outliers identified using the Dixon's and Grubbs' statistical tests (at a 95% confidence level) are discarded.29 Fig. 5A and B shows the RSD values of Cd, Pb and Bi and the stripping peak areas of Cd and Pb at different cBi/cM ratios at two concentration levels. Given that the concentrations of Cd and Pb in the samples exceed 0.1 mg L−1, RSD ≤ 10.0% is used to demonstrate the precision of the determination.30For thinner films (1 μM Cd and Pb, Fig. 5A), the least precise results for the simultaneous determination of Cd and Pb are obtained at electrodes without co-deposited Bi (largest RSD values, 63.3% and 32.1%, respectively). When Cd and Pb are co-deposited with Bi, the RSD values of Cd and Pb initially decrease significantly with increasing cBi/cM ratio, and the RSD values of Cd and Pb are lower than 10% when the cBi/cM ratio reaches 10 and 1, respectively. With further increase of the cBi/cM ratio, the RSD values of Cd and Pb continue to decrease. However, except for the determination of Pb at the electrode with 100-fold co-deposited Bi, the RSD value instead increases with the increase of the cBi/cPb ratio. This may be due to the fact that too thick a film greatly weakens the response signal of Pb, resulting in a significant decrease in the precision of the determination.
For thicker films (10 μM Cd and Pb, Fig. 5B), the precision of the simultaneous determination of Cd and Pb at electrodes without co-deposited Bi is unsatisfactory (RSD > 10.0%), even though the response signals of Cd and Pb are significantly larger than those of Cd and Pb at thinner films. When Cd and Pb are co-deposited with Bi, the RSD values for both analytes are significantly lower than 10.0% even with a cBi/cM ratio of 1 (RSDs of 5.8% and 5.3% for Cd and Pb, respectively). An increase in the cBi/cM ratio results in a further decrease in the RSD values for Cd and Pb. However, when Pb is determined at the electrode with 100-fold co-deposited Bi, the RSD value continues to decrease with increasing cBi/cPb ratio, even though the response signal of Pb at this time is even smaller than that of Pb at the electrode without co-deposited Bi. This indicates that the magnitude of the Pb response signal is not a major factor affecting the precision of its determination.
In order to obtain a reasonable explanation, the reproducibility of BiFEs is evaluated based on the RSD values of Bi (Fig. 5A and B). It can be seen that the RSD values of Bi decrease as the cBi/cM ratio increases for both thin and thick films. This suggests that an increase in the cBi/cM ratio is beneficial for improving the reproducibility of the BiFEs and thus the precision of the results for the determination of Cd and Pb. Furthermore, for the same cBi/cM ratio, the thicker bismuth film appears to have higher reproducibility than the thinner bismuth film. This indicates that, in addition to the cBi/cM ratio, which is the primary factor, the magnitude of the response signal also affects the reproducibility of the bismuth film electrode, which in turn affects the precision of Cd and Pb determinations. Consequently, at a cBi/cM ratio of 100, a decrease in the Pb response signal at the thinner bismuth film will result in a corresponding decrease in its detection precision, while the increase in reproducibility of the thicker bismuth film will alleviate the effect of the decrease in the Pb response signal on its detection precision. Fig. 5 shows that cBi/cM ratios less than or equal to 10 are indeed sufficient to obtain relatively precise results (RSD ≤ 10%) at BiFEs, but in most cases, a cBi/cM ratio greater than 10 is more conducive to improving the precision of metal ion determination. Given that the stripping signals of Cd and Pb are significantly weakened at higher cBi/cM ratios, it is necessary to identify an optimum cBi/cM ratio to ensure that the electrodes have sufficient reproducibility and high sensitivity at the same time.
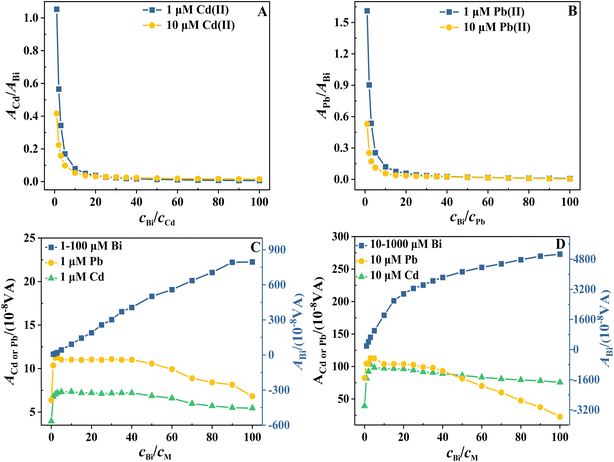
To identify an appropriate cBi/cPb ratio, we introduce the approach commonly used for Bi electrodes proposed by Wang et al. to evaluate the effect of cBi/cM variations on the signal based on the normalization of the metal ion peak area to the Bi peak area.31 The constancy of this ratio implies that the cBi/cM ratio has a similar effect on metal and Bi deposition, and therefore the metal–bismuth interaction and deposit morphology are likely to remain constant. Fig. 6A and B shows the variation of the normalized Cd and Pb stripping peak areas with cBi/cM ratio measured from 1.0 and 10 μM Cd2+ + Pb2+ solutions in the presence of excess Bi(III). It can be seen that, regardless of the initial concentrations of Cd and Pb, the normalized Cd and Pb peak areas follow the same trend with cBi/cM ratio. When cBi/cM < 5, the normalized Cd and Pb peak areas decrease rapidly with the increase of cBi/cM ratio; when cBi/cM > 5, the decreasing trend becomes slower; and when cBi/cM > 10, the decreasing trend is no longer significant. It is important to note that the smaller cBi/cM ratio is, the larger the normalised peak area is. This suggests a higher utilisation of the Bi deposit for DPASV purposes at a lower Bi coverage. Meanwhile, at cBi/cM < 5, the normalized Cd and Pb peak areas decrease rapidly with increasing cBi/cM ratio, also indicating a large change in deposit morphology.
In order to identify the reasons for these variations, Fig. 6C and D shows the variation of the stripping peak areas of Cd, Pb and Bi with cBi/cM ratio measured from 1.0 and 10 μM Cd2+ + Pb2+ solutions, respectively, in the presence of excess Bi(III). It can be seen that no linearity is observed over the entire cBi/cM range studied (1–100) for both Bi concentrations. Indeed, saturation begins at cBi/cM ratios greater than about 50 (for 1 μM to 100 μM Bi) and 20 (for 10 μM to 1000 μM Bi), depending on the Bi concentration. This indicates a change in the morphology of the deposit. The SEM images in Fig. 4 show that as the thickness of the bismuth film increases, the deposit changes from a highly dispersed thin layer to a dense layer with a small specific surface area. The deposit thickens unevenly as it grows preferentially on top of already deposited patches. This uneven development may lead to high local current densities, which in turn reduces the current efficiency of the Bi deposition, making it more favourable to the hydrogen evolution reaction and leading to a gradual decrease in the rate of Bi deposition.15 Consequently, the Bi enrichment increases rapidly with the cBi/cM ratio, followed by a slower growth trend and finally saturation.
Meanwhile, Fig. 6C and D shows that the peak areas of Cd and Pb at both concentration levels initially increase rapidly with increasing cBi/cM ratio (cBi/cM ≤ 1), reaching a maximum at cBi/cM ≤ 10. Subsequently, the peak areas remain relatively constant in the ranges of cBi/cM ≤ 40 and finally decrease with increasing cBi/cM ratio. These results indicate that a cBi/cM ratio of 1 is sufficient to achieve high sensitivity in the determination of Cd and Pb, whereas when this ratio exceeded the 40![[thin space (1/6-em)]](https://www.rsc.org/images/entities/char_2009.gif) :
:![[thin space (1/6-em)]](https://www.rsc.org/images/entities/char_2009.gif) 1 value, a signal deterioration is obtained in most cases. Furthermore, it is important to note that the magnitude of variation in the Cd and Pb peak areas is much smaller than that of Bi. This suggests that the change in the amount of Bi enrichment, rather than the amount of Cd and Pb enrichment, is the main reason for the power-exponential decrease in the normalized Cd and Pb peak areas and for the significant change in deposit morphology. Consequently, the normalized Cd and Pb peak areas follow the same trend with cBi/cM ratio, regardless of the type and initial concentration of metal ions. When cBi/cM ratio is relatively low, the peak area of Bi increases rapidly with the increase of cBi/cM ratio, resulting in a rapid decrease in the normalized Cd and Pb peak areas. When the cBi/cM ratio is relatively high, the increase in the peak area of Bi slows down, and the trend of decrease in the normalized Cd and Pb peak areas then slows down. Furthermore, the normalized Cd and Pb peak areas decrease rapidly at cBi/cM < 5, indicating that the deposit morphology changes significantly with the cBi/cM ratio. This leads to relatively poor reproducibility of BiFEs, as evidenced by the results in Fig. 5. Therefore, in order to obtain relatively precise data, the cBi/cM ratio should preferably be >5, and ≥10 when higher precision is required. However, further study of the data in Fig. 6 shows that the decreasing trend of the normalised Cd and Pb peak areas is no longer significant when the cBi/cM ratio is >10. This indicates that an excessive increase in the cBi/cM ratio is ineffective in improving the reproducibility of BiFEs and the precision of the analytical results. In fact, such a practice will reduce the sensitivity of the determination. Therefore, when high precision is required, a cBi/cM ratio between 10 and 40 is sufficient, which may ensure that the electrode has sufficient reproducibility and also has a high sensitivity at the same time.
1 value, a signal deterioration is obtained in most cases. Furthermore, it is important to note that the magnitude of variation in the Cd and Pb peak areas is much smaller than that of Bi. This suggests that the change in the amount of Bi enrichment, rather than the amount of Cd and Pb enrichment, is the main reason for the power-exponential decrease in the normalized Cd and Pb peak areas and for the significant change in deposit morphology. Consequently, the normalized Cd and Pb peak areas follow the same trend with cBi/cM ratio, regardless of the type and initial concentration of metal ions. When cBi/cM ratio is relatively low, the peak area of Bi increases rapidly with the increase of cBi/cM ratio, resulting in a rapid decrease in the normalized Cd and Pb peak areas. When the cBi/cM ratio is relatively high, the increase in the peak area of Bi slows down, and the trend of decrease in the normalized Cd and Pb peak areas then slows down. Furthermore, the normalized Cd and Pb peak areas decrease rapidly at cBi/cM < 5, indicating that the deposit morphology changes significantly with the cBi/cM ratio. This leads to relatively poor reproducibility of BiFEs, as evidenced by the results in Fig. 5. Therefore, in order to obtain relatively precise data, the cBi/cM ratio should preferably be >5, and ≥10 when higher precision is required. However, further study of the data in Fig. 6 shows that the decreasing trend of the normalised Cd and Pb peak areas is no longer significant when the cBi/cM ratio is >10. This indicates that an excessive increase in the cBi/cM ratio is ineffective in improving the reproducibility of BiFEs and the precision of the analytical results. In fact, such a practice will reduce the sensitivity of the determination. Therefore, when high precision is required, a cBi/cM ratio between 10 and 40 is sufficient, which may ensure that the electrode has sufficient reproducibility and also has a high sensitivity at the same time.
3.3 Effect of cBi/cM ratio on the cathodic potential range of Cd and Pb determinations
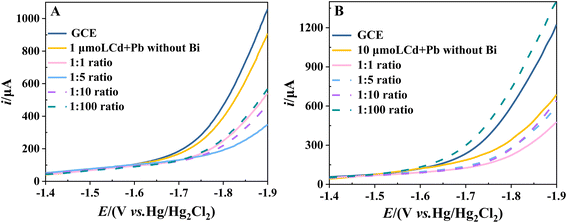
When the redox reaction occurs at the electrode, there is also a competitive reaction in which water is electrolyzed to produce oxygen and hydrogen. If the oxidation potential of the substance being studied is less than the oxygen evolution potential or the reduction potential is greater than the hydrogen evolution potential, then the substance will be oxidized or reduced at the electrode before the electrode reaches the oxygen or hydrogen evolution potential. This allows the oxidation or reduction process to be better analysed. However, if the oxidation or reduction process takes place outside the potential window of the electrode, the information obtained about the substance will be affected by the evolution of hydrogen or oxygen. Consequently, the optimum conditions for the study are not obtained or the study cannot be carried out at all.BiFEs have been shown to have a wider cathodic potential range, which can be determined experimentally by cathodic polarisation curves. Fig. 7A shows the cathodic polarization curves of GCE and BiFEs in acetate buffer (pH 4.5). BiFEs are prepared by simultaneous co-deposition of different concentrations of Bi(III) (0, 1, 5, 10 and 100 μM) and 1.0 μM Cd2+ + Pb2+ on the surface of GCE. The hydrogen evolution potential is estimated using the tangent line method. It is evident that the cathodic potential range of the electrode with the co-deposited metal films of Cd and Pb is wider than that of the GCE. It is also observed that the cathodic potential range of BiFEs gradually widens with an increase in the cBi/cM ratio. The hydrogen evolution potential is the most negative at −1.79 V versus Hg/Hg2Cl2 when the cBi/cM ratio is 5, and then gradually narrows with an increase in the cBi/cM ratio.
We further test the cathodic polarization curves of thicker BiFEs in acetate buffer. Fig. 7B shows the polarization curves of GCE and BiFEs. BiFEs are prepared by simultaneous co-deposition of different concentrations of Bi(III) (0, 10, 50, 100 and 1000 μM) and 10.0 μM Cd2+ + Pb2+ on the GCE surface. It can be seen that the cathodic potential range of the metal film electrode formed by the co-deposition of Cd and Pb is much wider than that of GCE, indicating that the metal film formed by the co-deposition of Cd and Pb can also be effective in increasing the cathodic potential range of the electrode. Furthermore, increasing the cBi/cM ratio, the cathodic potential range of the thicker BiFEs also becomes wider and then narrower. However, the hydrogen evolution potential is most negative when the cBi/cM ratio is 1. And when the cBi/cM ratio is 100, the cathodic potential range of the thicker BiFE is narrower than that of the GCE.
Fig. 7A and B shows that the higher the initial concentration of Cd and Pb, the lower the cBi/cM ratio required for BiFEs to reach the optimum cathodic potential range. Furthermore, the metal film formed by the co-deposition of Cd and Pb is also shown to be effective in increasing the cathodic potential range of the electrode. Therefore, the optimum cathodic potential range appears to be related to the total concentration of metal ions. The cathodic potential range of the electrodes is found to be greatest when the total concentration of metal ions is 40–50 μM at both concentration levels. Given that too thick a metal film is more favourable for hydrogen evolution reactions, too high a cBi/cM ratio will result in a narrower cathodic potential range at the electrode, possibly even narrower than that of GCE.15 The present study indicates that a cBi/cM ratio less than or equal to 5 is sufficient for a wide cathodic potential range for BiFEs at two common Cd and Pb concentration levels (1 μM and 10 μM). If the initial concentrations of Cd and Pb are low, it may be necessary to increase the cBi/cM ratio on a case-by-case basis.
3.4 Analytical applications
For the analysis of real samples, standard curves are prepared in the range of 5–25 cBi/cM ratios to ensure that the electrode has sufficient stability and high sensitivity. First, the voltammogram of the blank solution is measured. The stripping peaks for Cd and Pb do not develop. Then standard solutions of Cd and Pb are added to the river water (simultaneously) and the anodic stripping peak areas are then recorded (Fig. 8). The reproducibility and repeatability of BiFEs are investigated by making 5 repeated measurements with 5 different electrodes and 5 repeated measurements with the same electrode.32 The results (Table 2) show that the recoveries (recovery values in the range of 80.0–120.0%), reproducibility and repeatability (RSD < 20.0% in all cases) of Cd and Pb are satisfactory, suggesting the applicability for real sample analysis.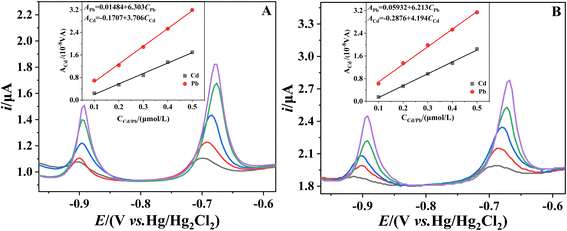 | ||
| Fig. 8 Stripping performances of BiFEs toward Cd and Pb in the river water (A) and wastewater (B) with 0.1, 0.2, 0.3, 0.4 and 0.5 μM of five standard metals, respectively. | ||
| Sample type | Metal | Added (μM) | Founded by DPASV (μM) | STD (%) | Recovery (%) |
|---|---|---|---|---|---|
| a The measurement was performed for 5 times with the same electrode.b The measurement was performed for 5 times with 5 different electrodes. | |||||
| The river water | Cd | 0.10a | 0.110 | 6.0 | 110 |
| 0.10b | 0.113 | 7.2 | 113 | ||
| Pb | 0.10a | 0.0945 | 2.7 | 94.5 | |
| 0.10b | 0.109 | 3.5 | 109 | ||
| Wastewater | Cd | 0.10a | 0.113 | 15.2 | 113 |
| Pb | 0.10a | 0.0927 | 3.1 | 92.7 | |
Wastewater is also analysed in five replicate determinations to evaluate the present method (Fig. 8). The data presented in Table 2 indicate that the determination of Cd and Pb in wastewater is possible since major metal ions such as Na, K, Ca, Mg, Fe and Al show no effect on the determination of Cd and Pb. The above results show that BiFEs have good application prospects for the detection of Cd and Pb in different samples.
4. Conclusions
The work provides more details and insight into the influence of the cBi/cM ratio on the DPASV response. The study shows that:(i) For the determination of Cd(II) and Pb(II) ions by DPASV, the cBi/cM ratios in the 1–10 range are sufficient to obtain high quality and sensitivity data at BiFEs. However, at cBi/cM ratios >40, there is a significant drop in signal.
(ii) The cBi/cM ratios in the 5–10 range are adequate to obtain relatively precise data with RSD ≤ 10.0%. If higher precision is required, a cBi/cM ratio of 10–20 is sufficient. Too high a cBi/cM ratio is ineffective in improving the precision of the analytical results.
(iii) The optimum cathodic potential range is related to the total concentration of metal ions. For the two common Cd and Pb concentration levels (1 μM and 10 μM), the cBi/cM ratios in the 1–5 range are sufficient to give BiFEs a wide cathodic potential range. If the initial concentrations of Cd and Pb are low, it is necessary to increase the cBi/cM ratio on a case-by-case basis.
Unlike the usual recommendation of at least 10-fold excess of Hg(II) for anodic stripping experiments at in situ prepared mercury film electrodes, the present study finds that the law of the influence of the cBi/cM ratio on the sensitivity is in agreement with the conclusions of Table 1. However, in order to balance between the high sensitivity and precision of the electrode, it is recommended that the cBi/cM ratio should be greater than 5 and less than 40. For metals susceptible to hydrogen evolution (e.g., zinc), the need to inhibit the hydrogen evolution reaction should also be taken into account when choosing the cBi/cM ratio. In this work, standard curves are prepared in the range of 5–25 cBi/cM ratios, and Cd and Pb are determined simultaneously in river water and wastewater. The result shows that the method has good accuracy and precision in these medium. This confirms the applicability of BiFEs in the analysis of real samples.
Data availability
The authors confirm that the data supporting the findings of this study are available within the article.Author contributions
Writing: Hongwei Guo; software: Ruiyang Wang; investigation: Bin Chen, Yingmin Luo, Qichang Tian; supervision: Yanping Chang; all authors have read and agreed to the published version of the manuscript.Conflicts of interest
The authors declare no conflict of interest.Acknowledgements
This work was supported by the Rural Science and Technology Program of Guangdong Province, China (No. 2021A0304012).References
- K. K. Kumar, M. Devendiran, P. S. Kumar and S. S. Narayanan, Quercetin-rGO based mercury-free electrode for the determination of toxic Cd(II) and Pb(II) ions using DPASV technique, Environ. Res., 2021, 202, 111707–111716 Search PubMed.
- F. Hashemi, A. R. Zanganeh, F. Naeimi and M. Tayebani, Fabrication of an electrochemical sensor based on metal-organic framework ZIF-8 for quantitation of silver ions: optimizing experimental conditions using central composite design (CCD), Anal. Methods, 2020, 12, 3045–3055 RSC.
- Ø. Mikkelsen, K. H. Schrode and T. A. Aarhaug, Dental amalgam, an alternative electrode material for voltammetric analyses of pollutants, Collect. Czech. Chem. Commun., 2001, 66, 465–472 CrossRef.
- O. Vajdle, V. Guzsvány, D. Skoric, J. Anojcic, P. Jovanov, M. Avramov-Ivic, J. Csanadi, Z. Kónya, S. Petrovic and A. Bobrowski, Voltammetric behavior of erythromycin ethylsuccinate at a renewable silver-amalgam film electrode and its determination in urine and in a pharmaceutical preparation, Electrochim. Acta, 2016, 191, 44–54 CrossRef CAS.
- V. Bhardwaj, V. M. Nurchi and S. K. Sahoo, Mercury toxicity and detection using chromo-fluorogenic chemosensors, Pharmaceuticals, 2021, 14, 123–167 CrossRef CAS PubMed.
- S. Legeai and O. Vittori, A Cu/Nafion/Bi electrode for on- site monitoring of trace heavy metals in natural waters using anodic stripping voltammetry: an alternative to mercury-based electrodes, Anal. Chim. Acta, 2006, 560, 184–190 CrossRef CAS.
- N. B. Li, W. W. Zhu, J. H. Luo and H. Q. Luo, A stannum-bismuth composite film electrode for simultaneous determination of zinc(II) and cadmium(II) using differential pulse anodic stripping voltammetry, Analyst, 2012, 137, 614–617 RSC.
- D. W. Pan, L. Zhang, J. M. Zhuang, T. J. Yin and W. Qin, A novel tin-bismuth alloy electrode for anodic stripping voltammetric determination of zinc, Microchim. Acta, 2012, 177, 59–66 CrossRef CAS.
- W. L. Gong, X. Y. Du, S. R. Wang, X. C. Jiang and S. Qian, Ex situ plating bismuth film on platinum electrode for the determination of trace lead and cadmium by differential pulse stripping voltammetry, Chin. J. Anal. Chem., 2008, 36, 177–181 CAS.
- J. Wang, J. Lu, Ü. A. Kirgöz, S. B. Hocevar and B. Ogorevc, Insights into the anodic stripping voltammetric behavior of bismuth film electrodes, Anal. Chim. Acta, 2001, 434, 29–34 CrossRef CAS.
- X. Zhou, Z. Gai, Y. Wang, S. Liu, X. Zhang, F. Guo, M. Zhang, L. Zhang and X. Jiang, High performance ratiometric detection towards trace Cd(II) and Pb(II) utilizing in-situ bismuth modified nitrogen rich porous carbon/boron doped diamond composite electrode, J. Environ. Chem. Eng., 2023, 11, 109448–109458 CAS.
- Y. Y. Gu, D. T. Xiang, K. Cai, Y. H. Wang, Y. Mei, J. Han and H. Z. Pan, Ultrasensitive electrochemical detection of Cr(VI) in the air of workplace using the bismuth film modified electrode, Electrocatalysis, 2023, 14, 78–87 CAS.
- Y. Tian, L. Z. Hu, S. Han, Y. L. Yuan, J. G. Wang and G. B. Xu, Electrodes with extremely high hydrogen overvoltages as substrate electrodes for stripping analysis based on bismuth-coated electrodes, Anal. Chim. Acta, 2012, 738, 41–44 Search PubMed.
- V. Keramari, S. G. Papadimou, E. E. Golia and S. Girousi, Bismuth film along with dsDNA-modified electrode surfaces as promising (bio)sensors in the analysis of heavy metals in soils, Biosensors (Basel), 2024, 14, 310–322 CAS.
- L. Baldrianova, I. Svancara, M. Vlcek, A. Economou and S. Sotiropoulos, Effect of Bi(III) concentration on the stripping voltammetric response of in situ bismuth-coated, Electrochim. Acta, 2006, 52, 481–490 CAS.
- X. Y. Du, W. L. Gong, Y. X. Zhang, M. Q. Wang, S. R. Wang and J. I. Anzai, Preparation of bismuth film-modified gold electrodes for the determination of trace level of heavy metals in vegetables, Sens. Lett., 2007, 5, 572–577 CrossRef CAS.
- D. Demetriades, A. Economou and A. Voulgaropoulos, A study of pencil-lead bismuth-film electrodes for the determination of trace metals by anodic stripping voltammetry, Anal. Chim. Acta, 2004, 519, 167–172 CrossRef CAS.
- M. Grabarczyk and M. Adamczyk, New Strategies for the simple and sensitive voltammetric direct quantification of Se(IV) in environmental waters employing bismuth film modified glassy carbon electrode and amberlite resin, Molecules, 2021, 26, 4130–4145 CrossRef CAS PubMed.
- N. M. Thanh, N. V. Hop, N. D. Luyen, N. H. Phong and T. T. T. Toan, Simultaneous determination of Zn(II), Cd(II), Pb(II), and Cu(II) using differential pulse anodic stripping voltammetry at a bismuth film-modified electrode, Adv. Mater. Sci. Eng., 2019, 2019, 1826148–1826158 Search PubMed.
- J. H. Luo, X. X. Jiao, N. B. Li and H. Q. Luo, Sensitive determination of Cd(II) by square wave anodic stripping voltammetry with in situ bismuth-modified multiwalled carbon nanotubes doped carbon paste electrodes, J. Electroanal. Chem., 2013, 689, 130–134 CrossRef CAS.
- U. Injang, P. Noyrod, W. Siangproh, W. Dungchai, S. Motomizu and O. Chailapakul, Determination of trace heavy metals in herbs by sequential injection analysis-anodic stripping voltammetry using screen-printed carbon nanotubes electrodes, Anal. Chim. Acta, 2010, 668, 54–60 CrossRef CAS PubMed.
- G. H. Hwang, W. K. Han, J. S. Park and S. G. Kang, Determination of trace metals by anodic stripping voltammetry using a bismuth-modified carbon nanotube electrode, Talanta, 2008, 76, 301–308 CrossRef CAS.
- Y. Guo, Y. Ma, G. Z. Gao, J. Li and J. Q. Xu, Differential pulse anodic stripping voltammetry determination of lead(II) and cadmium(II) with multiwalled carbon nanotubes-thiol functionalized chitosan modified bismuth film electrode, Asian J. Chem., 2014, 26, 113–118 CrossRef CAS.
- G. Zhao and G. Liu, A portable electrochemical system for the on-site detection of heavy metals in farmland soil based on electrochemical sensors, IEEE Sens. J., 2018, 18, 5645–5655 CAS.
- B. Petovar, K. Canary and M. Finsgar, A detailed electrochemical impedance spectroscopy study of a bismuth-film glassy carbon electrode for trace metal analysis, Anal. Chim. Acta, 2018, 1004, 10–21 CrossRef CAS.
- L. Shi, Y. Y. Li, X. J. Rong, Y. Wang and S. M. Ding, Facile fabrication of a novel 3D graphene framework/Bi nanoparticle film for ultrasensitive electrochemical assays of heavy metal ions, Anal. Chim. Acta, 2017, 968, 21–29 CrossRef CAS PubMed.
- M. A. Deshmukh, R. Celiesiute, A. Ramanaviciene, M. D. Shirsat and A. Ramanavicius, EDTA_PANI/SWCNTs nanocomposite modified electrode for electrochemical determination of copper(II), lead(II) and mercury(II) ions, Electrochim. Acta, 2018, 259, 930–938 CrossRef CAS.
- M. Finšgar, B. Petovar and K. Vodopivec, Bismuth-tin-film electrodes for Zn(II), Cd(II), and Pb(II) trace analysis, Microchem. J., 2019, 145, 676–685 CrossRef.
- D. L. Massart, B. G. M. Vandeginste, L. M. C. Buydens, S. De Jong, P. J. Lewi and J. Smeyers-Verbeke, Handbook of Chemometrics and Qualimetrics: Part A, Elsevier, Amsterdam, 1998, vol. 20, pp. 1–867 Search PubMed.
- China Food and Drug Administration, National Food Safety Standard-Determination of Multi-Elements in Food, 2016, pp. 1–14 Search PubMed.
- J. Wang, Ü. A. Kirgöz and J. Lu, Stripping voltammetry with the electrode material acting as a ‘built-in’ internal standard, Electrochem. Commun., 2001, 3, 703–706 CrossRef CAS.
- K. S. Siddegowda and B. Mahesh, Fabrication of copper oxide nanoparticles modified carbon paste electrode and its application in simultaneous electroanalysis of guanine, adenine and thymine, Sens. Actuator, A, 2018, 280, 277–286 CrossRef.
| This journal is © The Royal Society of Chemistry 2024 |

