 Open Access Article
Flexible paper-based Ag dendritic SERS chips for rapid in situ detection of thiram residues on pear skin†
Quan-Doan Mai *a,
Dang Thi Hanh Tranga,
Ngo Thi Loana,
Hanh Nhung Buib,
Nguyen Trung Thanhb,
Ta Ngoc Bachc,
Anh-Tuan Phambd and
Anh-Tuan Le
 *ab
*ab
aPhenikaa University Nano Institute (PHENA), Phenikaa University, Hanoi 12116, Vietnam. E-mail: doan.maiquan@phenikaa-uni.edu.vn; tuan.leanh@phenikaa-uni.edu.vn
bFaculty of Materials Science and Engineering, Phenikaa University, Hanoi 12116, Vietnam
cInstitute of Materials Science (IMS), Vietnam Academy of Science and Technology, 18 Hoang Quoc Viet, Hanoi 10000, Vietnam
dFaculty of Biotechnology, Chemistry and Environmental Engineering, Phenikaa University, Hanoi 12116, Vietnam
First published on 20th November 2024
Abstract
Surface-enhanced Raman scattering (SERS) is a powerful, highly efficient analytical technique capable of providing label-free, non-invasive, rapid, and ultrasensitive molecular detection down to the single-molecule level. Despite its advantages, SERS remains largely confined to laboratory settings due to the complexities of substrate fabrication and challenges in analyzing real-world samples. Developing flexible SERS substrates that achieve both high fabrication efficiency and high sensing performance, while being practical for field applications, is critical for advancing SERS toward broader, real-world use. In this study, we present a novel paper-based Ag dendritic SERS chip, fabricated via a simple chemical reduction process that directly forms Ag dendritic nanostructures on cellulose fibers. This chip substrate demonstrates exceptional sensitivity for the detection of thiram pesticide, with a detection limit as low as 7.76 × 10⁻¹¹ M. The chip substrate also exhibits outstanding reliability, with reproducibility and repeatability both less than 5%. Furthermore, the flexible nature of the paper substrate enables it to conform to curved surfaces and be in direct contact with analytes, exemplified by its ability to adhere to and retrieve thiram from pear skin using a novel “paste-and-peel-off” technique. The substrate shows remarkable performance for thiram detection on pear skin, with sharp recovery rates ranging from 90% to 105%. With its facile fabrication, excellent sensitivity, high reliability, and practical applicability in non-invasive sampling, the paper-based Ag dendritic SERS substrate offers significant potential as an advanced substrate to bring SERS out of the laboratory and closer to real-world applications.
1. Introduction
Surface-enhanced Raman scattering (SERS) sensors play a pivotal role in analytical science as they provide rapid, non-invasive, fingerprint information down to the single-molecule level.1–4 Over the past decades, a vast amount of research has been conducted on SERS across various fields, ranging from analytical chemistry applications such as food safety,5,6 agricultural monitoring,6 and environmental analysis,7 to biomedical uses including biological/medical sensing8 and early diagnosis,9 as well as advanced applications like revealing reaction mechanisms10,11 and surface interactions.11 SERS arises from the interaction of three key components: light, nanostructured materials, and the target molecules.1–3,12 At the core of SERS are nanomaterials, which play a crucial role in amplifying Raman signals from target molecules, primarily utilizing plasmonic materials such as silver (Ag), gold (Au), and copper (Cu).1,3,13 Among these, silver has garnered the most attention due to its superior plasmonic activity, which leads to optimal SERS signal acquisition.3,14 The morphology of Ag nanomaterials is a critical factor, significantly influencing SERS sensing performance,15,16 as it directly determines the plasmonic characteristics and, in particular, the density of “hotspots” – defined as regions of robust electromagnetic fields resulting from the plasmonic coupling of interparticle gaps – where the strongest Raman signal enhancement occurs.14,16,17 Ag dendritic nanostructures have demonstrated the highest SERS sensing performance due to their ability to create a dense array of hotspots.18 Reports indicate that their enhancement factors can reach up to 1011–1013 times,19,20 in contrast to other Ag morphologies, such as spherical or cubic forms, which typically achieve enhancement factors of only 106–108 times.21,22 Consequently, research has increasingly focused on the SERS efficiency of Ag dendritic nanostructures, aiming to streamline fabrication methods while ensuring high reproducibility and sensor efficacy.Recent studies have demonstrated significant advancements in the use of Ag dendritic nanostructures for SERS applications. Gu et al. developed a SERS substrate featuring nanodendritic Ag on a rigid copper base, achieving the detection of rhodamine 6G at an impressive concentration of 3.2 × 10⁻¹¹ M with good reproducibility (∼10%).23 Zhang et al. successfully adhered dendritic Ag nanostructures to a rigid aluminum oxide substrate, obtaining a detection limit for rhodamine 6G as low as 1.0 × 10⁻¹¹ M, with reproducibility below 12%.24 Additionally, Hu et al. enhanced Ag dendritic nanostructures by integrating graphene oxide onto a rigid copper substrate, achieving the detection of rhodamine 6G as low as 1.0 × 10⁻¹¹ M.25 Vendamani et al. also successfully mounted Ag dendritic nanostructures onto rigid silicon substrates, enabling the detection of explosives such as 1,3,5-trinitroperhydro-1,3,5-triazine and ammonium nitrate down to concentrations of 1 × 10⁻⁶ M.26 Despite these impressive advancements, the substrates currently utilized are predominantly rigid materials, including copper, aluminum oxide, and silicon. This limitation constrains the applicability of these SERS substrates in laboratory settings, as the collection of analytes can only be performed by directly depositing analyte solutions onto their surfaces and allowing the solvent to evaporate.
More recently, efforts to extend the utility of SERS tools beyond laboratory settings have led to the innovative replacement of traditional rigid substrates with flexible platforms based on polymers, paper, or tapes.27–29 These flexible SERS substrates, due to their bendable nature, can directly contact the curved surfaces of real samples, facilitating the direct collection of analytes. This approach offers significant advantages in analytical protocols, including non-invasive sampling, rapid analysis, simplicity, and cost-effectiveness, all while ensuring high sensing efficiency.28,29 In 2023, Wang et al. successfully developed an Ag nanoparticle-filter paper-based SERS substrate by directly forming Ag nanoparticles on the surface of filter paper, achieving commendable sensing performance for rhodamine 6G and various bacteria.30 Most recently, in 2024, He et al. successfully employed a wipe sampling method for direct sampling from the surface of apples using a SERS substrate based on paper decorated with Ag nanoparticles. This method achieved a detection efficiency for the pesticide thiabendazole on the apple surface of 0.097 ppm (∼4.2 × 10⁻⁷ M).31 Thus, integrating higher-performing SERS nanostructures, such as Ag dendritic nanostructures, onto flexible substrates like paper could result in an SERS platform that combines exceptional sensing efficiency with the convenience of analytical techniques suitable for field applications.
To fill this gap, in this study, we introduce a novel paper-based Ag dendritic (Paper/Ag-d) SERS substrate, which is fabricated through a simple chemical reduction process that directly forms Ag dendritic nanostructures on cellulose fibers. This substrate not only exhibits outstanding SERS efficiency but is also user-friendly for field analyses. We evaluated three critical sensing parameters – sensitivity, reliability, and practicality – to assess the substrate's feasibility for real-world applications. The results demonstrate that the Paper/Ag-d chips display exceptional sensitivity, achieving a detection limit for thiram as low as 7.76 × 10⁻¹¹ M. Additionally, it exhibits excellent reliability, with both repeatability and reproducibility remaining below 5%. Furthermore, owing to its flexible design, the Paper/Ag-d chips can be easily applied directly to the surfaces of real samples, such as pear skin, facilitating the effective collection of thiram residues. We refer to this advanced analytical technique as “paste and peel-off,” which enables superior sensing performance, yielding sharp recovery rates between 90% and 105%.
2. Materials and methods
2.1. Materials
Precursors and analytes were sourced from Shanghai Chemical Reagent Co., including thiram (C6H12N2S4, 97.0), silver nitrate (AgNO3, ≥99.0%), sodium borohydride (NaBH4, 99%), cetyltrimethylammonium bromide (C19H42NBr, 99.9%), ethanol (C2H5OH, 98%) and used directly without further purification. Commercial filter paper from Whatman with a pore size of 2.7 μm was utilized. Double distilled water was used throughout the experiments.2.2. Fabrication of flexible paper-based Ag dendritic SERS chips
The paper was cut into 1 × 1 cm squares and securely affixed around the inner walls of a 200 mL beaker. Following this, 100 mL of double-distilled water containing 0.1 M cetyltrimethylammonium bromide (CTAB) was added and stirred for 1 hour to achieve thorough mixing. Next, 100 mg of silver nitrate (AgNO3) was introduced into the reaction vessel and stirred for an additional hour to ensure proper dispersion and interaction with the filter paper. A sufficient amount of sodium borohydride (NaBH4) was then gradually added to the mixture to reduce Ag+ ions, facilitating the formation of silver nanoparticles on the cellulose fibers of the paper. The Ag nanomaterial formation reaction was conducted for 4 hours under continuous magnetic stirring at room temperature. Upon completion, the paper's surface exhibited a light brown color, and the substrate was washed three times with double distilled water to remove any residual precursors. The material was then dried at room temperature, resulting in the production of the Paper/Ag-d chips. The fabrication process for the Paper/Ag-d chips takes approximately 8 hours in total. The morphology and distribution of the Ag nanomaterials on the paper surface were characterized using field emission scanning electron microscopy (FE-SEM, Hitachi S-4800), operated at an acceleration voltage of 5 kV. The elemental composition and distribution of the Paper/Ag-d chips were analyzed using Energy-Dispersive X-ray (EDX) spectroscopy and EDX mapping. The Raman signal from the Paper/Ag-d chips was evaluated using Raman spectroscopy (Horiba Macro-RAM™) with excitation from a 785 nm laser.2.3. Sample collection and SERS measurement of thiram in distilled water
A series of standard solutions containing thiram at varying concentrations were prepared to evaluate the sensitivity and reliability of the Paper/Ag-d chips. Specifically, a precise amount of thiram was added to double-distilled water to achieve concentrations ranging from 10−4 to 10−11 M. These solutions were then applied directly onto the Paper/Ag-d chips and allowed to dry at room temperature. SERS spectra were collected from the substrate using a Macro-RAM™ Raman spectrometer (Horiba) with a 785 nm laser excitation source. A 100× objective lens with a numerical aperture of 0.90 was used for the Raman measurements. The laser power was set to 45 mW, and with a 30° contact angle, this produced a diffraction-limited laser spot diameter of 1.1 μm (1.22 λ/NA) and a focal length of 115 nm. Each measurement had an exposure time of 20 seconds with a single accumulation. The final spectrum was obtained after baseline correction, ensuring accurate assessment of thiram concentration on the Paper/Ag-d chips.2.4. “Paste and peel-off” technique to detect thiram on pear skin: sample collection and SERS measurements
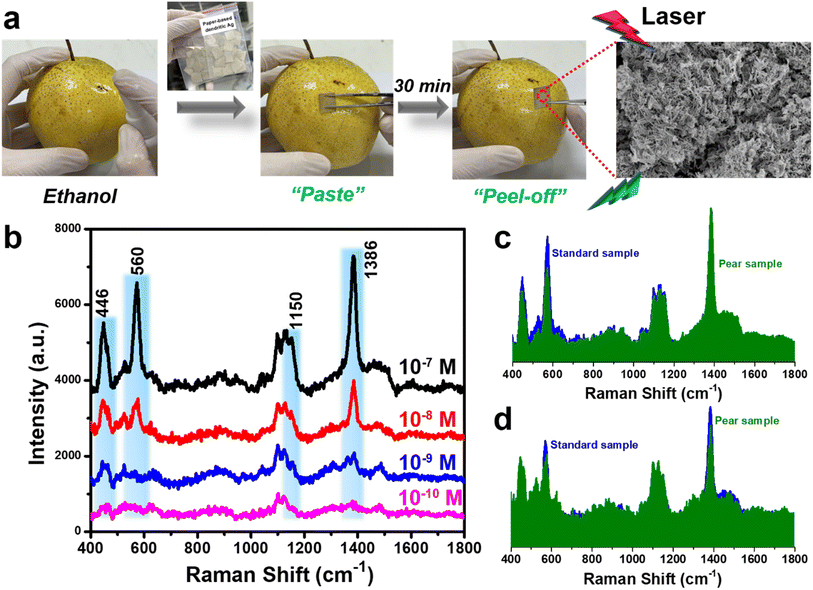
The pears were obtained from local markets in Hanoi, Vietnam, and used directly without any cleaning methods. They were soaked in a thiram solution at varying concentrations for 2 days and then allowed to dry naturally at room temperature. The concentration range of thiram selected for this experiment was 10−7 to 10−10 M. Before analysis, ethanol was sprayed directly onto the surface of the pears to enhance the extraction of thiram. The Paper/Ag-d chips were then affixed to the ethanol-treated area of the pear skin for 30 minutes to facilitate thiram collection. Afterward, the Paper/Ag-d chips were removed, and SERS signals were recorded. This method is referred to as “paste and peel-off”, with SERS measurements conducted according to the procedures outlined in the previous section.3. Results and discussion
3.1. Fabrication of flexible paper-based Ag dendritic chips
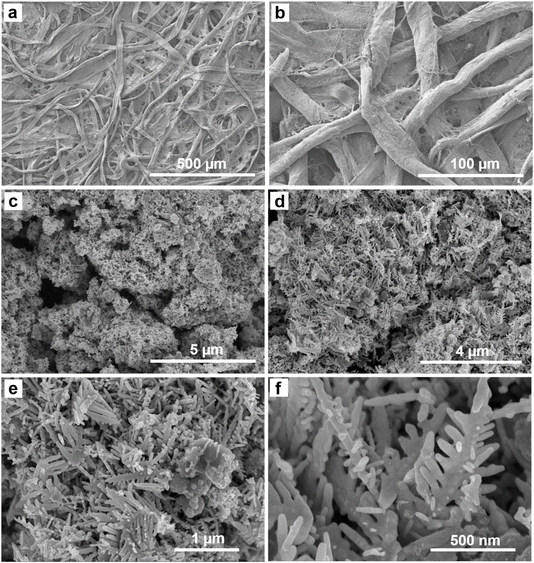
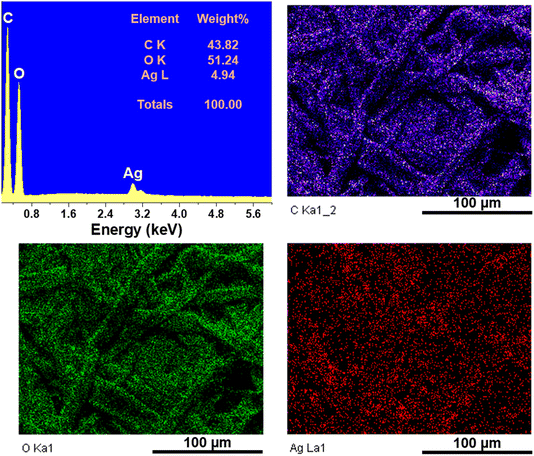
The direct reduction of AgNO3 with NaBH4 in solution, combined with the presence of paper, enables the formation of Ag materials directly on the cellulose fibers. FE-SEM measurements confirm the successful formation, morphology, and distribution of Ag material on the surface of the cellulose fibers (Fig. 1). Fig. 1a and b show the surface of the Paper/Ag-d chips at low magnification, clearly highlighting the fibrous structure of the cellulose. Importantly, no large particles were detected on the surface of the Paper/Ag-d chips. A closer inspection at higher magnification in Fig. 1c–f reveals the presence of dendritic Ag structures, which are evenly distributed and densely arranged. The average size of the Ag branches was calculated from measurements in Fig. 1f by assessing the widths and occurrence frequency of the branches, resulting in an average width of approximately 80 nm (detailed distribution analysis is presented in Fig. S1 in the ESI†). This demonstrates that Ag dendritic nanostructures have been effectively formed directly on the cellulose fibers of the paper. The uniform and dense distribution of these structures may result in a high density of “hotspots” on the Paper/Ag-d chips, which is likely to significantly enhance the SERS performance.Fig. 2 presents the EDX and EDX mapping analysis results for the flexible Paper/Ag-d chips, aimed at evaluating the presence and distribution of Ag material on the cellulose fiber substrate of the paper. The EDX spectrum identifies carbon (C) and oxygen (O) on the flexible Paper/Ag-d chips, representing the cellulose base. Additionally, silver Ag is detected at a content of 4.94%, confirming its presence on the chip surface. No foreign elements were observed, indicating a high purity level of the flexible Paper/Ag-d chips. EDX mapping further illustrates the distribution of carbon and oxygen across the cellulose fibers, while also revealing a uniform dispersion of Ag on the flexible Paper/Ag-d substrate. Together, the EDX and EDX mapping analyses confirm the successful formation and even distribution of Ag on the chips, underscoring the substrate's high purity.
Fig. 3 presents the Raman spectra of the paper substrate, Paper/Ag-d chips, and the SERS spectrum of thiram at a concentration of 10−6 M on the Paper/Ag-d chip, all measured under identical conditions. The paper substrate shows characteristic peaks at 1100 and 1125 cm−1, which are indicative of cellulose bonds.32 While the Raman spectrum of the Paper/Ag-d chips retains these characteristic cellulose peaks, there is a conspicuous absence of extraneous scattering peaks, indicating minimal background noise during the analysis. Importantly, upon introducing thiram to the Paper/Ag-d chips, the spectrum reveals prominent and well-defined scattering peaks. The Raman spectrum of thiram powder was collected to compare with the peaks observed in the spectrum obtained on the Paper/Ag-d chips and is presented in Fig. S2.† The band at 446 cm−1 is assigned to the symmetric stretching vibrations of the C–S–S bond and the bending of the C–N–C bond.33,34 The peak at 560 cm−1 corresponds to the stretching vibrations of the S–S bond and the symmetric stretching of the C–S–S bond in the thiram molecule.33–35 Additionally, the band at 1150 cm−1 is attributed to the rocking vibrations of the CH3 bond and the stretching vibrations of the CH3–N bond.34,35 Finally, the band at 1386 cm−1 is associated with the bending vibrations of the CH3 bond and the stretching vibrations of the C–N bond.35 Detailed information on the characteristic peaks of the Raman signal from the powder and the SERS signal from the Paper/Ag-d chips for thiram is shown in Table S1.† Moreover, two peaks at 1093 and 1127 cm−1 are characteristic of cellulose; however, their weak intensity does not interfere with the prominent scattering peaks of thiram. Thus, the Paper/Ag-d chips demonstrate a robust capability for effectively detecting thiram through the clear presence of its characteristic peaks.
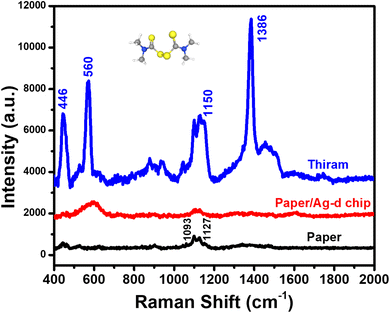 | ||
| Fig. 3 Raman spectra of the paper substrate, Paper/Ag-d chips, and the SERS spectrum of the thiram analyte on the Paper/Ag-d chips. | ||
3.2. Flexible paper/Ag-d SERS chips for detection of standard thiram solution
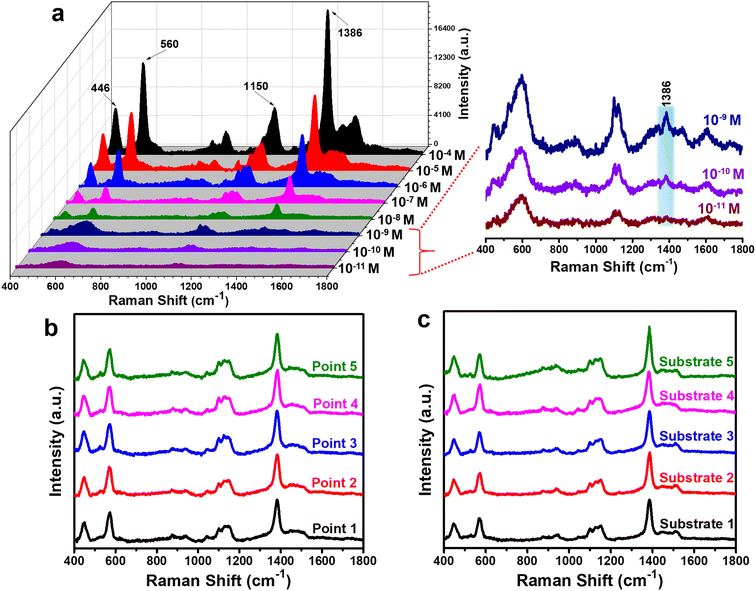
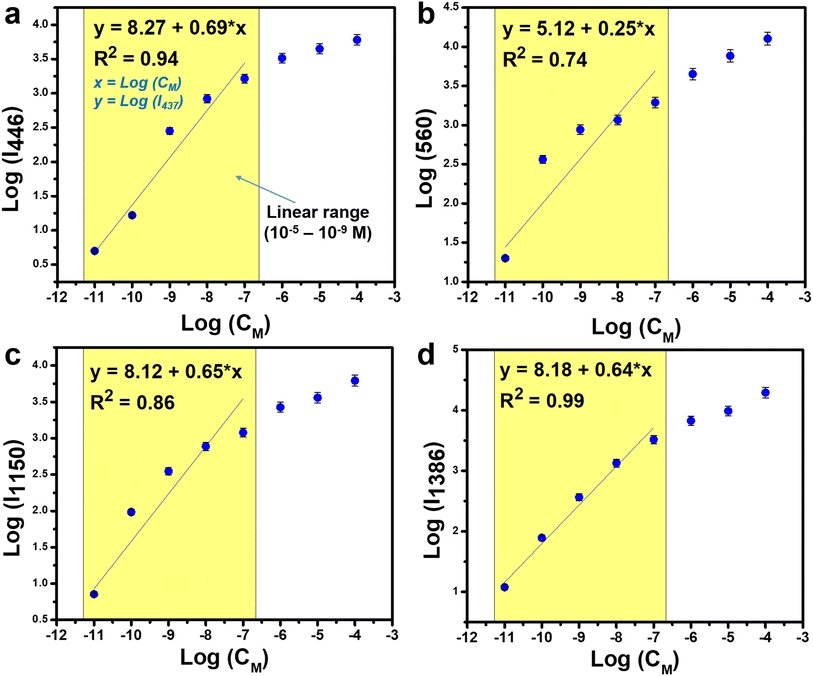
Thiram is a pesticide belonging to the dithiocarbamate group, commonly employed as a fungicide to protect crops, particularly fruits, vegetables, and seeds, from various diseases. Although effective in controlling fungal pathogens, the presence of thiram residues in food poses significant health risks to humans. Prolonged accumulation of thiram in the body, due to the consumption of food with residues exceeding permissible limits, can lead to serious health issues, including liver, kidney, and neurological disorders.36,37 Consequently, many countries have established stringent regulations governing the maximum allowable residue levels of thiram in food to ensure consumer safety. The maximum residue levels for thiram in various fruits typically range from 0.01 to 5 ppm (4.16 × 10⁻⁸ to 2.08 × 10⁻⁵ M).38 However, accurately detecting such low concentrations in real samples presents considerable challenges when employing SERS techniques. In this regard, SERS must simultaneously fulfill several critical parameters, including high sensitivity, high reliability, and excellent practicality. Building on the successful development of Paper/Ag-d chips, which feature a dense and uniform distribution of Ag dendritic nanostructures on the cellulose fibers, this SERS substrate offers not only high sensitivity but also convenient analysis due to the flexibility of the paper medium. As a result, it has been utilized to demonstrate comprehensive sensing capabilities for the target analyte, thiram.The sensitivity of Paper/Ag-d SERS chips was evaluated through experiments detecting thiram in standard solutions comprising distilled water and thiram at concentrations ranging from 10−4 to 10−11 M. The results are illustrated in Fig. 4a. At a concentration of 10−4 M, the characteristic peaks for thiram appear sharply with high intensity. As the concentration of thiram decreases, the characteristic peaks gradually diminish while remaining at their respective scattering positions. Notably, at the very low concentration of 10−10 M, the peak at 1386 cm−1 is still detectable (see the inset in Fig. 4a) and disappears completely only at a concentration of 10−11 M. Quantitatively, important parameters of the SERS sensor, including the limit of detection (LOD), linear range, and linear equation, were determined based on the relationship between thiram concentration and the corresponding SERS intensity. The results are presented in Fig. 4. In Fig. 5a, we depict the logarithmic relationship between the concentration range of thiram (10−4 to 10−11 M) and SERS intensity at the 446 cm−1 peak. Similarly, the logarithmic relationships between the concentration of thiram and SERS intensities at 560 cm−1, 1150 cm−1, and 1386 cm−1 are shown in Fig. 5b–d, respectively. It is evident that the relationship between concentration and intensity shows the highest linearity at the peak of 1386 cm−1, with a linear correlation coefficient reaching 0.99, while the other peaks range from 0.74 to 0.94. The linear range is determined to be between 10−7 and 10−11 M. The linear equation is expressed as y = 8.18 + 0.64x, where x and y represent the logarithmic functions of thiram concentration and SERS intensity, respectively. Based on the derived linear equation, the LOD value of the Paper/Ag-d chip substrate is calculated to be 7.76 × 10⁻¹¹ M (detailed information on the LOD calculation is provided in the ESI†). Thus, the sensitivity of Paper/Ag-d chips for thiram detection far exceeds the allowable maximum concentration limits for thiram in food, which range from 4.16 × 10⁻⁸ to 2.08 × 10⁻⁵ M. With such remarkable sensitivity, the enhancement factor (EF) of the Paper/Ag-d chips was also calculated at a concentration of 10−10 M, yielding a result of 1.55 × 10⁸, a notably high value for a flexible SERS substrate (detailed information on the EF calculation is provided in the ESI,† where the 1386 cm−1 peak was selected for the calculation due to its weak Raman signal observed in the thiram powder sample, while demonstrating the strongest enhancement in the SERS spectrum). This high EF is attributed to the Ag dendritic structures, where Ag branches uniformly grow from the Ag core, creating a dense array of hotspots not only among themselves but also between branches from multiple cores. Table 1 compares the LOD and EF values of the Paper/Ag-d chips with traditional rigid SERS substrates and emerging flexible SERS platforms for thiram detection. Rigid substrates made from metals or metal oxides are renowned for their high enhancement factors due to electromagnetic field interactions in addition to the substrate material. Two complex nanostructures, multi-branched gold nanostars39 and Au@Ag nanocuboids40 on rigid substrates, demonstrate thiram detection limits of 1.0 × 10⁻¹⁰ M and 8.0 × 10⁻¹¹ M, respectively, with EF values of 1.04 × 10⁵ and 2.72 × 10⁸. Despite the Paper/Ag-d chips being flexible and composed of paper (lacking the capacity to create additional electromagnetic interactions between the nanomaterials and the substrate), their enhancement effect and EF are comparable, even superior, to those of rigid SERS substrates based on complex nanostructures. This highlights the efficacy of fabricating Ag dendritic nanostructures on the paper substrate. Furthermore, when compared to other flexible substrates for thiram detection, the Paper/Ag-d chips exhibit superior performance in both LOD and EF values. Therefore, not only do they offer a simple and rapid fabrication method with flexible usability, but the Paper/Ag-d chips also demonstrate exceptional sensitivity.
| Substrate | Type of substrate | LOD value | EF value | Ref. |
|---|---|---|---|---|
| Multi-branched gold nanostars | Rigid | 1.0 × 10⁻¹⁰ M | 1.04 × 10⁵ | 39 |
| Au@Ag nanocuboids (NBs) | Rigid | 8.0 × 10⁻¹¹ M | 2.72 × 10⁸ | 40 |
| AgNPs paper-based substrate | Flexible | 0.024 ppm (∼9.98 × 10⁻⁸ M) | 4.02 × 10⁵ | 41 |
| Ag/Au/ZnO/PVDF | Flexible | ∼1.0 × 10⁻¹⁰ M | 7.09 × 10⁷ | 42 |
| Paper-based Ag dendritic chips | Flexible | 7.76 × 10⁻¹¹ M | 1.55 × 10⁸ | This work |
The reliability of the Paper/Ag-d chips was evaluated based on the parameters of repeatability and reproducibility. Given that the Paper/Ag-d chips are fabricated with dimensions of 1 × 1 cm, assessing the uniformity of the SERS signals obtained from the same substrate is essential. The repeatability is determined by collecting SERS signals from five random points on a single Paper/Ag-d chip while detecting thiram at a concentration of 10−6 M. The results are presented in Fig. 4b, where the characteristic peaks of thiram are observed to appear uniformly in both the scattering positions and intensities across the selected points. Quantitatively, the relative standard deviation (RSD) was calculated to be 3.48%, indicating excellent repeatability of the Paper/Ag-d chips (detailed information on the RSD calculation is provided in the ESI†). The reproducibility is assessed by collecting SERS signals from five Paper/Ag-d chips, each prepared in separate batches following the same protocol (described in Section 2.2) but executed five times, resulting in a total preparation time of about 40 hours. The SERS results for detecting thiram at a concentration of 10−6 M from these chips are displayed in Fig. 4c. The characteristic signals of thiram also show uniformity in both intensity and peak positions. The calculated RSD for reproducibility is 4.66%. Thus, both the repeatability and reproducibility of the Paper/Ag-d chips demonstrate very low RSD values, both below 5%, which indicates a high level of reliability for the Paper/Ag-d chip substrate.
3.3. Flexible paper/Ag-d SERS chips for detection of thiram on pear skin using “paste and peel-off” technique
The practicability of the Paper/Ag-d chip substrate was assessed by its ability to detect thiram on pear skin. This technique leverages the substrate's flexibility, which facilitates bending and ensures prolonged adhesion and direct contact with the sample surface. We refer to this method as “paste and peel-off,” which offers several advantages for field analysis, including non-invasiveness, rapid execution, high accuracy, and minimal interference from the sample matrix. Pear samples were spiked with thiram at concentrations ranging from 10−7 to 10−10 M and were prepared for analysis. To enhance the extraction efficiency of the analyte, ethanol was sprayed directly onto the target area of the pear skin. The Paper/Ag-d chip was then applied (pasted) onto the pre-treated pear skin and held in place for 30 minutes to optimize thiram collection. After this period, the Paper/Ag-d chip was carefully “peeled off” from the pear skin and was subsequently prepared for SERS analysis using a Raman spectrometer. This analytical protocol was consistently repeated for each pear sample containing varying thiram concentrations (Fig. 6a).The detection results of thiram on pear skin using Paper/Ag-d chips are illustrated in Fig. 6b. At a concentration of 10−7 M, the SERS spectra obtained through the “paste and peel-off” technique reveal distinct peaks at 446, 560, 1150, and 1386 cm−1, which are characteristic of thiram. Notably, no interfering peaks from the sample matrix are observed. This is crucial, as interference from unidentified molecules can significantly compromise the desired signal in real sample analyses. This finding underscores the high efficacy of the “paste and peel-off” method utilizing Paper/Ag-d chips for thiram detection. The molecular structure of thiram, which includes multiple sulfur atoms, may enhance its interaction with the dense silver nanoparticles on the Paper/Ag-d chips. Clear signals for thiram are consistently detected across concentrations ranging from 10−8 to 10−10 M. Remarkably, even at the low concentration of 10−10 M, the characteristic peak at 1386 cm−1 remains detectable. By comparing the SERS intensities obtained from pear skin with those from standard solutions, the recovery values can be calculated. Fig. 6c and d present a comparison of the SERS spectra of thiram collected from standard water samples and pear skin. The characteristic peaks for thiram are clearly distinguishable and align closely in both spectra, with similar intensity levels observed. Table 2 provides the recovery values at the two characteristic peaks demonstrating the highest linearity between concentration and intensity – specifically at 446 cm−1 and 1386 cm−1. The recovery values are commendable, ranging from 90% to 105%, indicating the excellent practicality of the Paper/Ag-d chips. Thus, the “paste and peel-off” technique has been successfully applied to analyze thiram on pear skin, leveraging the flexibility and high sensitivity of Paper/Ag-d chips.
| Samples | Spiked (M) | Detected at 446 cm−1 (M) | Recovery at cm−1 (%) | Detected at 1386 cm−1 (M) | Recovery at 1386 cm−1 (%) |
|---|---|---|---|---|---|
| Pear skin | 10−7 | 9.40 × 10⁻⁸ | 94 | 1.05 × 10⁻⁷ | 105 |
| 10−8 | 1.03 × 10⁻⁸ | 103 | 9.12 × 10⁻⁹ | 91 | |
| 10−9 | 9.02 × 10⁻¹⁰ | 90 | 9.44 × 10⁻¹⁰ | 94 | |
| 10−10 | — | — | 9.10 × 10⁻¹¹ | 91 |
4. Conclusions
We have successfully fabricated novel flexible paper-based Ag dendritic chips by uniformly and densely integrating Ag dendritic nanostructures onto the cellulose fibers of a paper filter substrate using a facile one-step reduction method with AgNO3. Three key parameters of the SERS sensor – sensitivity, reliability, and practicality -were evaluated through the detection of the pesticide thiram. The Paper/Ag-d chips exhibited exceptional sensitivity, enabling thiram detection down to concentrations as low as 7.76 × 10⁻¹¹ M, with a significant enhancement factor reaching up to 108. Furthermore, the Paper/Ag-d chips demonstrated excellent reliability, with both repeatability and reproducibility values consistently below 5%. Notably, due to their flexibility, the advanced analytical technique known as “paste and peel-off” was successfully applied to the Paper/Ag-d chips for the detection of thiram on pear skin, yielding sharp recovery values ranging from 90% to 105%. With numerous advantages, including a straightforward and efficient fabrication process, superior sensitivity, outstanding reliability, and excellent practicality, Paper/Ag-d SERS chips show great potential for ultra-sensitive and accurate field analyses, advancing the application of SERS techniques in real-world scenarios.Data availability
Data will be made available on request. The data that support the findings of this study are available from the corresponding author upon reasonable request. All experimental data, including the characterization of the flexible paper-based Ag dendritic SERS chips and the detection results of thiram residues, are included within the manuscript and its ESI.†Author contributions
Q. D. Mai: conceptualization, methodology, investigation, formal Analysis, data curation, supervision, writing – original draft; D. T. H. Trang: formal analysis, investigation, validation; N. T. Loan: validation, investigation; H. N. Thanh: validation, formal analysis, investigation; N. T. Thanh: validation, investigation; A. T. Pham: conceptualization, methodology, formal analysis, supervision, writing – review & editing; A. T. Le: conceptualization, methodology, supervision, project administration, writing – review & editing.Conflicts of interest
The authors declare that they have no known competing financial interests or personal relationships that could have appeared to influence the work reported in this paper.Acknowledgements
This research was acknowledged to the Phenikaa University under grant number PU2023-2-A-03 & A&A Green Phoenix Group JSC through Financial Supports for Key Research Group (NEB Lab). The authors would like to acknowledge the supports for Raman measurements from NEB Lab (Phenikaa University) and FE-SEM measurement from IMS-VAST.References
- X. X. Han, R. S. Rodriguez, C. L. Haynes, Y. Ozaki and B. Zhao, Surface-enhanced Raman spectroscopy, Nat. Rev. Methods Primers, 2021, 1(1), 87 CrossRef CAS.
- J. Langer, D. Jimenez de Aberasturi, J. Aizpurua, R. A. Alvarez-Puebla, B. Auguié and J. J. Baumberg, et al., Present and future of surface-enhanced Raman scattering, ACS Nano, 2019, 14(1), 28–117 CrossRef PubMed.
- B. Sharma, R. R. Frontiera, A.-I. Henry, E. Ringe and R. P. Van Duyne, SERS: Materials, applications, and the future, Mater. Today, 2012, 15(1–2), 16–25 CrossRef CAS.
- S. Nie and S. R. Emory, Probing single molecules and single nanoparticles by surface-enhanced Raman scattering, science, 1997, 275(5303), 1102–1106 CrossRef CAS PubMed.
- H. Li, E. Dumont, R. Slipets, T. Thersleff, A. Boisen and G. A. Sotiriou, Democratizing robust SERS nano-sensors for food safety diagnostics, Chem. Eng. J., 2023, 470, 144023 CrossRef CAS.
- C. Liu, D. Xu, X. Dong and Q. Huang, A review: Research progress of SERS-based sensors for agricultural applications, Trends Food Sci. Technol., 2022, 128, 90–101 CrossRef CAS.
- R. A. Halvorson and P. J. Vikesland, Surface-enhanced Raman spectroscopy (SERS) for environmental analyses, Environ. Sci. Technol., 2010, 44(20), 7749–7755 CrossRef CAS PubMed.
- S. Zeng, D. Baillargeat, H.-P. Ho and K.-T. Yong, Nanomaterials enhanced surface plasmon resonance for biological and chemical sensing applications, Chem. Soc. Rev., 2014, 43(10), 3426–3452 RSC.
- S. Lee, H. Dang, J.-I. Moon, K. Kim, Y. Joung and S. Park, et al., SERS-based microdevices for use as in vitro diagnostic biosensors, Chem. Soc. Rev., 2024, 53, 5394–5427 RSC.
- C.-Y. Li and Z.-Q. Tian, Sixty years of electrochemical optical spectroscopy: a retrospective, Chem. Soc. Rev., 2024, 53, 3579–3605 RSC.
- X. Chen, X.-T. Wang, J.-B. Le, S.-M. Li, X. Wang and Y.-J. Zhang, et al., Revealing the role of interfacial water and key intermediates at ruthenium surfaces in the alkaline hydrogen evolution reaction, Nat. Commun., 2023, 14(1), 5289 CrossRef CAS PubMed.
- S.-Y. Ding, J. Yi, J.-F. Li, B. Ren, D.-Y. Wu and R. Panneerselvam, et al., Nanostructure-based plasmon-enhanced Raman spectroscopy for surface analysis of materials, Nat. Rev. Mater., 2016, 1(6), 1–16 Search PubMed.
- D. Graham, M. Moskovits and Z.-Q. Tian, SERS–facts, figures and the future, Chem. Soc. Rev., 2017, 46(13), 3864–3865 RSC.
- S.-Y. Ding, E.-M. You, Z.-Q. Tian and M. Moskovits, Electromagnetic theories of surface-enhanced Raman spectroscopy, Chem. Soc. Rev., 2017, 46(13), 4042–4076 RSC.
- T. Y. Jeon, S.-G. Park, S. Y. Lee, H. C. Jeon and S.-M. Yang, Shape control of Ag nanostructures for practical SERS substrates, ACS Appl. Mater. Interfaces, 2013, 5(2), 243–248 CrossRef PubMed.
- H. Li, P. Merkl, J. Sommertune, T. Thersleff and G. A. Sotiriou, SERS Hotspot engineering by aerosol self-assembly of plasmonic Ag nanoaggregates with tunable interparticle distance, Advanced Science, 2022, 9(22), 2201133 CrossRef CAS PubMed.
- H. Yockell-Lelièvre, F. Lussier and J.-F. Masson, Influence of the particle shape and density of self-assembled gold nanoparticle sensors on LSPR and SERS, J. Phys. Chem. C, 2015, 119(51), 28577–28585 CrossRef.
- T. Qiu, Y. Zhou, J. Li, W. Zhang, X. Lang and T. Cui, et al., Hot spots in highly Raman-enhancing silver nano-dendrites, J. Phys. D: Appl. Phys., 2009, 42(17), 175403 CrossRef.
- H. Li, P. Liu, Y. Liang, J. Xiao and G. Yang, Super-SERS-active and highly effective antimicrobial Ag nanodendrites, Nanoscale, 2012, 4(16), 5082–5091 RSC.
- Z. Cheng, Z. Li, J. Xu, R. Yao, Z. Li and S. Liang, et al., Morphology-controlled fabrication of large-scale dendritic silver nanostructures for catalysis and SERS applications, Nanoscale Res. Lett., 2019, 14, 1–7 CrossRef CAS PubMed.
- J. Kumar, A. Jinachandran, V. K. Ponnusamy, G. G. Huang, A. K. Suresh and H. Noothalapati, et al., Ag nanoparticle-embedded fish scales as SERS substrates for sensitive detection of forever chemical in real samples, Appl. Surf. Sci., 2024, 674, 160961 CrossRef CAS.
- L. Liu, Y. Wu, N. Yin, H. Zhang and H. Ma, Silver nanocubes with high SERS performance, J. Quant. Spectrosc. Radiat. Transfer, 2020, 240, 106682 CrossRef CAS.
- G. Hai-Xin, X. Lin, Z. Yong-Feng, L. Da-Wei and L. Yi-Tao, Facile Fabrication of a Silver Dendrite-Integrated Chip for Surface-Enhanced Raman Scattering, ACS Appl. Mater. Interfaces, 2015, 7, 2931–2936 CrossRef PubMed.
- C.-y Zhang, Y. Lu, B. Zhao, Y.-w Hao and Y.-q Liu, Facile fabrication of Ag dendrite-integrated anodic aluminum oxide membrane as effective three-dimensional SERS substrate, Appl. Surf. Sci., 2016, 377, 167–173 CrossRef CAS.
- L. Hu, Y. J. Liu, Y. Han, P. Chen, C. Zhang and C. Li, et al., Graphene oxide-decorated silver dendrites for high-performance surface-enhanced Raman scattering applications, J. Mater. Chem. C, 2017, 5(16), 3908–3915 RSC.
- V. Vendamani, S. Rao, A. Pathak and V. Soma, Robust and cost-effective silver dendritic nanostructures for SERS-based trace detection of RDX and ammonium nitrate, RSC Adv., 2020, 10, 44747–44755 RSC.
- K. Xu, R. Zhou, K. Takei and M. Hong, Toward flexible surface-enhanced Raman scattering (SERS) sensors for point-of-care diagnostics, Advanced Science, 2019, 6(16), 1900925 CrossRef PubMed.
- Z. Li, X. Huang and G. Lu, Recent developments of flexible and transparent SERS substrates, J. Mater. Chem. C, 2020, 8(12), 3956–3969 RSC.
- L. Xie, H. Zeng, J. Zhu, Z. Zhang, H.-b Sun and W. Xia, et al., State of the art in flexible SERS sensors toward label-free and onsite detection: from design to applications, Nano Res., 2022, 15(5), 4374–4394 CrossRef.
- R. Wang and J. Luo, Ag NP-filter paper based SERS sensor coupled with multivariate analysis for rapid identification of bacteria, RSC Adv., 2023, 13(1), 499–505 RSC.
- Z.-H. He, W.-W. Zhu, Y.-L. Jiang, S.-S. Zhao, J. Yan and X.-C. Tan, Green synthesis of paper-based SERS substrate for the quantitative detection of thiabendazole by wipe sampling, Microchem. J., 2024, 197, 109729 CrossRef CAS.
- J. H. Wiley and R. H. Atalla, Band assignments in the Raman spectra of celluloses, Carbohydr. Res., 1987, 160, 113–129 CrossRef CAS.
- J.-S. Kang, S.-Y. Hwang, C.-J. Lee and M.-S. Lee, SERS of dithiocarbamate pesticides adsorbed on silver surface; Thiram, Bull. Korean Chem. Soc., 2002, 23(11), 1604–1610 CrossRef CAS.
- M. J. Oliveira, C. S. Martin, R. J. Rubira, A. Batagin-Neto, C. J. Constantino and R. F. Aroca, Surface-enhanced Raman scattering of thiram: quantitative and theoretical analyses, J. Raman Spectrosc., 2021, 52(12), 2557–2571 CrossRef CAS.
- S. Sanchez-Cortes, C. Domingo, J. García-Ramos and J. Aznárez, Surface-enhanced vibrational study (SEIR and SERS) of dithiocarbamate pesticides on gold films, Langmuir, 2001, 17(4), 1157–1162 CrossRef CAS PubMed.
- K. Liu, Y. Li, M. Iqbal, Z. Tang and H. Zhang, Thiram exposure in environment: A critical review on cytotoxicity, Chemosphere, 2022, 295, 133928 CrossRef CAS PubMed.
- C. Cereser, S. Boget, P. Parvaz and A. Revol, An evaluation of thiram toxicity on cultured human skin fibroblasts, Toxicology, 2001, 162(2), 89–101 CrossRef CAS PubMed.
- E. F. S. Authority, M. Anastassiadou, G. Bernasconi, A. Brancato, L. C. Cabrera and L. Ferreira, et al., Review of the existing maximum residue levels for thiram according to Article 12 of Regulation (EC) No 396/2005, EFSA J., 2021, 19(1), e06391 Search PubMed.
- J. Zhu, M.-J. Liu, J.-J. Li, X. Li and J.-W. Zhao, Multi-branched gold nanostars with fractal structure for SERS detection of the pesticide thiram, Spectrochim. Acta, Part A, 2018, 189, 586–593 CrossRef CAS PubMed.
- P. Guo, D. Sikdar, X. Huang, K. J. Si, W. Xiong and S. Gong, et al., Plasmonic core–shell nanoparticles for SERS detection of the pesticide thiram: size-and shape-dependent Raman enhancement, Nanoscale, 2015, 7(7), 2862–2868 RSC.
- N. C. Martins, S. Fateixa, H. I. Nogueira and T. Trindade, Surface-enhanced Raman scattering detection of thiram and ciprofloxacin using chitosan–silver coated paper substrates, Analyst, 2024, 149(1), 244–253 RSC.
- Y. Shi, Y. Zhu, J. Sun, H. Yin and J. Yin, SERS detection of thiram using a 3D sea cucumber-like composite flexible porous substrate, Analyst, 2024, 149, 5041–5051 RSC.
Footnote |
| † Electronic supplementary information (ESI) available. See DOI: https://doi.org/10.1039/d4ra07061e |
| This journal is © The Royal Society of Chemistry 2024 |

