 Open Access Article
The effect of coherent twin boundary migration on the deformation mechanism of Fe–Ni nanowires: molecular dynamics simulation
Wenchao Shi a,
Jun Cai*a,
Yong Zhangb and
Junping Linb
aSchool of Nuclear Science and Engineering, North China Electric Power University, Beijing 102206, China. E-mail: ncepunse@163.com
bState Key Laboratory of Advanced Metal Materials, University of Science & Technology Beijing, Beijing 102206, China
First published on 27th November 2024
Abstract
Fe–Ni nanowires (NWs) containing coherent twin boundaries (CTBs) have received widespread attention in recent years owing to their unique chemical properties. It is important to understand the influence of CTBs on the deformation mechanism of Fe–Ni alloy NWs to develop functional materials based on Fe–Ni alloy NWs. The deformation process of BCC Fe–Ni NWs containing several CTBs under uniaxial stretching was simulated using the molecular dynamics method. It is shown that the NWs of CTBs exhibit two deformation mechanisms under uniaxial stretching. The first mechanism shows that CTB migrates and then completely merges and disappears after yielding the NWs. In this case, if dislocations occur, only few dislocation lines are generated. During the stretching process, the potential energy of atoms within grains increases slowly, while the potential energy of atoms on the CTB increases rapidly. Thus, the whole CTB has a huge activation energy, which leads to its migration. The second mechanism is that during deformation, CTBs of NWs do not migrate. In this case, the potential energy of almost all atoms in the NWs increases. Thus, the local energy of the NWs jumps to a higher level. The higher local energy changes their structure near the CTB from the BCC phase to amorphous structural phases, and the nucleations of deformation twins and those of dislocation lines occur in these regions. Furthermore, the twins and dislocations grow within the grains. These grown twins and dislocations impede the migration of CTB. These findings are beneficial for the better application of alloy nanowires containing coherent twin boundaries.
1. Introduction
Alloy nanowires (NWs) play a pivotal role in the field of chemical catalysis and exhibit extensive applications in various domains, including electronic devices, sensors, optical components, energy conversion and storage materials, as well as biomedical materials.1–5 In order to better use this material, it is crucial to study its mechanical properties. Owing to their special magnetic and chemical properties, alloy NWs containing coherent twin boundaries (CTBs) have attracted increasing attention.6 Compared with common high-angle grain boundaries, CTBs not only have lower energy but also belong to distortion-free boundaries, which make CTBs common in metals.7,8 It is generally believed that twins increase the strength of crystals, but some studies have suggested that twin boundaries can weaken the mechanical properties of crystals in body-centered cubic metals.9,10 The effect of CTBs on the mechanical properties of alloy nanowires is different from that of a macro alloy block. In order to better understand the influence of CTBs on the mechanical properties of NWs, a variety of devices have been used experimentally to characterize the influence of twins on their mechanical properties.10 However, the extremely small size and complex application environment of NWs make their experimental evaluation challenging. Molecular dynamics and Monte Carlo simulations can provide atomic-level microscopic insights into the mechanical properties of nanoscale alloys. In fact, molecular dynamics simulations have been widely used to study the elastic modulus, deformation mechanism, and failure behavior of metal nanowires, such as Fe–Ni NWs, Ni–Co NWs, and Nb NWs.11–13 Previous theoretical studies of nanowires have shown that the deformation mechanism depends on the orientation of the nanowire crystals. Sainath et al. found that nanowires with <100>, <112> and <102> orientations deform mainly through the twin mechanism, while nanowires with <110> and <111> orientations deform via dislocation sliding.14 Li et al. used molecular dynamics to study the mechanical properties and deformation mechanism of Fe–Cu–Ni ternary alloys, and they found that temperature and impurity atoms played an important role in the deformation mechanism of the alloys.15 To our knowledge, there is currently no research on the deformation mechanism of Fe–Ni–BCC-NWs containing multiple CTBs under tensile loading. Herein, we studied the mechanical properties of BCC–Fe–Ni NWs by molecular dynamics. We employed molecular dynamics simulations with varying Ni atomic ratios and simulation temperatures to investigate the similarities and differences in the deformation mechanisms of Fe–Ni NWs containing different numbers of CTBs under tensile loading.2. Theory and methods
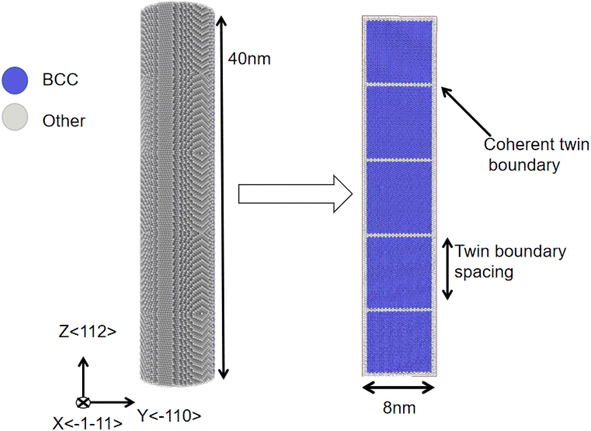
A large-scale parallel atomic/molecular simulator (LAMMPS16) was used to simulate the tensile mechanical properties of the BCC Fe–Ni alloy NW. The NW comprises cylindrical lines with a cross-section diameter of 8.0 nm and a length of 40 nm. The NW contains several layers of CTBs that are equidistant and parallel. The nanowire was constructed using a method similar to that from Li et al.11 and Deng et al.,17 and is shown in Fig. 1. We utilized Atomsk to construct a rectangular BCC Fe crystal model containing CTBs without Ni doping. Subsequently, LAMMPS was employed to carve out a cylindrical NW.16 As a typical example, Fig. 1 shows the NW with 4 layers of CTBs perpendicular to the <112> direction of the Z-axis. The X-axis and Y-axis are along the <−1−11> and <−110> directions, respectively. The NWs are stretched along the Z-axis. The periodic boundary condition is added along the Z-axis, and the other two directions in the NWs were kept free. We simulated the stretching process of the Fe–Ni alloy NWs including 0–10 CTBs. Ni atom contents of 1.5% and 8.5% were adopted. We simulated the structure of 1000 randomly doped Ni atoms via MD using the model with the energy minimum for subsequent MD simulations.The interactions between atoms in the Fe–Ni alloy NW were investigated using the embedded atom method potential by Bonny et al.18 This potential function has been successfully used to study the solid–liquid interface energy of crystal Fe,19 the interactions between the asymmetric dislocation and planar fault in Fe–Ni alloys,20 the crystallization mechanisms of the rapidly supercooled Fe–Ni alloys,21 irradiation damage in the Fe–Ni alloy,22 and the atomic diffusion between different phase boundaries in the Fe–Ni alloy.23 Li et al. used the potential to simulate the deformation process of Fe–Ni alloy NWs not containing CTBs under a stretching load.11 They found that a large number of dislocations and deformation twins are produced in the NW.11 In the present simulation, we consider an Fe–Ni alloy NW that contains CTBs. A Nose Hoover-type thermostat for temperature control is used.24 The steps for the simulations are as follows: Firstly, the conjugate gradient method is used to minimize the energy of the system at the temperature of 0 K. Then, an NPT ensemble is implemented to simulate the micro-structure evolution of the system at some temperature. The system was equilibrated by running for 100![[thin space (1/6-em)]](https://www.rsc.org/images/entities/char_2009.gif) 000 time steps, at which point the model had reached an energy-optimized state. Subsequently, an NVT ensemble is used to simulate the stretching process of the NW system along the Z-axis at a strain rate of 3.0 × 10⁸ s−1. Dislocation extraction analysis (DXA) in OVITO software is used to observe the evolution of the dislocations and crystal structure of the NW.25
000 time steps, at which point the model had reached an energy-optimized state. Subsequently, an NVT ensemble is used to simulate the stretching process of the NW system along the Z-axis at a strain rate of 3.0 × 10⁸ s−1. Dislocation extraction analysis (DXA) in OVITO software is used to observe the evolution of the dislocations and crystal structure of the NW.25
3. Results and discussions
3.1 Effects of the CTBs layers, temperature, and Ni concentration on the tensile mechanical properties of the Fe–Ni alloy NW
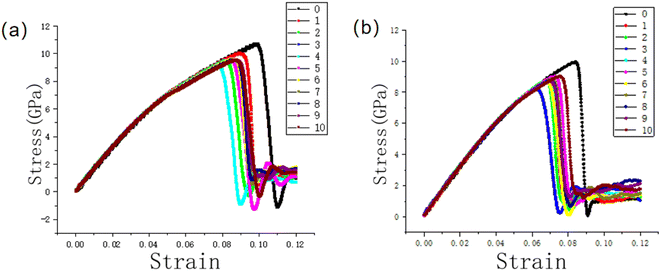
We simulated the stretching process of the Fe–Ni alloy NW. The Ni content of the NW includes two kinds of concentrations at 1.5% and 8.5%. The NWs are stretched under four different temperatures of 100 K, 300 K, 600 K, and 900 K. To reduce the impact of the thermal vibration, Fig. 2 shows the stress–strain curves of the NW containing (a) 1.5% and (b) 8.5% Ni under a stretching load at the temperature of 100 K, and the curve IDs represent the number of CTB layers. From the figure, it can be seen that the stress–strain curves of the Fe–Ni NWs containing different CTB layers exhibit similar shapes under the two kinds of doping levels. If the strain is less than 4% for the NW with two kinds of doping contents, the stress increases linearly with the strain. If the strain is greater than 8% for the NW with 1.5% Ni atoms, the NW begins to yield and then its strength drops rapidly. If the strain is greater than 6% for the NW with 8.5% Ni atoms, the NW also begins to yield and then its strength rapidly decreases. The NW not containing CTBs poses the highest yield stress among the NWs with Ni contents of 1.5% and 8.5% under the tensile loading at the temperature of 100 K. Cui et al. simulated the deformation process of BCC W NWs under tensile loading, together with experimental studies, and found that the twin reduces the yield strength of the W NWs.9We calculated the ratio of stress to strain to obtain the Young's moduli of the NWs from its stress–strain curve at its linear region (strain of 0–0.4). The Young's modulus of the NWs with 1.5% and 8.5% Ni atom contents (and not containing CTB) is calculated to be 156 GPa and 150 GPa, respectively. From Fig. 2(a and b), it can be observed intuitively that the stress–strain curves of all the NWs almost overlap each other in their linear region of strain at less than 0.04 for the NWs, regardless of whether they contain CTBs. This indicates that the Young's modulus of the NWs remains almost unchanged with the variation in the number of CTBs. In FCC Ni–Co NW, a similar conclusion was also obtained,12 i.e., CTBs have almost no effect on the Young's modulus of FCC NW. From Fig. 2, it is also seen that the NWs with 8.5% Ni atom content have lower yield stress than the NWs with 1.5% Ni atom content. Li performed simulations for the tensile Fe–Ni alloy NWs, and found a lower yield strength of the NWs with higher Ni concentration of the Fe–Ni alloy NWs.8
We calculated the yield stress of the NWs at the temperatures of 100 K, 300 K, 600 K, and 900 K. The yield stress curves of NW containing 1.5% and 8.5% Ni atoms as a function of temperature are shown in Fig. 3. Fig. 3(a) corresponds to the NW containing 1.5% Ni atoms, and (b) corresponds to those containing 8.5% Ni. From Fig. 3, it also can be seen that the NWs with 8.5% Ni atom content have lower yield stress than the ones with 1.5% Ni atom content. From the figure, it can be seen that for NWs containing 1.5% Ni atoms, the presence of CTBs significantly reduces the yield stress of the NW. At 100 K, the NWs containing 8.5% Ni also showed similar results. However, in the NW containing 8.5% Ni atoms, the influence of CTBs on the NW yield stress is relatively small. At 600 K, CTB has little effect on the yield stress of Fe–Ni NW with 1.5% and 8.5 Ni atoms. At 900 K, it was found that the yield stress of NW is almost independent of the number of layers of CTBs. To further understand the deformation mechanism of the Fe–Ni alloy NWs with 0–10 CTBs, we focus on the NW structure at the lower temperatures of 100 K and 300 K because of the influence of thermal vibration on the NW structure at temperatures greater than 300 K.
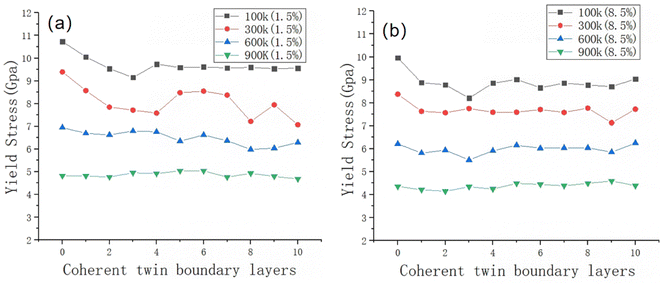 | ||
| Fig. 3 Yield stress of NWs as a function of the number of CTBs layers at different temperatures (a) for NWs with 1.5% Ni atom content and (b) for NWs with 8.5% Ni atom content. | ||
3.2 Tensile deformation mechanism of the Fe–Ni alloy NW where CTBs do not migrate
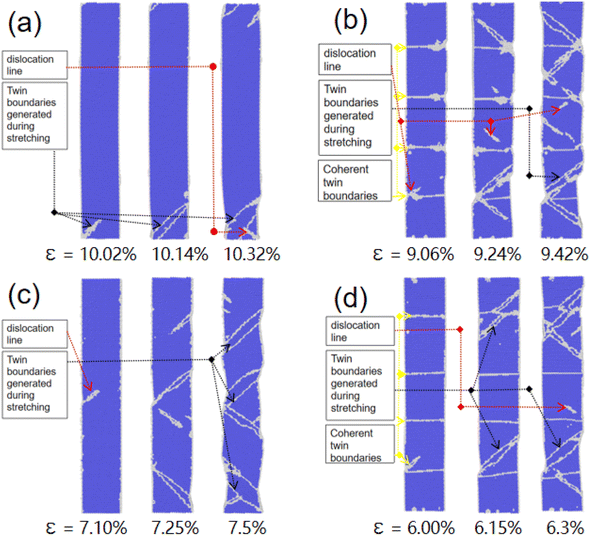
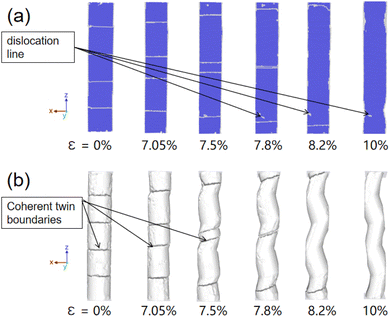
Simulations show that two phenomena occur during the stretching process of the NWs. One phenomenon involves the NWs where CTBs do not migrate, and the other one involves the NWs where they do migrate. Fig. 4 shows the atomic snapshots for the Fe–Ni alloy NWs containing 1.5% and 8.5% Ni atoms during the stretching process at 100 K temperature. The project planes are the (100) face, and (a and c) correspond to the 1.5% and 8.5% Ni atom CTBs-free NWs, respectively, and (b and d) correspond to the NWs with four CTB layers. From Fig. 4, it can be seen that a large number of deformation twins and a small amount of 1/2 <112> Shockley dislocation lines are produced in the NWs, whether or not they contain CTBs. Sainath et al. performed a theoretical simulation for the tensile BCC Fe alloy NW without CTBs. They found that the NW produces a deformation by twinning deformation and dislocation slip.14 The deformation mechanism of the NW along the <112> direction from Sainath et al. is consistent with the present results.In Fig. 4, the black and red arrows indicate the deformation twins and 1/2 <112>Shockley dislocation lines, respectively. In the figure, the yield of the NWs occurs at the strain of 10.02%, 9.06%, 7.10%, and 6.00%, respectively. For the CTB-free NWs containing fewer Ni atoms (1.5%), it is seen that the dislocation lines occur first at the junction of the outer surface and ending bottom of the NW (see the leftmost part of Fig. 4(a)). With consistent stretching of the NW, the deformation twins are also generated on its outer surface (see the rightmost of Fig. 4(a)). For the fewer Ni atoms NWs containing 4 CTB layers, it is found that the 1/2 <112> Shockley dislocation line first occurs on its CTBs (see the leftmost part of Fig. 4(b)). Upon further stretching the NW, more deformation twins and 1/2 <112> Shockley dislocation lines occur on the CTBs of the NW (see the middle and rightmost parts of Fig. 4(b)). For more Ni atoms (8.5%) NW that are CTBs-free, dislocation lines are firstly generated on the outer surface (see the leftmost part of Fig. 4(c)), and then twins are produced on its outer surface (see the middle and rightmost parts of Fig. 4(c)). For the NW containing 4 CTBs and more Ni atoms, deformation twins first occur on its CTB. Upon further stretching the NW, more deformation twins and 1/2 <112> Shockley dislocation lines occur on its CTBs, and the part of CTB is disrupted by the deformation twins (see the far right side of Fig. 4(d)).
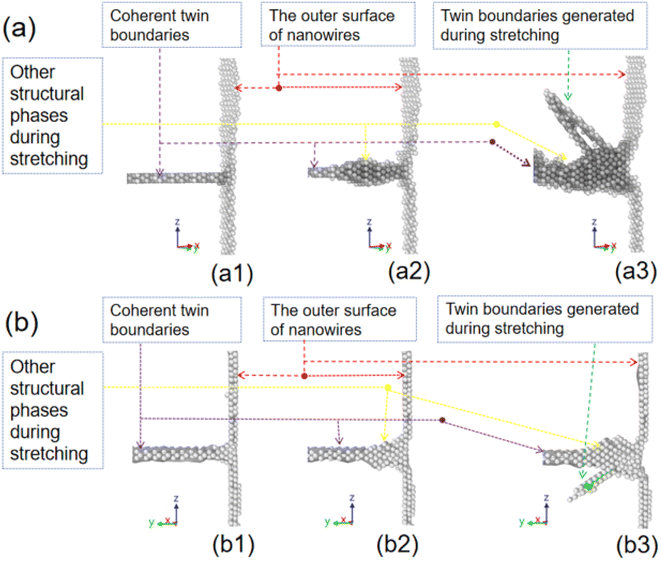
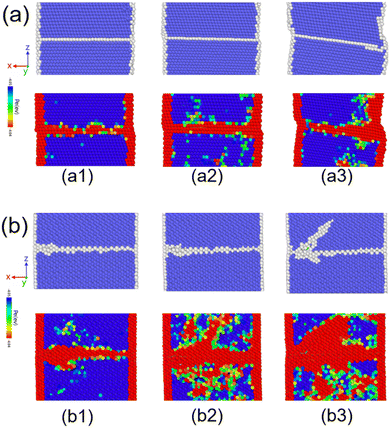
To understand the deformation process of NWs in more detail, as an example, Fig. 5(a and b) show the growing process of the deformation twin and dislocation line, respectively, in the form of enlarged snapshots, in the NW of Fig. 4(b). From Fig. 5, it can be seen that during the deformation process, firstly, the atom group near CTBs in the lower Ni content NWs have transformed from the BCC phase to the amorphous structural phases (see Fig. 5(a1 and b1)), then the nucleation of the deformation twins (a2) and dislocation lines (b2) are formed on the amorphous structural phases. Finally, the deformation twins (a3) and dislocation (b3) grow into the grain of the NW. Cui et al. pointed out the preferential nucleation of defects at the intersection of the surface in their study of the tensile fracture of W NWs, and twinning is the main reason for the decrease in the fracture strength of the NWs containing twinning. The present conclusion is consistent with that of Cui et al.9
3.3 Tensile deformation mechanism of Fe–Ni alloy NW where CTBs do migrate
In the present simulations, we found that the 1.5% Ni atoms CTBs in NWs with 0–3, 5–7 CTBs, and 8.5% Ni atoms CTBs in NWs with 1–10 CTBs do not migrate, and the deformation twins and dislocation lines are produced as described in the above section at 300 K. Thus, if the strains continuously increase enough, the necking phenomenon is accompanied in the NWs. However, the CTBs in the 1.5% Ni atoms Fe–Ni NWs of 4, 8–10 CTBs do migrate and disappear during the stretching process at 300 K. Among them, the NW with 4, 10 CTBs even showed the phenomenon of all CTBs migrating and disappearing. According to our simulation results, the effects of these three parameters on the migration phenomenon can be summarized as follows: higher temperature facilitates the migration of CTBs, while an increase in the nickel concentration inhibits the migration of CTBs.It is generally believed that the grain boundaries in crystals will migrate, merge, and disappear at high temperatures. In recent years, it has also been found that at lower temperatures, external forces can directly cause grain boundaries in crystals to migrate, merge, and disappear, resulting in the coarsening of grains.26–31 At present simulations, the migrations, merging, and disappearing of CBTs are found at low temperatures (300 K) for the Fe–Ni alloy NWs containing 4, 8–10 CTBs. The tensile external force may be the source of the migration and merging of the CTBs. To clearly understand the phenomenon of the complete disappearance of the CTBs in the NWs, as an example, a 1.5% Ni atom NW with 4 CTBs was used to explain such a disappearance process of the CTBs (Fig. 6).
As shown in Fig. 6, unlike the NWs of 0–3, 5–7 CTBs, a 1.5% Fe–Ni NW with 4 CTBs does not produce new deformation twins and dislocation lines before the yield of NWs. All the grains in the NW undergo an overall deformation under the external forces along the Z-axis. The CTBs parallel initially to the xoy horizontal plane gradually deviate and tilt from the horizontal plane under the loading (see Fig. 6(b)). As the strain increases gradually, the inclination angle further increases, and then the CTBs migrate and even merge. In this process, unlike in the NWs of 0–3, 5–7 CTBs, there are no deformation twins produced in the NWs of 4, 8–10 CTBs and only a very small number of dislocation lines appear near the CTBs migration. Finally, the CTBs disappear in the NWs. In previous studies, the interfaces within the alloy, under the action of force, can activate symmetry breaking under certain conditions.20 Through experiments and molecular dynamics simulation, Zhu et al. presented a finding that under shear loading, the grain boundary does migrate.32 Kvashin et al. reported the migration of twin boundaries in BCC crystals under shear action.31 So, the shear makes the CTBs migrate. Based on the phenomena observed in our simulations and literature, the migration process of CTBs in our work can be described as follows: during the stretching process, symmetry breaking forces the twin boundaries to completely deviate from the xoy plane without generating any dislocation lines or deformation twins. Subsequently, this symmetry breaking leads to the deformation of perfect grains, and further stretching exacerbates this deformation. At this point, the deformation effect is similar to the shear effect, which leads to further migration of CTBs in this shear effect, ultimately triggering the CTBs migration in NW under tensile action.
During the tensile process, the microstructural changes (such as dislocation nucleation, deformation twinning, and grain boundary migration) occurring within the NW are typically accompanied by changes in the system's energy. Approaching these phenomena from an energetic perspective can aid in better understanding the formation mechanisms of crystalline deformation.20,32 Specifically, during the simulation process, the formation of defects involves the rearrangement of some atoms within the crystal. This atomic rearrangement inevitably leads to rapid changes in the system's potential energy. In particular, the potential energy of the rearranged atoms in the crystal will differ significantly from that of the unrearranged atoms. Indeed, to theoretically calculate and analyze the likelihood of structural changes in crystals, various energetic analysis methods have been proposed in previous work, such as the calculation of the activation energy during the dislocation nucleation by McPhie et al. In general, these energies are derived from the potential energy of the simulated system.32 In our work, to visually represent our simulation results, we utilized snapshots of the system's potential energy and atomic potential energy to intuitively demonstrate the similarities and differences between the two deformation mechanisms.
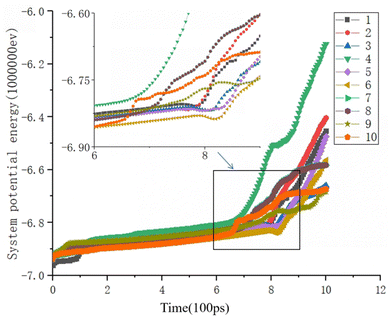
Fig. 7 shows the variation of the total potential energy with time for 1.5% Ni atom Fe–Ni NW of 0–10 CTBs at 300 K, and the curve IDs represent the number of CTB layers. In the figure, the potential energy of the NWs of 4, 8–10 CTBs increases faster than the potential energy of the NWs of 0–3, 5–7 CTBs during the tensile process. The former is the NWs where CTBs do migrate, and the latter is the NWs where CTBs do not migrate. The symmetry breaking during the migration of CTBs, as previously summarized, undoubtedly requires a significant increase in energy within the system to activate this particular mode of atomic structural transformation, despite its intricate physical mechanisms.20 A faster potential energy curve serves as a signal for the activation of symmetry breaking. Among the NWs where CTBs do migrate, the NW of 4 CTBs has the fastest increase in potential energy. The possible reason is that in the NW of 4 CTBs, the single-layer twin boundary moves the longest distance to migrate, compared with the NWs of 8–10 CBTs. In this case, a larger migration energy is required. For the NWs of 1–3, 5–7 CTBs where CTBs do not migrate, their total potential energy undergoes a local reduction during the tensile loading and is followed by a faster increase.
Fig. 8 demonstrates the evolution of the atomic structure and potential energy near the CTB in the nanowire (NW) as strain increases up to the yield point, distinguishing between the migrating and non-migrating grain boundaries. Each subfigure comprises an atomic snapshot (top) and its corresponding potential energy map (bottom), where (a) depicts a migrating grain boundary and (b) shows a non-migrating grain boundary. Notably, the figure reveals that significant changes in potential energy occur prior to observable structural transitions. This indicates that the underlying energy changes provide deeper insights into the structural modifications.
From the figure, it can be seen that atoms with lower potential energy are displayed in blue, while atoms with higher potential energy are represented in red. It can be observed that during the stretching process of the CTB migration, there is no significant increase in red in the local potential distribution within the grains, while the red in CTB is very bright (see Fig. 9(a and b)). This means that the atomic potential energy within the grain will not significantly increase, while the atomic potential energy on CTB is very high. Therefore, under the action of external forces, CTB accumulates sufficient energy and begins to migrate with increasing strain. On the contrary, for the non-migration of CTB (see Fig. 9(c and d)), more red areas appeared within its particles, as the red color in CTB is also very bright. This means that the potential energy of some atoms within its grains and CTB significantly increases. The higher potential energy causes these atoms to transition from the BCC phase to an amorphous phase. These atoms are located near the CTB, but within the grain. Therefore, further stretching of non-migrating CTBs, deformation twinning, and dislocations can lead to nucleation and growth within grains and near CTBs. These formed defects hinder the movement of CTB.
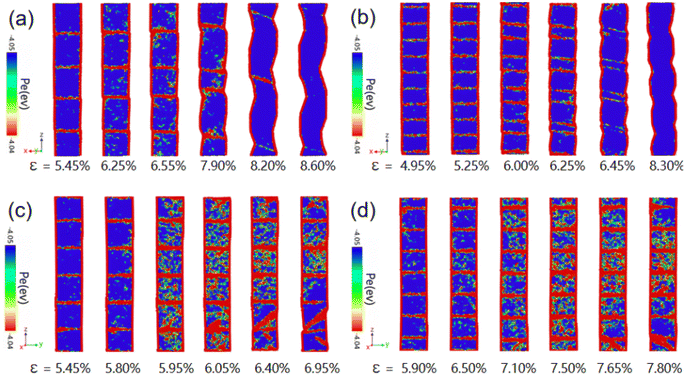 | ||
| Fig. 9 The distribution of potential energy in the (001) face of NWs containing 1.5% Ni atoms with 4 (a), 10 (b), 5 (c), and 7 (d) CTBs at 300 K during stretching. The atoms with lower potential energy are displayed in blue, and the atoms with higher potential energy are displayed in red. Fig. 8(a and b) are for the migration of CTBs in NW, and Fig. 8(c and d) for the non-migration of CTBs in NW. | ||
4. Conclusions
The uniaxial tensile process of the Fe Ni alloy NW with 1–10 CTB was simulated using molecular dynamics at different temperatures and Ni atomic contents. The simulation results showed that under uniaxial tensile load, two deformation mechanisms were discovered during the stretching process of NWs: a CTB migration deformation mechanism and a CTB non migration deformation mechanism. Specifically, for the migration of CTBs in NWs, the potential energy of the entire NW rapidly increases during the stretching process, but the atomic potential energy within the grain does not significantly increase. At this time, the increased energy during the stretching process is concentrated on CTBs, which ultimately leads to CTBs migration. For the CTBs not migrating in NW, the potential energy of some atoms within its grain and CTBs increased significantly during the deforming of the NWs. The higher potential energy makes these atoms transform from the BCC phase to the amorphous phase. These atoms are located near the CTBs and within the grains. Thus, further stretching the NWs, deformation twins, and dislocation can nucleate and grow within the grain and near the CTBs. These formed defects hinder the movement of the CTBs.Data availability
All data that support the findings of this study are included within the article.Conflicts of interest
There are no conflicts to declare.References
- B. Ranjan and D. Kaur, Achieving enhanced pseudocapacitance in MoS2 nanowires rationally sputtered over NiMnIn shape memory alloy for flexible Na-ion supercapacitor, J. Energy Storage, 2023, 71, 108122 CrossRef.
- G. Zhang, H. Zeng, J. Liu, J. Nagashima, K. Takahashi, T. Hosomi and T. Yanagida, et al., Nanowire-based sensor electronics for chemical and biological applications, Analyst, 2021, 146(22), 6684–6725, 10.1039/D1AN01096D.
- S. Barth, M. S. Seifner and S. Maldonado, Metastable Group IV Allotropes and Solid Solutions: Nanoparticles and Nanowires, Chem. Mater., 2020, 32(7), 2703–2741, DOI:10.1021/acs.chemmater.9b04471.
- C. Zhan, Y. Xu, L. Bu, H. Zhu, Y. Feng and T. Yang, et al., Subnanometer high-entropy alloy nanowires enable remarkable hydrogen oxidation catalysis, Nat. Commun., 2021, 12(1), 6261, DOI:10.1038/s41467-021-27395-1.
- L. Fanton, F. Loria, M. Amores, M. R. Pazos, C. Adán, R. A. García-Muñoz and J. Marugán, Proliferation of osteoblast precursor cells on the surface of TiO2 nanowires anodically grown on a β-type biomedical titanium alloy, Sci. Rep., 2022, 12(1), 7895 CrossRef CAS PubMed.
- M. K. Kabiraz, B. Ruqia, J. Kim, H. Kim, H. J. Kim and Y. Hong, et al., Understanding the Grain Boundary Behavior of Bimetallic Platinum-Cobalt Alloy Nanowires toward Oxygen Electro-Reduction, ACS Catal., 2022, 12(6), 3516–3523, DOI:10.1021/acscatal.1c05766.
- T. Fu, X. Peng, C. Huang, S. Weng, Y. Zhao, Z. Wan and N. Hu, Strain rate dependence of tension and compression behavior in nano-polycrystalline vanadium nitride, Ceram. Int., 2017, 43(15), 11635–11641 CrossRef CAS.
- Y. Wei, Scaling of maximum strength with grain size in nanotwinned fcc metals, Phys. Rev. B Condens. Matter, 2011, 83(13), 132104, DOI:10.1103/physrevb.83.132104.
- J. Cui, L. Ma, G. Chen, N. Jiang, P. Ke and Y. Yang, et al., Effect of twin boundaries on the strength of body-centered cubic tungsten nanowires, Mater. Sci. Eng., A, 2023, 862, 143826 CrossRef CAS.
- Z. Yang, L. Zheng and Y. Yue, et al., Effects of twin orientation and spacing on the mechanical properties of Cu nanowires, Sci. Rep., 2017, 7(1), 10056, DOI:10.1038/s41598-017-10934-6.
- J. Chen, P. Li and E. E. Lin, A molecular dynamics study on the mechanical properties of Fe–Ni alloy nanowires and their temperature dependence, RSC Adv., 2020, 10(66), 40084–40091, 10.1039/D0RA07831J.
- X. Chen, X. Lu, J. Ren, H. Xue, F. Tang and Y. Ding, et al., Effect of Co Content and Temperature on Shear Mechanical Properties of Nano-Polycrystalline Ni–Co Alloy, Phys. Status Solidi B, 2022, 259(7), 2200064, DOI:10.1002/pssb.202200064.
- W. Zhaozhao, Atomistic modeling of plastic deformation in BCC niobium nanowire under bending, Mater. Today Commun., 2024, 38, 108366, DOI:10.1016/j.mtcomm.2024.108366.
- G. Sainath and B. K. Choudhary, Orientation dependent deformation behaviour of BCC iron nanowires, Comput. Mater. Sci., 2016, 111, 406–415, DOI:10.1016/j.commatsci.2015.09.055.
- J. Li, Q. Fang and B. Liu, et al., Twinning-governed plastic deformation in a thin film of body-centred cubic nanocrystalline ternary alloys at low temperature, J. Alloys Compd., 2017, 727, 69–79, DOI:10.1016/j.jallcom.2017.08.115.
- K. S. Khare and R. Khare, Directed Diffusion Approach for Preparing Atomistic Models of Crosslinked Epoxy for Use in Molecular Simulations, Phys. Status Solidi B, 2012, 21(5), 322–327, DOI:10.1002/mats.201100119.
- C. Deng and F. Sansoz, Fundamental differences in the plasticity of periodically twinned nanowires in Au, Ag, Al, Cu, Pb and Ni, Acta Mater., 2009, 57(20), 6090–6101, DOI:10.1016/j.actamat.2009.08.035.
- G. Bonny, R. C. Pasianot and L. Malerba, Fe–Ni many-body potential for metallurgical applications, Modell. Simul. Mater. Sci. Eng., 2009, 17(2), 025010, DOI:10.1088/0965-0393/17/2/025010.
- K. Ueno, S. Fukuhara and Y. Shibuta, Temperature Dependence of Solid-Liquid Interfacial Energy for Pure Metals by Metadynamics-Based Simulations, Mater. Trans., 2022, 63(2), 209–216, DOI:10.2320/matertrans.MT-M2021156.
- C. Chen, F. Xu and J. Song, Symmetry breaking induced asymmetric dislocation-planar fault interactions in ordered intermetallic alloys, Int. J. Plast., 2024, 177, 103982, DOI:10.1016/j.ijplas.2024.103982.
- B. Y. Yu, Y. C. Liang, Z. A. Tian, R. S. Liu, T. H. Gao, Q. Xie and Y. F. Mo, MD simulation on crystallization mechanisms of rapidly supercooled Fe-Ni alloys, J. Cryst. Growth, 2020, 535, 125533, DOI:10.1016/j.jcrysgro.2020.125533.
- Y. Zhang, G. M. Stocks and K. Jin, et al., Influence of chemical disorder on energy dissipation and defect evolution in concentrated solid solution alloys, Nat. Commun., 2015, 6, 8736, DOI:10.1038/ncomms9736.
- Y. Ma, S. Zhang, T. Wang, Y. He, W. Chen, L. Liu and F. Liu, Atomic diffusion behavior near the bond interface during the explosive welding process based on molecular dynamics simulations, Mater. Today Commun., 2022, 31, 103552 CrossRef CAS.
- J. Denis and B. Evans, et al., The Nose–Hoover thermostat, J. Chem. Phys., 1985, 83, 4069–4074, DOI:10.1063/1.449071.
- A. Stukowski, Visualization and analysis of atomistic simulation data with OVITO–the Open Visualization Tool, Modell. Simul. Mater. Sci. Eng., 2010, 18(1), 2154–2162, DOI:10.1088/0965-0393/18/1/015012.
- Q. Guo, H. Hou and K. Wang, et al., Coalescence of Al_(0.3)CoCrFeNi polycrystalline high-entropy alloy in hot-pressed sintering: a molecular dynamics and phase- field study, npj Comput. Mater., 2023,(001), 185, DOI:10.1038/s41524-023-01139-9.
- K. Okayasu, H. Takekoshi and H. Fukutomi, Effect of Grain Boundary Migration on Texture Formation in Al-3mass%Mg Solid Solution during High Temperature Deformation, Mater. Sci. Forum, 2007, 558–559, 551–556, DOI:10.4028/www.scientific.net/MSF.558-559.551.
- Z. T. Trautt, M. Upmanyu and A. Karma, Interface Mobility from Interface Random Walk, Science, 2006, 314(5799), 632–635, DOI:10.1126/science.1131988.
- M. I. Mendelev, C. Deng and C. A. Schuh, et al., Comparison of molecular dynamics simulation methods for the study of grain boundary migration, Modell. Simul. Mater. Sci. Eng., 2013, 21(4), 045017, DOI:10.1088/0965-0393/21/4/045017.
- E. Homer, O. K. Johnson and D. Britton, et al., A classical equation that accounts for observations of non-Arrhenius and cryogenic grain boundary migration, npj Comput. Mater., 2022, 8, 1–9, DOI:10.1038/s41524-022-00835-2.
- N. Kvashin, A. Ostapovets and N. Anento, et al., On the migration of {332 (110) tilt grain boundary in bcc metals and further nucleation of {112 twin, Comput. Mater. Sci., 2021, 196, 110509 CrossRef CAS.
- (a) M. G. Mcphie, S. Berbenni and M. Cherkaoui, Activation energy for nucleation of partial dislocation from grain boundaries, Comput. Mater. Sci., 2012, 62(none), 169–174, DOI:10.1016/j.commatsci.2012.05.039; (b) Q. Zhu, G. Cao and J. Wang, et al., In situ atomistic observation of disconnection-mediated grain boundary migration, Nat. Commun., 2019, 10(1), 156, DOI:10.1038/s41467-018-08031-x.
| This journal is © The Royal Society of Chemistry 2024 |

