 Open Access Article
Creative Commons Attribution 3.0 Unported Licence
Evaluation of first-principles Hubbard and Hund corrected DFT for defect formation energies in non-magnetic transition metal oxides†
Daniel S. Lambert * and
David D. O'Regan
School of Physics, SFI AMBER Centre and CRANN Institute, Trinity College Dublin, The University of Dublin, Ireland. E-mail: Lamberda@tcd.ie
First published on 10th December 2024
Abstract
Recent advances have shown that first-principles DFT+U techniques, such as DFT+U+J with parameters from linear response, are capable of high bandgap accuracy in transition metal oxides at a fraction of the computational cost of hybrid functionals. Extending the use of these functionals to defect calculations could save computational resources, but there is limited knowledge on whether such techniques are capable of reliably modelling defect energies. Furthermore, the use of separate U and J values for the same atomic species in different chemical environments, within the same system, can introduce significant errors into formation energy calculations. In this work, for ZrO2, HfO2, and TiO2, we compare calculated defect properties for PBE, DFT+U+J, and prior results from the literature. For ZrO2 and HfO2, we identify three different practical methods that address the environment-dependent U and J value problem acceptably well, unlike the default naïve approach that yields unphysical defect formation energies. Our proposed techniques all yield formation energies, transition levels and defect concentration predictions that, while not identical to each other, are qualitatively in line with literature values. In TiO2, the formation energies are reasonably accurate, yet the localisation behaviour differs from that of the most reliable literature comparators, indicating a remaining difficulty for DFT+U+J with shallow defect levels.
1. Introduction
The modelling of defects using density-functional theory (DFT) requires the use of large supercells, which take large amounts of computational time to simulate. This makes the use of low-cost approximate functionals such as PBE1 and LDA preferable to computationally expensive hybrid functionals such as HSE06 (ref. 2) and PBE0.3,4 However, the low-cost functionals mentioned often greatly underestimate the bandgap of the material on the basis of the Kohn–Sham eigenspectrum.5 This, in turn, reduces the reliability of defect energy properties such as formation energies, which depend on electronic transition levels.In order to correct the bandgap of materials without resorting to the use of hybrid functionals, and possibly even to improve upon hybrid functionals, in situ corrective methods can be used, such as in a family of methodologies employing the Hubbard U parameter, known as DFT+U.6–8 In its simplest form, DFT+U adds an energy term that tends to penalize partial occupations of localized orbitals. The magnitude of this correction is set by a fixed “U” parameter, which can either be chosen on an empirical basis or calculated from first principles with a technique such as the finite-difference linear response method9–12 or minimum-tracking linear response method.13,14 The study of defects, particularly vacancies, in oxides using DFT+U has become increasingly commonplace over recent years, including some very sophisticated and successful studies.15–17
In addition to the Hubbard U parameter, Hund's J parameter is sometimes incorporated to improve the description of interactions between localized electrons of spin. The Hund's J parameter, within the corrective interpretation of DFT+U, has recently been associated with addressing static correlation error,18 which is an erroneous energy dependence on magnetization.19 Though counter-intuitive, this error can be substantial even in closed-shell systems where the magnetization itself vanishes. There are a variety of methods for incorporating the J parameter, including the widely-used Dudarev functional.20 In this work we primarily investigate a specific functional, referred to as “DFT+U+J” when originally proposed by Himmetoglu et al.21 (this is not the only functional sometimes labelled DFT+U+J). This functional takes the form of the Dudarev functional, plus an additional term proportional to the J parameter for interactions between opposite spins. Both the U and J may be calculated on the same footing through linear response techniques, albeit that in the case of J this is still rather novel and not commonplace. Particularly when using the convention for Hund's J as elaborated in Linscott et al.,14 DFT+U+J has been shown to provide very accurate bandgaps for MnO14 and TiO2.22 It should be noted, however, that the accuracy of standard DFT+U+J functional forms for total energies has recently been shown to be limited.18
In our previous work,23 upon which we build here, we showed that first-principles DFT+U+J provided a bandgap accuracy, over a test set of transition metal oxides (TMOs), that was similar (neglecting zero-point phonon and finite-temperature effects) to that of hybrid functionals such as HSE06. DFT+U+J was found to have a mean average error of 11%, the same as HSE06 and lower than the 15% error of PBE0. It was also demonstrated that DFT+U+J provides a lattice volume that is more accurate than the uncorrected PBE functional, with a mean average error of 2.33% compared to the 2.96% of PBE.23
For this work, we chose to study the widely-applied and well-characterized isoelectronic oxide series composed of ZrO2, HfO2 and TiO2, building on the bandgap results on each material from the previous work. Using DFT+U+J on these materials yielded bandgaps that were reasonably close to experimental values, with underestimation of the bandgap in TiO2, overestimation in HfO2, and an almost exact match with experiment in ZrO2. This set is a well-controlled one on which to judge the effectiveness of the DFT+U+J technique when applied to defect studies, because while changing little else it ranges from the very localised DFT+U projector orbital regime of 3d orbitals on Ti, to the rather diffuse one of 5d orbitals on Hf. At the same time, the closed-shell nature of these materials allows us to avoid certain ambiguities about how U and J are calculated (technically, the ‘simple’ and ‘scaled’ spin-polarized linear response schemes become equivalent) and, ideally for the present study, two of the oxides harbour oxygen atoms in different coordination environments. Thus any deficiencies in the processing of total-energy differences in first-principles DFT+U+J (with site-specific parameters) becomes very evident and even, as we will see, numerically catastrophic in these systems, while all other factors are relatively simple and well controlled.
For defect calculations, inaccurate bandgaps create problems for predictions of defect transition levels, because the defect levels may be predicted to be too shallow or even absent, for the same reasons that the bandgaps are underestimated.24 For materials with known bandgaps, defect studies often involve tuning the functional to the experimental bandgap by varying the U parameter, or varying the HSE screening parameter alpha,25 or using a direct scaling technique such as the scissor operator.26 These techniques are not first principles in nature, and so they cannot be applied to new materials or materials with uncertain bandgaps.
Defect formation energies can also be used to produce defect concentration predictions and Brouwer diagrams for intrinsic and extrinsic defects.27,28 These predictions are affected by material bandgaps as well as the magnitudes of formation energies, and will be more accurate when derived from simulations with both accurate bandgaps and accurate formation energy calculations. However, accurate defect calculations often require the use of large supercells that are computationally costly.29
The use of fast, first-principles bandgap correction methods such as DFT+U+J could address both of the latter issues, opening the path for much faster, accurate, high-throughput first principles screening of defect properties. However, the effect of DFT+U+J on defect calculations has not been studied extensively, much less how best to incorporate coordination-dependent U and J parameters in processes where the coordination changes.
Indeed, the use of DFT+U+J, and related DFT+U family functionals, for defect calculations provides some fresh challenges which are the key focus in this research. First-principles methods for calculating U and J can result in different parameters for inequivalent O atoms in different environments,30 since the parameters are as much a property of the chemical environment, as they are a property of the localized orbital shape. This poses no problems for bulk structure properties, but, as explained in Section 2.3, it raises significant issues for calculations of defect formation energies, due to the lack of error cancellation associated with absolute energies. This problem would also apply to other first principles techniques which yield separate U values for O in different environments, such as the DFT+U+V method that has been explored recently, e.g., in Timrov et al.31
In this work, we propose three practical methods of compensating for the issue of differing U values. These all produce results that are qualitatively in line with previous research that did not encounter this issue. The comparability of DFT+U type total energies more broadly, with state-specific in situ calculated corrective parameters, is an open question with current evidence suggesting that it is also problematic, at least with currently commonplace functional forms. This is the case, for example, when spin-state specific parameters are calculated and the resulting total energies are compared.32 In that context it proved to be better to rely on a degree of cancellation of error, whereupon the total-energy differences proved to be very satisfactory.
In this work, the first-principles DFT+U+J method is used to perform defect calculations on three TMO materials, specifically rutile TiO2, monoclinic ZrO2 and monoclinic HfO2. In previous research, it was shown that these materials were reasonably well captured with DFT+U+J, with TiO2 underestimating, HfO2 overestimating, and ZrO2 almost exactly reproducing the experimental gap.23 The O vacancy defect formation energies are calculated in charge states 0, +1 and +2 for each material, for both the PBE functional and DFT+U+J based upon PBE, in order to compare their results for defect formation energies, defect transition levels, and electronic structures, and to investigate the feasibility of the DFT+U+J technique.
2. Methodology
2.1 DFT+U+J functional corrections
There are a significant number of variations in the use of Hubbard U corrections, which have found increasing success at capturing bandgaps from first principles.33 In this work, the label DFT+U+J is used to refer to a specific functional originating with Himmetoglu et al.21 The convention for defining Hund's J from Linscott et al.14 is used, and more specifically the self-consistent field variation of this previously used in our own ref. 23. Ordinarily, different linear response calculations are required for the Hubbard U and Hund J parameters. However for ultimately non-spin-polarized systems such as those investigated here (in their pristine bulk form), it is possible to reduce this to a single simultaneous linear-response calculation using the equivalent ‘gamma’ method,22,23 halving the required number of finite-differences calculations.The DFT+U+J corrective functional used here is defined21 by
 | (1) |
![[n with combining circumflex]](https://www.rsc.org/images/entities/i_char_006e_0302.gif) Iσ represents the projected Kohn–Sham density matrix onto the orbitals that define the chosen subspace indexed I, for spin σ. The parameters U and J scale the magnitude of the correction. A further plausible ‘minority-spin term’ from21 is not included, following now-standard practice.
Iσ represents the projected Kohn–Sham density matrix onto the orbitals that define the chosen subspace indexed I, for spin σ. The parameters U and J scale the magnitude of the correction. A further plausible ‘minority-spin term’ from21 is not included, following now-standard practice.
The values of U and J can be determined using linear response calculations. This can be achieved through by applying α and β perturbations, on a single representative target subspace I for a given chemical species only, to construct the free energy
| W = EDFT + αN + βM. | (2) |
The U value is calculated by determining the slope of the linear response of the occupation number N to the corresponding perturbation strength, in the self-consistent field formalism, before (χ0) and after (χ) screening takes place, per
 | (3) |
The U value is then calculated as
| U = χ0−1 − χ−1. | (4) |
The Hund J is then calculated in a similar manner by determining the bare and relaxed linear response of M to an applied β, per
 | (5) |
| J = −χ0M−1 + χM−1. | (6) |
The U and J values for TiO2, ZrO2, and HfO2 for each atom were calculated by the present authors in ref. 23, using supercells of 3 × 3 × 5, 3 × 3 × 3, and 3 × 3 × 3 multiples of the unit cell, respectively, in order to isolate the perturbed atom from its periodic images and to converge the screening environment. The linear response values found for TiO2, ZrO2 and HfO2 are summarised in Table 1. Since the 3-fold and 4-fold coordinated O atoms are inequivalent, the DFT+U+J linear response methodology yields different U and J values for the two types of O atoms in ZrO2 and HfO2.
| Material | U (metal) | J (metal) | U (O1) | J (O1) | U (O2) | J (O2) | U (O average) | J (O average) |
|---|---|---|---|---|---|---|---|---|
| Rutile TiO2 | 3.24 | 0.38 | 11.24 | 1.70 | n/a | n/a | n/a | n/a |
| Monoclinic ZrO2 | 1.74 | 0.34 | 14.28 | 2.34 | 15.45 | 2.56 | 14.86 | 2.45 |
| Monoclinic HfO2 | 1.44 | 0.32 | 16.19 | 2.83 | 17.81 | 3.14 | 17.00 | 2.97 |
For reasons detailed in the next section, it can be useful for defect calculations to avoid having different U values for different O atoms, so an average U and J was also used in parts of this study, where emphasised. The large U values found for the PBE functional on oxygen 2p orbitals is noteworthy, albeit that those orbitals are more localized than the metal d orbitals here, when plotted.23 A detailed explanation of why large oxygen 2p Hubbard U parameters arise, in terms of chemical trends in the chemical hardness and electronegativity, is provided in Section III.B of (ref. 34).
A summary of the resulting bandgaps compared to experimental values was reported in our previous work ref. 23 and is shown in Table 2. The DFT+U+J bandgaps are reasonably close to the experimental ones, considering the low cost of the method once the parameters are in hand. We find a slight underestimate for TiO2, a larger overestimate for HfO2, and a falling within the experimental range for ZrO2. For this study, the bandgaps for HfO2 and ZrO2 were also recalculated using the “averaged” values for all O atoms.
| Material | PBE bandgap | DFT+U+J bandgap | Averaged O bandgap | Experimental bandgap |
|---|---|---|---|---|
| TiO2 | 1.83 | 2.79 | N/a | 3.03 |
| ZrO2 | 3.64 | 5.57 | 5.61 | 5.59 |
| HfO2 | 4.20 | 6.39 | 6.48 | 5.78 |
It was also shown in our previous research that the use of DFT+U+J did not result in excessive geometric or electronic structure distortion, as long as oxygen 2p orbitals are treated on the same footing as metal d orbitals.23 This makes it more plausible that defect formation energies calculations would give reasonable results, as we now proceed to investigate.
2.2 Defect formation energy equation
The defect formation energy Ef can be calculated35 according to the equation:
 | (7) |
The defect formation energy can be used for many predictions, such as of defect concentrations under real world conditions.36 It measures the thermodynamic (but not kinetic) obstacle to forming a defect in the material.
Defect calculations are usually performed in large supercells, rather than in the unit cell, in order to reduce the charge interaction between a defect interacting with a copy of itself in a neighbouring repeating cell.29 In order to better compare with previous results, for consistency we have neglected the charge correction term (which can be rather sensitive to the fine details of its parameters) and instead examined the convergence of energy with varied supercell size. This allows for an easier comparison with previous literature values that used a range of different charge correction techniques.
A comparison of chosen and larger supercells found differences in PBE 0/+2 transition levels (i.e., the Fermi-level at which the defect formation energy plots for these charge states intersect) of 0.01 eV for TiO2 in a 2 × 2 × 3 supercell, against that in a 3 × 3 × 5 supercell. This result was (for the 3-fold O vacancy) 0.01 eV for ZrO2 (2 × 2 × 2 against 3 × 3 × 3), and 0.04 eV for HfO2 (2 × 2 × 2 against 3 × 3 × 3). This indicates that the resulting errors in transition levels due to lack of charge correction are likely to be small, compared to the large errors soon encountered.
2.3 The effect of differing U values
The defect formation energy is a measure of environmental barriers, and thus will depend on assumptions about the defect's surroundings, particularly through the choice of chemical potentials. In this study, the chemical potential of O, the µj, is found by simulating the isolated triplet O2 molecule, in a large (10 × 10 × 10 Ang3) simulation cell. Different U and J values are applied to the O 2p orbitals of the reservoir O2 molecule, as we go on to describe. All results are given under the O-rich condition, that is assuming that the chemical potential of O in the TMO is equivalent to that in the reference single-molecule simulation.Defect formation energy results rely on error cancellation between the DFT simulations of the pure cell, the defective cell, and the reference oxygen calculation. In DFT+U calculations, each atom that is assigned a Hubbard U value will introduce an associated amount of Hubbard energy into the calculation (as will Hund's J values in DFT+U+J). If an oxygen atom has a Hubbard energy associated with it in the defective cell and the pure cell, but not in the reference oxygen calculation, then it's possible that error cancellation will no longer occur to the same extent as a regular DFT calculation. In a typical DFT+U paper this is sometimes addressed by adding a Hubbard term with the same U value to the reference calculation, however in our case, there are two different Hubbard terms for the same element in the same calculation. This also applies to similar first principles techniques such as DFT+U+V, which also have differing U parameters for different O environments.30
If we neglect this issue and do not apply any Hubbard U to the reference potential, the resulting “naïve” defect formation energy for the charge neutral O vacancy defects can be calculated with the following equation derived from eqn (7):
 | (8) |
Similarly, the 4-fold charge neutral oxygen is given by:
 | (9) |
In this research, we have devised and tested three plausible, practical methods to correct for the effect of the varying Hubbard energy contribution.
The first method, which will be called the “Differing potentials” method, involves using different O reference potentials for different vacancy calculations, with U and J applied to the reference potential simulation (the isolated molecule) matching the U and J values calculated from first principles for the O atom that is then removed from the solid. This means that the extra Hubbard energy of the O atom in the pristine supercell will be somewhat balanced out by the Hubbard energy of the O atom in the gas-phase reference calculation.
The equation for the differing potential method differs from the naïve method in only one respect: the reference oxide has a U correction applied, with the U value corresponding to the removed atom:
| Ef3fold = E3folddefect(U3fold,U4fold) − Ebulk(U3fold,U4fold) + 1/2EO2(U3fold) | (10) |
| Ef4fold = E4folddefect(U3fold,U4fold) − Ebulk(U3fold,U4fold) + 1/2EO2(U4fold). | (11) |
The second method, referred to as the “subtraction” method, involves running the calculations as normal, using a molecular O2 reference calculation with no U or J applied but at the PBE level. The defect formation energy calculation is then modified simply by subtracting off the Hubbard energy correction in each simulation that has one. The Hubbard effect on the Kohn–Sham potential remains in place. This approach effectively treats the absolute energy of the correction as a spurious term to be subtracted out as a post-processing step, as is done with charge jellium energy in some charge correction techniques. The crystal structure and bandgap of the DFT+U+J method is preserved.
The equation for the subtraction method is:
 | (12) |
This is the same as for the naïve method, but two additional terms are introduced: EHubbard3folddefect is the total Hubbard energy in the defective cell simulation, and EHubbardbulk is the total Hubbard energy in the pure cell. Similarly, for a 4-fold defect:
 | (13) |
The third method is the “averaging” method, which is to average the O values for the 3-fold and 4-fold cases shown in Table 1 to obtain new values for U and J. These new values are applied equally to the 3-fold and 4-fold coordinated O atoms, as well as to the O2 reference gas-phase molecule simulation. The use of approximate U values may introduce extra errors in the simulations.
The averaging method has the following equation for a 3-fold defect:
| Ef3fold = E3folddefect(Uavg,Uavg) − Ebulk(Uavg,Uavg) + 1/2EO2(Uavg). | (14) |
Unlike in the other methods, the U (and J) values used for 3-fold and 4-fold coordinated atoms are the same, averaged value.
| Ef4fold = E4folddefect(Uavg,Uavg) − Ebulk(Uavg,Uavg) + 1/2EO2(Uavg). | (15) |
A key test of each technique uses the difference in formation energy between the equivalently charged 3-fold O vacancies and 4-fold O vacancies, which is thought to be already well described at the PBE level. In the case of PBE calculations with no U or J applied, the two defect calculations have the same energy expressions, with the only difference being that an O atom is moved. The difference in formation energies will be the resulting difference in simulation energies and will be independent of any errors in the atomic oxygen chemical potential.
This is not the case in DFT+U+J, where the removed O atoms in the 3-fold vacancy and 4-fold vacancy have different associated U and J corrections applied. Since the DFT+U Hubbard energy, for example, is directly proportional to the applied U–J value, any errors in the absolute Hubbard energy will not be cancelled out when comparing to two vacancies. Given a perfect DFT+U+J functional, population analysis, and method to compute the parameters, this issue may self-resolve, but it is not the case using the definitions in contemporary use. The three different methods we propose are expected to address this in somewhat different ways. The “differing potentials method” imposes an approximate error cancellation between a given O atom in the solid, and a coordination-dependent reference O energy. The “subtraction method” will remove all Hubbard terms, and thus eliminate the effect of absolute Hubbard energies, at the expense of self-consistency. The “averaging method” method balances out the extra Hubbard energy on each O atom irrespective of its environment.
2.4 Computational details
Calculations were performed with the Quantum ESPRESSO package version 6.6,37 using the PBE exchange correlation functional and the neutral-reference PSlibrary1.0.0 (ref. 38) ultrasoft pseudopotentials. The energy and force convergence thresholds for relaxations were 6 × 10⁻⁵ Ry and 10−4 Ry Bohr−1, respectively, a Fermi–Dirac smearing of 0.01 Ry was applied, and the Brillouin zone was sampled using a Γ-centered Monkhorst–Pack grid.39As described in our work in ref. 23, the wavefunction and charge density cut-offs were chosen by convergence testing to less than 1 meV per atom variation. The wavefunction cut-off used was higher than typically used, out of caution for the robustness of results. The supercell sizes used for each material are summarised in Table 3. The U and J values were calculated in ref. 23 as described in Section 2.1 and summarised in Table 1.
| Material | Wavefunction energy cut off (Ry) | Charge density energy cut-off (Ry) | Supercell size | k-Points |
|---|---|---|---|---|
| Rutile TiO2 | 120 | 480 | 2 × 2 × 3 | 2 × 2 × 3 |
| Monoclinic ZrO2 | 120 | 480 | 2 × 2 × 2 | 2 × 2 × 2 |
| Monoclinic HfO2 | 130 | 520 | 2 × 2 × 2 | 2 × 2 × 2 |
2.5 Defect concentration predictions
Under thermodynamic equilibrium, defect concentrations can be predicted using the law of mass action:28
 | (16) |
In Section 2.2, the procedure for calculating defect formation energies was detailed. These formation energies are a function of Fermi energy within the material. At higher Fermi energies, there will be more negatively charged defects and free electrons, while at lower Fermi energies there will be more positively charged defects and holes, so there will be only one Fermi energy that yields charge neutrality, fulfilling the condition:
 | (17) |
 | (18) |
 and
and  are the effective masses of electrons and hole respectively, and h is Planck's constant. In this study we use the average of effective masses from PBE simulations as calculated previously in ref. 23.
The Fermi energy yielding charge neutrality can then be used to produce the final estimate for defect concentrations at that temperature. This can then be repeated for multiple temperatures to yield a graph of predicted concentration at each temperature. It should be noted that DFT is often unreliable when it comes to oxygen reference calculations,28 so the resulting defect concentrations will only be approximate.
3. Results
3.1 Monoclinic ZrO2 results
Fig. 2a shows the results of the PBE calculation, where the 3-fold vacancy is favoured for the +1 and +2 charges, but the 4-fold vacancy is very slightly favoured for the charge neutral case. Fig. 2b is a recreation of the results of Lyons et al.,40 in which the results were calculated using HSE with an hybrid-functional screening alpha parameter of 0.29. Just like in the PBE case, the 3-fold vacancy is favoured. Note that in the those results, the +1 charge is favoured for a very narrow range of Fermi levels. This qualitative difference may plausibly result from the mentioned authors having used a charge correction technique, versus our reliance on a large supercell.
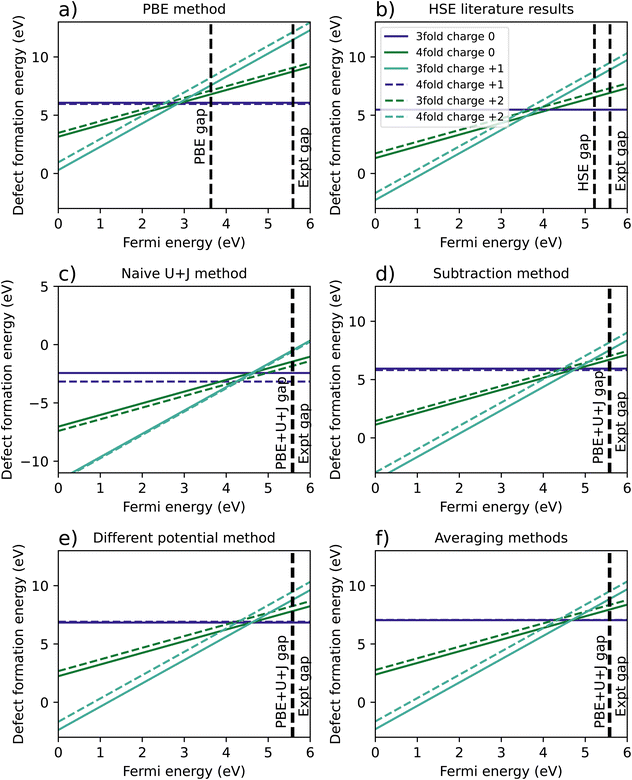 | ||
| Fig. 2 A comparison of calculated defect formation energies for ZrO2 under different methodologies. (a) Shows the regular PBE approximation, (b) is from Lyons et al.40 (c) refers to a naïve DFT+U+J calculation without corrections for differing U+J values on O atoms, and (d–f) refer to three different methods of correcting for these U+J values. | ||
Fig. 2c shows the original calculation result for DFT+U+J, with no corrections for differing U and J values. The naïve treatment predicts that the 4-fold O vacancy is preferred for all charge states and Fermi energies, including the +2 state, which disagrees with both PBE calculations and all previous literature findings40–42 to our knowledge. Fig. 2d, e and 2f show the results of the three different methods proposed to compensate for this effect, as described in Section 2.3.
The necessity of using corrections can be most clearly seen in the difference in energy between 3-fold and 4-fold O vacancies. In the PBE simulation and the HSE results from Lyons et al.,40 the 3-fold defect is clearly favoured for +1 and +2 charged defects, while the charge neutral defect formation energies are very close for 3-fold and 4-fold coordinated O defects. This also matches previous studies from Hur et al.43 and Lafargue et al.42 with the maximum charge neutral difference being 0.10 eV for the PBE calculation in this study.
The naïve method, without any corrections, yields completely different results, with the charge neutral 4-fold defect highly favoured over the charge neutral 3-fold defect by 0.74 eV, the 4-fold charge +1 defect favoured by 0.37 eV, and the charge +2 4-fold defect favoured slightly by 0.1 eV. For the reasons outlined in Section 2.3, these results are likely to be completely erroneous. All three error correction methods restore the results to be qualitatively similar to the PBE and literature results. The only difference from the literature methods is that the differing potentials and averaging methods slightly prefer the 3-fold defect in the charge neutral case, by 0.07 eV and 0.02 eV respectively, a relatively small discrepancy.
Table 4 summarises the location of the 0/2 transition level within the band gap, with the +1 charge state being ignored. The naïve method gives the closest result to the HSE reference for all three reference points, namely the VBM, the calculated conduction band minimum (CBM), or the experimental CBM. Of the three correction techniques, the differing potential method gives the closest results to the HSE reference for all three reference points. Overall, irrespective of the method used to treat the coordination-dependence of the calculated corrective parameters, the DFT+U+J method gives results that are much better in line with those of hybrid functionals than PBE, at a fraction of the computational cost after the parameters are once calculated.
| Method | Band gap (eV) | 0/2 Transition levels | ||
|---|---|---|---|---|
| Above VBM | Below calculated CBM | Below experimental CBM | ||
| PBE (3-fold) | 3.64 | 2.89 | 0.75 | 2.70 |
| Naïve DFT+U+J (3-fold) | 5.57 | 4.61 | 0.96 | 0.98 |
| Subtraction method (3-fold) | 5.57 | 4.79 | 0.78 | 0.80 |
| Differing potential method (3-fold) | 5.57 | 4.61 | 0.96 | 0.98 |
| Averaging method (3-fold) | 5.57 | 4.67 | 0.90 | 0.92 |
| HSE40 (3-fold) | 5.22 | 3.87 | 1.35 | 1.72 |
| PBE (4-fold) | 3.64 | 2.50 | 1.14 | 3.09 |
| Naïve DFT+U+J (4-fold) | 5.57 | 4.29 | 1.28 | 1.30 |
| Subtraction method (4-fold) | 5.57 | 4.39 | 1.18 | 1.20 |
| Differing potential method (4-fold) | 5.57 | 4.29 | 1.28 | 1.30 |
| Averaging method (4-fold) | 5.57 | 4.35 | 1.22 | 1.24 |
| HSE40 (4-fold) | 5.22 | 3.57 | 1.65 | 2.02 |
The predicted concentration of O vacancies, under different temperature conditions, can be calculated from the defect formation energies using the method outlined in Section 2.5. It should be noted that these predictions are highly dependent on the reference chemical potential of oxygen. For simplicity sakes, and to match with Lyons et al.40 we have used a simulation of an isolated O2 molecule as reference. The results are shown in Fig. 3. The naïve method is not pictured as it gives unphysical results, predicting an oxygen defect concentration of over 100% at all temperatures. If taken seriously, this would erroneously imply that ZrO2 spontaneously breaks apart at room temperature. This provides more evidence that the naïve method is unreliable.
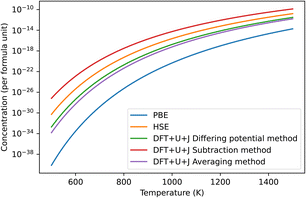 | ||
| Fig. 3 Predicted concentrations in ZrO2 of the dominant O defect for different temperatures, under all different techniques, under O rich conditions. The HSE results were derived from Lyons et al.40 The “naïve” method was omitted as it produced unphysical predictions. In all cases shown in the figure this dominant defect was the +2 charged 3-fold coordinated O vacancy. | ||
Of the remaining methods, the subtraction method gives the highest prediction of defect concentration. At 600 K, it predicts 3 orders of magnitude higher defects than the HSE method does, although this gap narrows at higher temperatures. The differing potentials and averaging methods give results that are almost identical in magnitude to each other. The results of these techniques are roughly 2 orders of magnitude lower than that of HSE at 600 K, making them 5 orders of magnitude lower than the subtraction technique. This difference reflects that the total Hubbard energy of an O atom in bulk ZrO2 is higher than that of an O atom in an O2 molecule. In contrast, the differing potential and averaging methods both give predictions that are within two orders of magnitude of the HSE predictions. Finally, PBE gives defect concentration that are much smaller than all the other methods tested, which is a reflection of its erroneously small bandgap for this material together the relatively shallow slope of the +2 defect formation energy with respect to Fermi level.
3.2 Monoclinic HfO2 results
Fig. 5 shows the resulting formation energy for a variety of methods, including a recreation of the results of Lyons et al.,40 using HSE. When it comes to the relative 3-fold and 4-fold energies, the resulting are qualitatively the same as was found for ZrO2, with the 3 fold vacancy being favoured in the +2 and +1 charge states for every methodology except the naïve U+J method, and the 3-fold and 4-fold vacancies having almost equal formation energies for every case except the naïve U+J methodology.
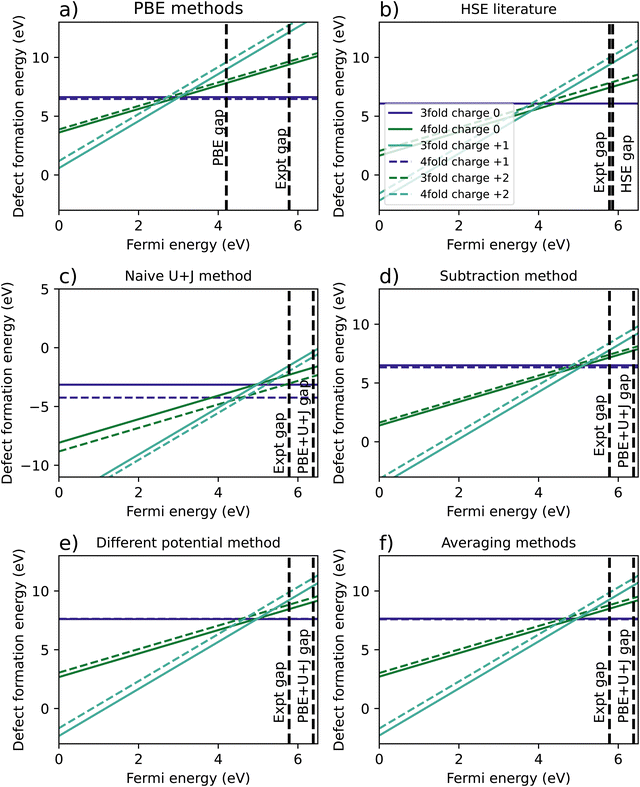 | ||
| Fig. 5 Calculated defect formation energies for HfO2 under 6 different methodologies. (a) Shows the regular PBE method, (b) is a from Lyons et al.40 (c) refers to a naïve DFT+U+J calculation without corrections for differing U+J values on O atoms, and (d–f) refer to three different methods of correcting for these U+J values. | ||
The difference between 3-fold and 4-fold coordinated vacancies shows a similar pattern to what was found with ZrO2. For PBE, the HSE results from Lyons et al.,40 and all three correction techniques, the 3-fold defect is favoured for +2 and +1 charged O vacancies, while the difference is small for charge neutral vacancies. The naïve method gives vastly different and likely erroneous results, clearly favouring the 4-fold defect under all charge states.
The main qualitative difference between non-naïve techniques is in which coordinated defect is favoured in the +2 state. The 4-fold defect is slightly favoured in the PBE, subtraction method and averaging cases, by 0.16 eV, 0.17 eV, and 0.05 eV, respectively. In Lyons et al.,40 both results were given as identical (to one decimal place), whereas in the differing potentials method, the 3-fold defect is very slightly favoured, by only 0.02 eV.
Table 5 summarises the location of the 0/2 transition level within the band gap. Unlike with ZrO2, in HfO2 the band gap is overestimated by the DFT+U+J technique. Again, the naïve DFT+U+J technique gives the closest answers to the HSE literature value, however as noted before it gives incorrect predictions in other respects. Of the corrected methods, the averaging method gives the closest result to the HSE values for all three reference points, with the calculated CBM reference point being the closest. As with ZrO2, the DFT+U+J correction transition levels are closer to the HSE results than the PBE is, for all three reference points.
| Band gap (eV) | Transition levels | |||
|---|---|---|---|---|
| Above VBM | Below calculated CBM | Below experimental CBM | ||
| PBE (3-fold) | 4.20 | 3.02 | 1.18 | 2.76 |
| Naïve DFT+U+J (3-fold) | 6.39 | 4.97 | 1.42 | 0.81 |
| Subtraction method (3-fold) | 6.39 | 5.14 | 1.25 | 0.64 |
| Differing potential method (3-fold) | 6.39 | 4.97 | 1.42 | 0.81 |
| Averaging method (3-fold) | 6.39 | 4.97 | 1.42 | 0.81 |
| HSE40 (3-fold) | 5.80 | 4.13 | 1.67 | 1.65 |
| PBE (4-fold) | 4.20 | 2.64 | 1.56 | 3.14 |
| Naïve DFT+U+J (4-fold) | 6.39 | 4.65 | 1.74 | 1.13 |
| Subtraction method (4-fold) | 6.39 | 4.75 | 1.64 | 1.03 |
| Differing potential method (4-fold) | 6.39 | 4.65 | 1.74 | 1.13 |
| Averaging method (4-fold) | 6.39 | 4.65 | 1.74 | 1.13 |
| HSE40 (4-fold) | 5.80 | 3.83 | 1.97 | 1.95 |
The predicted defect concentrations under each technique are shown in Fig. 6. As was the case with ZrO2, the naïve method gives unphysically large results that predict spontaneous dissociation and was thus excluded.
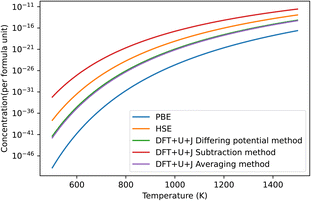 | ||
| Fig. 6 The predicted concentrations under different temperatures of O vacancy defects in HfO2 under O rich conditions. The HSE results were derived from Lyons et al.40 The “naïve” method has been omitted for giving unphysical results. The dominant defect for all methods was the +2 charged 3-fold coordinated O vacancy. | ||
Of the methods shown in the figure, the subtraction method again overestimates the defect concentration by a large amount compared to other techniques, while PBE underestimates the value. The differing potential and averaging method give results that are almost identical for this material, and are the closest to the HSE results of Lyons et al.40
3.3 Rutile TiO2 results
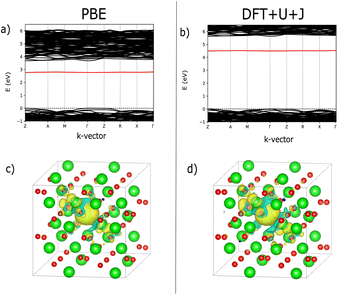
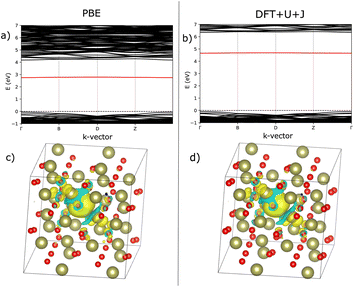
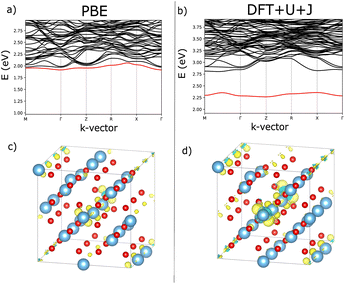
Fig. 7 shows an analysis of electron localisation for both PBE and DFT+U+J. Different initial magnetic configurations were attempted together with ionic relaxation in a fixed-volume cell, with some leading to higher-energy local minima, however for both functionals the high-spin, triplet-like magnetic configuration proved to have the lowest energy for the charge-neutral system. The supercell magnetic moment was 2.00 µB in both cases, while DFT+U+J provided a higher integrated absolute magnetization (of 2.85 µB) than PBE did (2.55 µB). Fig. 7a and b show the bandstructure of the defective supercell near the CBM, for PBE and PBE+U+J. The defect-related donor levels are majority-spin in character, and are somewhat dispersive in this supercell (i.e., at this defect concentration) unlike in the case of the latter two materials. In the PBE case there is one only marginally distinct band, corresponding to double ionization of the defect. In the DFT+U+J case there is again only one well-separated donor level, corresponding to double ionization. This is less dispersive, and approximately 0.5 eV below the CBM. There is some evidence in the bandstructure of the entangled, again majority-spin single-ionization level at the conduction band edge.
Fig. 7c and d show, for PBE and DFT+U+J, with the defective cell structure frozen in its converged charge-neutral configuration, the charge density difference between the charge neutral case (with the excess electrons) and the case with two electrons removed (on the assumption that the localised electrons will be removed first). In a fully localised defect, this difference would be almost entirely localised as well.
In the PBE case of Fig. 7c, the electrons appear to have been mostly delocalised and spread much more uniformly among the Ti atoms throughout the bulk of the material, with a small preference for the Ti atoms near the vacancy site. In the case of the DFT+U+J calculation shown in Fig. 7d, the level of localisation appears to be somewhat increased yet with the same general profile, and some portion of the extra charge still spreads onto other sections of the cell. This is most similar to the “polaron” state described in ref. 46, but in this case and this supercell there also seems to be localisation on the Ti atoms further away as well. The localisation behaviour of shallow defects is only partially visualised by this methodology, which combines together the density for two different defect levels of rather different character.
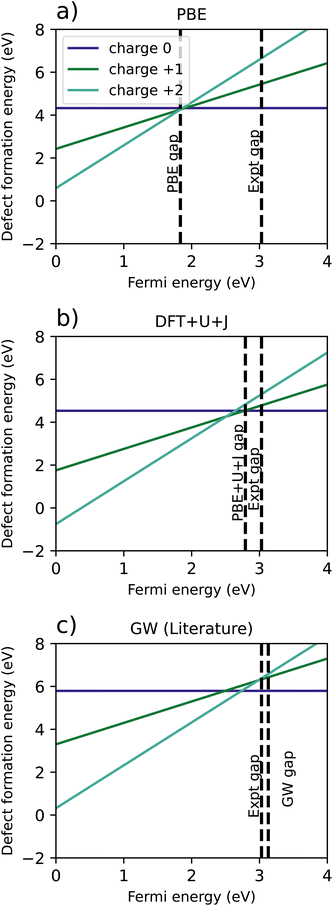 | ||
| Fig. 8 Comparison of defect formation energies for TiO2 calculated using (a) PBE functional, (b) DFT+U+J functional, (c) a recreation of G0W0 results from Malashevich et al.47 | ||
For PBE, and GW (which, unlike DFT+U+J, does not treat spin-symmetry broken solutions and resulting energy relaxation), there is no point in the where the +1 charge is favoured. It is further worth noting that the GW formation energy graphs are reconstructed from single quasiparticle energies, rather from total energies. In the PBE simulation, the +2 charge is the only charge favoured for the entire length of the band gap, with the 0, +1 and +2 charges all having almost exactly the same energy at the CBM. However, the introduction of DFT+U+J changes the relative formation energies of the charges, resulting in the +1 charge being favoured over a Fermi level interval near the conduction band edge.
Table 6 shows a comparison of the calculated transition levels, referenced to the VBM, the calculated CBM, and the experimental CBM. For all reference points, the DFT+U+J method yields the results closest to the GW method, while having a much smaller computational cost.
| Band gap (eV) | Transition levels | |||
|---|---|---|---|---|
| Above VBM | Below calculated CBM | Below experimental CBM | ||
| PBE | 1.83 | 1.87 | −0.04 | 1.16 |
| DFT+U+J | 2.79 | 2.64 | 0.15 | 0.39 |
| GW | 3.13 | 2.74 | 0.39 | 0.29 |
Fig. 9 shows the predicted defect concentrations of O vacancies under DFT+U+J, compared to PBE and GW. In this case, the O potential is taken from a reference O dimer simulation with the same U and J applied as in the bulk simulation. This would correspond with either the “differing potentials” or “averaging methods” as used in HfO2 or ZrO2, which are equivalent since both O atoms have the same U and J value.
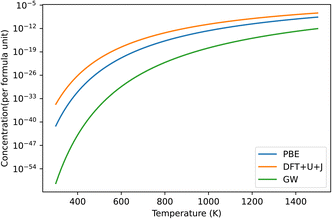 | ||
| Fig. 9 Predicted defect concentrations under different temperatures for TiO2 under O rich conditions. Only the dominant +2 charged O vacancy defect is shown. GW results are derived from the defect formation energies of Malashevich et al.47 | ||
If we take the GW results as a benchmark, PBE overestimates the defect prevalence, with the DFT+U+J method overestimating it to a larger extent. This could be an indication that the inability to capture the shallow defect is resulting in an overestimation of defect formation energies. Alternatively, it could be an artifact of the differences in calculating O chemical potentials between this technique and that of Malashevich et al.47
4. Conclusion
In this study, the feasibility and effectiveness of using the DFT+U+J technique for calculating oxygen vacancy defect calculations were evaluated, using the test systems TiO2, ZrO2 and HfO2. For each material, the defect transition levels were also calculated and compared with literature values.In ZrO2 and HfO2 the use of differing U values for the 3-fold and 4-fold vacancy introduced methodological problems for simulating such vacancies, due to the effect of differing Hubbard energies on defect formation calculations. This was seen most clearly in the gap between 3-fold and 4-fold energies, which is a valid total-energy difference quantity that should be accessible within DFT, where a naïve treatment leads to spurious results. This represents a special case of a general problem, at present, in the comparison of DFT+U type total energies when incorporating in situ calculated Hubbard parameters, such as in heat of formation, convex hull diagrams, or spin-flip energy calculations used to parametrise Heisenberg-type spin models.
Three different methods are proposed and tested for rectifying this situation, the “subtraction method”, “differing potential method” and “averaging method”. All three methods give 3-fold to 4-fold vacancy energy differences that broadly are in line with literature values, reassuringly, for ZrO2 and HfO2. Defect concentration predictions were compared for each method, finding that in both ZrO2 and HfO2, the naïve or uncorrected approach gives entirely unphysical results, while the differing potentials and averaging methods give results that match closely with reported HSE values. For these materials, the PBE approximation underestimates the defect concentrations, while the subtraction method overestimates them, as well as being an intrinsically inconsistent method.
Overall, we find that the use of at least some corrective method is crucial for certain results, such as predicting which defect is more dominant and predicting overall concentrations. For HfO2 and ZrO2, the subtraction method appears to fall short when it comes to defect concentration predictions, while the differing potentials and averaging methods perform similarly well on all numeric metrics. Overall we tentatively recommend the “differing potentials” method, which involves matching U and J parameters in the reference potential to those of the bulk material. This is because it may generalise better to systems with more greatly differing atom coordinations and/or Hubbard parameters, and almost certainly would do so when considering systems incorporating vacancies of more than one chemical species.
For TiO2 calculations with an oxygen vacancy, the defect transition levels based on the located spin-triplet neutral-system ground state matched reasonably closely with previous GW level work, both when compared to the valence and conduction bands. However, when first-principles DFT+U+J correction is applied, the +1 charge state is energetically favoured over a Fermi-level interval of 0.27 eV adjacent to the conduction band edge. A defect bandstructure analysis found that the DFT+U+J method separated the lower (spin-polarised) defect band from the conduction band minimum, whereas the PBE approximation doesn't achieve even this.
These results overall show that the first-principles DFT+U+J methodology gives defect formation energy results that are qualitatively similar to hybrid functionals at the task of placing defect transitions within a bandgap. While unlikely to be as accurate as hybrid results that are tuned to specific bandgaps, by construction, these results are completely from first principles and come at a fraction of the computational cost of hybrid functionals, making them potentially more suitable for large scale or high-throughput simulations. However, our results show that DFT+U type total energy difference calculations cannot be carried out naïvely, in the sense of neglecting the application of Hubbard correction (with at least some degree of consistency) across different systems contributing to the calculation. Ultimately, we anticipate that with the ongoing development of ever more comprehensive functional forms, population analysis methods, and parameter calculation methods for generalized Hubbard-corrected DFT, it may become unnecessary to take steps such as those described here to ensure viable results. Within the contemporary, ever more widespread practice of DFT+U for problems in computational materials chemistry, meanwhile, the proposed “differing potentials” method may prove helpful.
Data availability
Our data is included in the ESI materials† of this submission. Specifically, the excel sheet “defects_supplementary” contains the results of the simulations for the three materials, as well as the reference calculations, and was used to prepare the tables used in the final projects. The jupyter notebook “Defect graphs and calculations” contains the code that generates defect formation energy diagrams from simulation outputs, as well as the band diagrams. The jupyter notebook “Brouwer calculations and graphs” takes the results from the defect formation energies and converts them into defect concentration graphs. An example Quantum Espresso pw.x input file for a defective ZrO2 calculation, “ExampleQeinputfile.in” is included to show how the DFT simulations were prepared.Conflicts of interest
There are no conflicts to declare.Acknowledgements
This publication has emanated from research conducted with the financial support of Science Foundation Ireland (SFI), Grant Number 12/RC/2278_2, and is co-funded under the European Regional Development Fund under the AMBER award. Calculations were performed using clusters maintained by Trinity College Dublin Research IT; the clusters Kelvin and Boyle being funded by grants, respectively, from SFI, The Higher Education Authority through its PRTLI program, and the European Research Council and SFI. We are pleased to acknowledge financial support from Intel Corporation and insightful discussions and guidance from Justin Weber and Karthik Krishnaswamy.References
- J. P. Perdew, K. Burke and M. Ernzerhof, Phys. Rev. Lett., 1996, 77, 3865 CrossRef CAS PubMed.
- J. Heyd, G. E. Scuseria and M. Ernzerhof, J. Chem. Phys., 2003, 118, 8207–8215 CrossRef CAS.
- A. V. Krukau, O. A. Vydrov, A. F. Izmaylov and G. E. Scuseria, J. Chem. Phys., 2006, 125, 224106 CrossRef PubMed.
- C. Adamo and V. Barone, J. Chem. Phys., 1999, 110, 6158–6170 CrossRef CAS.
- A. Seidl, A. Görling, P. Vogl, J. A. Majewski and M. Levy, Phys. Rev. B:Condens. Matter Mater. Phys., 1996, 53, 3764 CrossRef CAS PubMed.
- V. I. Anisimov, J. Zaanen and O. K. Andersen, Phys. Rev. B:Condens. Matter Mater. Phys., 1991, 44, 943–954 CrossRef CAS.
- V. I. Anisimov, I. V. Solovyev, M. A. Korotin, M. T. Czyżyk and G. A. Sawatzky, Phys. Rev. B:Condens. Matter Mater. Phys., 1993, 48, 16929 CrossRef CAS.
- I. V. Solovyev, P. H. Dederichs and V. I. Anisimov, Phys. Rev. B:Condens. Matter Mater. Phys., 1994, 50, 16861 CrossRef CAS PubMed.
- M. Cococcioni and S. De Gironcoli, Phys. Rev. B:Condens. Matter Mater. Phys., 2005, 71, 035105 CrossRef.
- W. E. Pickett, S. C. Erwin and E. C. Ethridge, Phys. Rev. B:Condens. Matter Mater. Phys., 1998, 58, 1201–1209 CrossRef CAS.
- H. J. Kulik, M. Cococcioni, D. A. Scherlis and N. Marzari, Phys. Rev. Lett., 2006, 97, 103001 CrossRef PubMed.
- I. Timrov, N. Marzari and M. Cococcioni, Phys. Rev. B, 2021, 103, 045141 CrossRef CAS.
- G. Moynihan, G. Teobaldi and D. D. O'Regan, Presented in Part at the APS March Meeting Abstracts, 2016 Search PubMed.
- E. B. Linscott, D. J. Cole, M. C. Payne and D. D. O'Regan, Phys. Rev. B, 2018, 98, 235157 CrossRef CAS.
- S. Winczewski, J. Dziedzic, T. Miruszewski, J. Rybicki and M. Gazda, J. Phys. Chem. C, 2022, 126, 18439–18465 CrossRef CAS.
- M. Kick, K. Reuter and H. Oberhofer, J. Chem. Theory Comput., 2019, 15, 1705–1718 CrossRef CAS PubMed.
- B. J. Morgan and G. W. Watson, J. Phys. Chem. C, 2010, 114, 2321–2328 CrossRef CAS.
- A. C. Burgess, E. Linscott and D. D. O'Regan, Phys. Rev. B, 2023, 107, L121115 CrossRef CAS.
- A. J. Cohen, P. Mori-Sánchez and W. Yang, J. Chem. Phys., 2008, 129, 121104 CrossRef PubMed.
- S. L. Dudarev, G. A. Botton, S. Y. Savrasov, C. J. Humphreys and A. P. Sutton, Phys. Rev. B:Condens. Matter Mater. Phys., 1998, 57, 1505–1509 CrossRef CAS.
- B. Himmetoglu, R. M. Wentzcovitch and M. Cococcioni, Phys. Rev. B:Condens. Matter Mater. Phys., 2011, 84, 115108 CrossRef.
- O. K. Orhan and D. D. O'Regan, Phys. Rev. B, 2020, 101, 245137 CrossRef CAS.
- D. S. Lambert and D. D. O'Regan, Phys. Rev. Res., 2023, 5, 013160 CrossRef CAS.
- J. L. Lyons and C. G. Van de Walle, npj Comput. Mater., 2017, 3, 12 CrossRef.
- A. Janotti, J. B. Varley, P. Rinke, N. Umezawa, G. Kresse and C. G. Van De Walle, Phys. Rev. B:Condens. Matter Mater. Phys., 2010, 81, 085212 CrossRef.
- G. A. Baraff and M. Schlüter, Phys. Rev. B:Condens. Matter Mater. Phys., 1984, 30, 3460–3469 CrossRef CAS.
- D. S. Lambert, S. T. Murphy, A. Lennon and P. A. Burr, RSC Adv., 2017, 7, 53810–53821 RSC.
- S. T. Murphy and N. D. Hine, Chem. Mater., 2014, 26, 1629–1638 CrossRef CAS.
- N. Hine, K. Frensch, W. Foulkes and M. Finnis, Phys. Rev. B:Condens. Matter Mater. Phys., 2009, 79, 024112 CrossRef.
- N. E. Kirchner-Hall, W. Zhao, Y. Xiong, I. Timrov and I. Dabo, Appl. Sci., 2021, 11, 2395 CrossRef CAS.
- I. Timrov, N. Marzari and M. Cococcioni, Phys. Rev. B, 2018, 98, 085127 CrossRef.
- L. MacEnulty and D. D. O’Regan, Phys. Rev. B, 2023, 108, 245137 CrossRef CAS.
- N. E. Kirchner-Hall, W. Zhao, Y. Xiong, I. Timrov and I. Dabo, Appl. Sci., 2021, 11, 2395 CrossRef CAS.
- G. C. Moore, M. K. Horton, E. Linscott, A. M. Ganose, M. Siron, D. D. O’Regan and K. A. Persson, Phys. Rev. Mater., 2024, 8, 014409 CrossRef CAS.
- C. Freysoldt, B. Grabowski, T. Hickel, J. Neugebauer, G. Kresse, A. Janotti and C. G. Van De Walle, Rev. Mod. Phys., 2014, 86, 253–305 CrossRef.
- S. Murphy, M. Cooper and R. Grimes, Solid State Ionics, 2014, 267, 80–87 CrossRef CAS.
- P. Giannozzi, S. Baroni, N. Bonini, M. Calandra, R. Car, C. Cavazzoni, D. Ceresoli, G. L. Chiarotti, M. Cococcioni, I. Dabo, A. Dal Corso, S. de Gironcoli, S. Fabris, G. Fratesi, R. Gebauer, U. Gerstmann, C. Gougoussis, A. Kokalj, M. Lazzeri, L. Martin-Samos, N. Marzari, F. Mauri, R. Mazzarello, S. Paolini, A. Pasquarello, L. Paulatto, C. Sbraccia, S. Scandolo, G. Sclauzero, A. P. Seitsonen, A. Smogunov, P. Umari and R. M. Wentzcovitch, J. Phys.: Condens. Matter, 2009, 21, 395502 CrossRef PubMed.
- A. Dal Corso, Comput. Mater. Sci., 2014, 95, 337–350 CrossRef CAS.
- H. J. Monkhorst and J. D. Pack, Phys. Rev. B: Solid State, 1976, 13, 5188 CrossRef.
- J. L. Lyons, A. Janotti and C. G. Van De Walle, Microelectron. Eng., 2011, 88, 1452–1456 CrossRef CAS.
- J.-H. Hur, S. Park and U. I. Chung, J. Appl. Phys., 2012, 112, 113719 CrossRef.
- W. Lafargue-Dit-Hauret, R. Schira, C. Latouche and S. Jobic, Chem. Mater., 2021, 33, 2984–2992 CrossRef CAS.
- J.-H. Hur, Sci. Rep., 2020, 10, 5405 CrossRef.
- W.-J. Yin, B. Wen, C. Zhou, A. Selloni and L.-M. Liu, Surf. Sci. Rep., 2018, 73, 58–82 CrossRef CAS.
- S. Yang, L. E. Halliburton, A. Manivannan, P. H. Bunton, D. B. Baker, M. Klemm, S. Horn and A. Fujishima, Appl. Phys. Lett., 2009, 94, 162114 CrossRef.
- C. Lin, D. Shin and A. A. Demkov, J. Appl. Phys., 2015, 117, 225703 CrossRef.
- A. Malashevich, M. Jain and S. G. Louie, Phys. Rev. B:Condens. Matter Mater. Phys., 2014, 89, 075205 CrossRef.
Footnote |
| † Electronic supplementary information (ESI) available. See DOI: https://doi.org/10.1039/d4ra07774a |
| This journal is © The Royal Society of Chemistry 2024 |

