 Open Access Article
High-temperature oxidation kinetics of nanostructured thermoelectric skutterudite CoSb3 under different environments†
T. C. Anusree and
Anuj A. Vargeese *
*
Laboratory for Energetic and Energy Materials Research, Department of Chemistry, National Institute of Technology Calicut, Kozhikode 673601, India. E-mail: aav@nitc.ac.in
First published on 11th December 2024
Abstract
Skutterudite CoSb3 is an n-type thermoelectric material used in thermoelectric generators (TEGs) to recover and convert heat from various sources into electricity. For TEGs, such as CoSb3, thermal stability is crucial, especially when exposed to high temperatures and varying environments. To synthesize high-purity nanostructured CoSb3, an optimized solvothermal method was developed with detailed investigation of the influence of stoichiometry, solvent choice, and reaction duration on the formation mechanism, as revealed by Powder X-ray diffraction (PXRD). The thermal degradation behavior of the synthesized CoSb3 was systematically analyzed in air and nitrogen atmosphere. The oxidation products were identified using PXRD, the microstructural changes and morphological evolution during oxidation were examined using SEM (Scanning Electron Microscopy) and TEM (Transmission Electron Microscopy). Oxidation kinetics were determined using a nonlinear integral isoconversional method. This study revealed the formation of multiple oxides of Co and Sb at higher temperature and interconversion of these oxides after secondary reaction and follows a different kinetics in air and N2 atmosphere due to the changes in the degradation mechanism.
Introduction
Thermoelectric generators (TEG) have emerged as a promising solution to combat the global energy crisis because of their ability to directly convert heat to electricity and recover energy lost as heat from various sources.1,2 These TEGs can efficiently recover heat from sources such as industrial processes, power plants, exhaust pipes, and internal combustion (IC) engines of automobiles to reduce gas emissions and control global warming. The tunable figure of merit (zT), mechanical stability, and affordability makes CoSb3 an ideal thermoelectric (TE) material for efficient heat recovery in automotive exhaust pipes through planar and tubular ring-shaped TEGs.3–5 CoSb3, with its skutterudite structure belonging to the cubic space group Im![[3 with combining macron]](https://www.rsc.org/images/entities/char_0033_0304.gif) features intrinsic voids that allow the insertion of foreign atoms. These foreign atoms act as rattling centers, thereby scattering lattice phonons to reduce thermal conductivity and enhance TE efficiency.6,7 Hence, filled skutterudite structures possess immense potential for performance enhancement, attracting wide research attention with extensive studies actively exploring such possibilities.8–11
features intrinsic voids that allow the insertion of foreign atoms. These foreign atoms act as rattling centers, thereby scattering lattice phonons to reduce thermal conductivity and enhance TE efficiency.6,7 Hence, filled skutterudite structures possess immense potential for performance enhancement, attracting wide research attention with extensive studies actively exploring such possibilities.8–11
CoSb3 can be synthesized through feasible chemical methods such as sol–gel,12 polyol,13 and solvothermal methods14 utilising CoCl2·6H2O and SbCl3 as precursors. Among these methods, the solvothermal method offers feasible low-temperature synthesis in addition to cost efficiency. The solvothermal method yields highly crystalline compounds and facilitates easy tuning of the morphology of the materials. However, one of the drawbacks of using the solvothermal method for CoSb3 synthesis is the formation of the side products CoSb2 and Sb.14,15 To address this issue we optimized the solvothermal method by tuning parameters such as reactant concentration, reaction duration, and solvent choice to synthesize high-purity CoSb3. CoSb3 is intended for use in the 150–600 °C region and thermal stability in this region is a crucial requirement for its application in various devices.16,17 CoSb3 remains thermally stable up to 400 °C, above this temperature, the oxidation of CoSb3 and sublimation of the resulting Sb leads to degradation of the material. Above 400 °C, the possibility of formation of compounds such as Co3O4, CoO, Sb2O3, Sb2O4, Sb2O5, Sb6O13, and higher oxides such as CoSb2O6 and CoSb2O4 leads to a complicated Co–Sb–O phase system in the working temperature range.18 However, a thermoelectric material should be stable in the operational temperature range without losing its stoichiometry or integrity.
According to the literature, when CoSb3 synthesized by spark plasma sintering is aged at high temperatures, it forms two-layered oxide films comprising antimony oxides and cobalt-antimony oxides. The thickness of these films increases as the temperature rises from 500 °C to 700 °C.17,19 Further studies showed that CoSb3 oxidation followed a parabolic rate law and the activation energy for oxidation was calculated as 37.4 kJ mol−1.18 In a helium atmosphere, CoSb3 decomposed in multiple stages, beginning at 420 °C.20 The activation energy of CoSb3 decomposition in an argon atmosphere was reported to be 200 kJ mol−1.21 The thermal stability and decomposition kinetics of CoSb3 and filled CoSb3 synthesized using methods such as spark plasma sintering, ball milling,22 and annealing23 have been well-studied, whereas studies on the thermal stability and decomposition of CoSb3 synthesized by the solvothermal method are relatively scarce. The solvothermal method is an efficient method for the synthesis of CoSb3 highlighting the need to study the thermal stability and decomposition kinetics of CoSb3 synthesized using the solvothermal method.
We evaluated the thermal stability, degradation mechanism, and kinetics of CoSb3 in air and nitrogen (N2) atmospheres over a temperature range of 30–700 °C using thermogravimetric analysis (TGA). Weight gain followed by weight loss was observed in the thermogravimetric analysis, necessitating a detailed study of the underlying processes. TGA was performed in air at various heating rates and the underlying kinetics of these processes were studied using a nonlinear integral isoconversional method. The probable processes and microstructural changes in this region were investigated using Powder X-ray diffraction (PXRD), Scanning Electron Microscopy (SEM), and Transmission Electron Microscopy (TEM).
Experimental methods
Materials
Cobalt chloride hexahydrate (CoCl2·6H2O), antimony trichloride (SbCl3), and sodium borohydride (NaBH4) used for the synthesis were obtained from SRL Pvt. Ltd, and methanol (CH3OH) was obtained from Thermo Fisher India Pvt. Ltd. All chemicals were used without further purification.Synthesis of high-purity CoSb3 nanostructures
The solvothermal method was optimized for the synthesis of high-purity CoSb3 nanostructures (CNS).14 The precursors, cobalt chloride hexahydrate (CoCl2·6H2O) and antimony trichloride (SbCl3) were dissolved in 10 mL ethanol at various concentrations. NaBH4 dissolved in 5 mL of deionized (DI) water was added dropwise to the precursor solution and the reaction was allowed to continue for 15 min. The obtained suspension was transferred to a PPL-lined autoclave and heated to the desired temperature in a muffle furnace. The stoichiometric ratio of the precursors, reaction duration, and solvents were systematically varied to obtain high-purity nanostructured CoSb3. The products obtained were washed thoroughly with water and ethanol, dried at 100 °C for 5 h, and used for further analysis.Structural characterization
PXRD analysis of the synthesized CoSb3 nanostructures was carried out using a Malvern Panalytical X'Pert3 X-ray diffractometer between 2θ values of 20° and 70° at a step size of 0.013° using Cu Kα (1.54 Å) radiation. The data were analyzed using the X'Pert HighScore Plus software with the International Centre for Diffraction Data (ICDD) database. The detailed internal structure, including the crystal structure and orientation, was analyzed by TEM. TEM images were recorded on a JEOL JEM F200 transmission electron microscope with the samples dispersed in methanol and drop-cast over carbon-coated copper TEM grids. The particle size and SAED patterns were analyzed using Gatan Digital Microscopy Suite software.Surface characterisation
The surface morphologies of the particles were analyzed using SEM. SEM images were recorded using a ZEISS Gemini 1 Sigma 300 scanning electron microscope. To record SEM images of the CNS, the sample was dispersed in methanol and drop casted onto a glass slide. A high-resolution secondary electron image of CNS was obtained using an in-lens detector placed inside the electron column. The particle size was determined from the SEM images using ImageJ software. X-ray Photoelectron Spectroscopy (XPS) was performed using a Shimadzu Axis Supra+, X-ray Photoelectron Spectrometer equipped with a microfocused monochromatic Al Kα source (hν = 1486.6 eV). The C 1s peak (284.8 eV) was used as the reference peak, and data deconvolution was performed using XPSPeak41 software.Thermal stability analysis
The thermal stability of the synthesized compounds was studied using TGA. TGA experiments were performed on a TA Instruments Q50 Thermogravimetric Analyzer in the temperature range of 30 to 700 °C at a heating rate of 10 °C min−1 under air and N2 atmosphere.Kinetic analysis
A nonlinear integral isoconversional (model-free) method, Vyazovkin's method, was employed for the computation of kinetic parameters and kinetic analysis. The third-degree approximation proposed by Senum and Yang24 was used in this study to evaluate the integral in Vyazovkin's method. The detailed kinetic computation procedures are provided in the ESI.† For the kinetic calculations, the TGA data obtained under an air flow (40 mL min−1) at heating rates of 4, 6, 8, and 10 °C min−1 were utilized. In all experiments, approximately 1.5 mg sample was loaded into a platinum pan and heated at the desired heating rates.Residue analysis
The TG analysis residue in air and N2 atmosphere was collected at different stages, such as the sample heated up to the temperature of maximum weight gain, the sample heated to the temperature of maximum weight loss, and the sample heated up to 700 °C. The SEM images of residue samples were recorded using powder samples, and PXRD analysis was performed by maintaining a step size of 0.026 in the 2θ range of 20° to 70°.Results and discussions
Chemical synthesis and characterization of high-purity nanostructured CoSb3
Considering the theoretical stoichiometric ratio (1![[thin space (1/6-em)]](https://www.rsc.org/images/entities/char_2009.gif) :
:![[thin space (1/6-em)]](https://www.rsc.org/images/entities/char_2009.gif) 3), CoSb3 synthesis was initiated by mixing stoichiometric amounts of the precursors in 10 mL of ethanol. The reducing agent NaBH4 (nine equivalents) solution was added dropwise to the precursor solution. The obtained colloid was transferred to a PPL-lined autoclave and heated at 240 °C for 96 h. Analysis of the PXRD data (Fig. 1(a)) revealed that when the concentration was at a stoichiometric ratio (1
3), CoSb3 synthesis was initiated by mixing stoichiometric amounts of the precursors in 10 mL of ethanol. The reducing agent NaBH4 (nine equivalents) solution was added dropwise to the precursor solution. The obtained colloid was transferred to a PPL-lined autoclave and heated at 240 °C for 96 h. Analysis of the PXRD data (Fig. 1(a)) revealed that when the concentration was at a stoichiometric ratio (1![[thin space (1/6-em)]](https://www.rsc.org/images/entities/char_2009.gif) :
:![[thin space (1/6-em)]](https://www.rsc.org/images/entities/char_2009.gif) 3), peaks corresponding to Sb (ICDD 01-085-1322) and CoSb3 (ICDD 01-078-0976) were observed.
3), peaks corresponding to Sb (ICDD 01-085-1322) and CoSb3 (ICDD 01-078-0976) were observed.
As shown in Scheme 1, the formation of CoSb3 proceeds in several steps, starting with the reduction of the Co and Sb precursors, which subsequently leads to the formation of CoSb2 and CoSb3. Assuming the excess concentration of SbCl3 as a probable cause of Sb formation, the concentration of SbCl3 was varied in a series of reactions with Co![[thin space (1/6-em)]](https://www.rsc.org/images/entities/char_2009.gif) :
:![[thin space (1/6-em)]](https://www.rsc.org/images/entities/char_2009.gif) Sb ratios of 1
Sb ratios of 1![[thin space (1/6-em)]](https://www.rsc.org/images/entities/char_2009.gif) :
:![[thin space (1/6-em)]](https://www.rsc.org/images/entities/char_2009.gif) x (x = 2.5, 2.75, 2.8, and 3). The details of the stoichiometric ratio variations are presented in Table 1. All obtained samples were characterized using PXRD for phase identification and purity confirmation. The diffraction pattern revealed the presence of the CoSb2 impurity phase (ICDD 00-029-0126) in all samples.
x (x = 2.5, 2.75, 2.8, and 3). The details of the stoichiometric ratio variations are presented in Table 1. All obtained samples were characterized using PXRD for phase identification and purity confirmation. The diffraction pattern revealed the presence of the CoSb2 impurity phase (ICDD 00-029-0126) in all samples.
 | ||
| Scheme 1 A probable mechanism for the stepwise formation of CoSb3 from its constituents.15 | ||
| Concentration (in equivalents) | Temperature | Reaction duration | ||
|---|---|---|---|---|
| CoCl2·6H2O | SbCl3 | NaBH4 | ||
| 1 | 2.5 | 9 | 240 °C | 96 hours |
| 1 | 2.75 | 9 | 240 °C | 96 hours |
| 1 | 2.8 | 9 | 240 °C | 96 hours |
| 1 | 3 | 9 | 240 °C | 96 hours |
Given the potent reducing power of NaBH4, its addition immediately triggered rapid reduction of CoCl2 and SbCl3 to generate Co0 and Sb0. The significant decrease in the number of peaks of CoSb2 from 1![[thin space (1/6-em)]](https://www.rsc.org/images/entities/char_2009.gif) :
:![[thin space (1/6-em)]](https://www.rsc.org/images/entities/char_2009.gif) 2.5 equivalents to 1
2.5 equivalents to 1![[thin space (1/6-em)]](https://www.rsc.org/images/entities/char_2009.gif) :
:![[thin space (1/6-em)]](https://www.rsc.org/images/entities/char_2009.gif) 2.75 equivalents shows a greater extent of reaction between CoSb2 and Sb with increasing concentration of SbCl3. Hence, the analysis indicated that the reaction between CoSb2 and Sb (R4, Scheme 1) controls the formation of CoSb3. Upon further increasing the SbCl3 concentration from 2.75 to 2.8 equivalents the intensity of the CoSb2 peaks decreased (Fig. 1(b)). The appearance of CoSb2 peaks from 2.5 to 2.8 equivalents indicates that SbCl3 is the limiting reactant. As Sb impurities were detected at 1
2.75 equivalents shows a greater extent of reaction between CoSb2 and Sb with increasing concentration of SbCl3. Hence, the analysis indicated that the reaction between CoSb2 and Sb (R4, Scheme 1) controls the formation of CoSb3. Upon further increasing the SbCl3 concentration from 2.75 to 2.8 equivalents the intensity of the CoSb2 peaks decreased (Fig. 1(b)). The appearance of CoSb2 peaks from 2.5 to 2.8 equivalents indicates that SbCl3 is the limiting reactant. As Sb impurities were detected at 1![[thin space (1/6-em)]](https://www.rsc.org/images/entities/char_2009.gif) :
:![[thin space (1/6-em)]](https://www.rsc.org/images/entities/char_2009.gif) 3 reactant ratio (Fig. 1(c)), we optimized the stoichiometric ratio of 1
3 reactant ratio (Fig. 1(c)), we optimized the stoichiometric ratio of 1![[thin space (1/6-em)]](https://www.rsc.org/images/entities/char_2009.gif) :
:![[thin space (1/6-em)]](https://www.rsc.org/images/entities/char_2009.gif) 2.8 equivalents of reactants to achieve high-purity CNS.
2.8 equivalents of reactants to achieve high-purity CNS.
To further optimize the reaction and understand the influence of the reaction duration on the formation of CoSb3, the reaction was carried out for different durations using a precursor ratio of 1![[thin space (1/6-em)]](https://www.rsc.org/images/entities/char_2009.gif) :
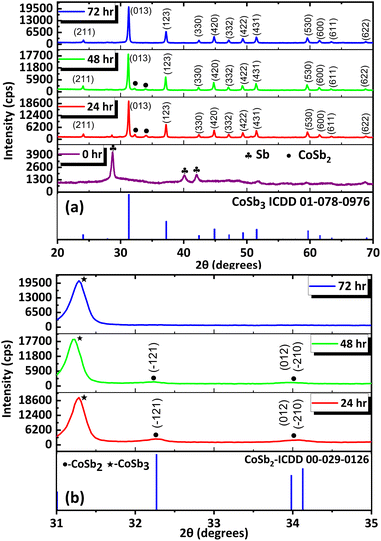
:![[thin space (1/6-em)]](https://www.rsc.org/images/entities/char_2009.gif) 2.8 which resulted in a minimal amount of impurities. The products formed immediately after the addition of NaBH4 (at RT) and from the set of reactions performed at 240 °C for various durations (24, 48, 72, and 96 h) were analyzed using PXRD (Fig. 2(a)). The data for the precipitate obtained immediately after the addition of NaBH4 showed peaks of Sb (ICDD 01-085-1324), indicating the immediate reduction of SbCl3. The Cobalt ions resulting from the reduction of CoCl2 may be present in the dissolved state in the solvent because peaks corresponding to cobalt or other intermediate compounds of cobalt were absent in the PXRD data. Further analysis revealed that CoSb3 (ICDD 01-078-0976) was formed after 24 h along with the major impurity phase CoSb2 (ICDD 00-029-0126) (Fig. 2(b)). Similar results were observed when the reaction duration was increased to 48 h. Furthermore, when the reaction duration was increased to 72 h, all the peaks corresponded to pure CoSb3. This indicates that, within 72 h, reaction equilibrium was achieved between Sb (0) and CoSb2 for their combination to form CoSb3. Consequently, pure CoSb3 nanostructures were obtained using a precise stoichiometric ratio of 1
2.8 which resulted in a minimal amount of impurities. The products formed immediately after the addition of NaBH4 (at RT) and from the set of reactions performed at 240 °C for various durations (24, 48, 72, and 96 h) were analyzed using PXRD (Fig. 2(a)). The data for the precipitate obtained immediately after the addition of NaBH4 showed peaks of Sb (ICDD 01-085-1324), indicating the immediate reduction of SbCl3. The Cobalt ions resulting from the reduction of CoCl2 may be present in the dissolved state in the solvent because peaks corresponding to cobalt or other intermediate compounds of cobalt were absent in the PXRD data. Further analysis revealed that CoSb3 (ICDD 01-078-0976) was formed after 24 h along with the major impurity phase CoSb2 (ICDD 00-029-0126) (Fig. 2(b)). Similar results were observed when the reaction duration was increased to 48 h. Furthermore, when the reaction duration was increased to 72 h, all the peaks corresponded to pure CoSb3. This indicates that, within 72 h, reaction equilibrium was achieved between Sb (0) and CoSb2 for their combination to form CoSb3. Consequently, pure CoSb3 nanostructures were obtained using a precise stoichiometric ratio of 1![[thin space (1/6-em)]](https://www.rsc.org/images/entities/char_2009.gif) :
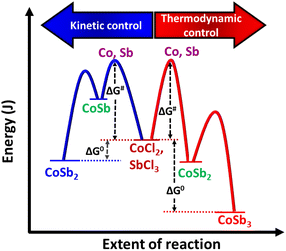
:![[thin space (1/6-em)]](https://www.rsc.org/images/entities/char_2009.gif) 2.8 equivalents of the reactants at 72 h. These observations indicate that the reaction between Co and Sb to form CoSb3 is thermodynamically controlled, whereas CoSb2 formation is kinetically controlled (Scheme 2). The formation of CoSb3 in small quantities at low Sb stoichiometries further confirms that the formation of CoSb3 is thermodynamically controlled.
2.8 equivalents of the reactants at 72 h. These observations indicate that the reaction between Co and Sb to form CoSb3 is thermodynamically controlled, whereas CoSb2 formation is kinetically controlled (Scheme 2). The formation of CoSb3 in small quantities at low Sb stoichiometries further confirms that the formation of CoSb3 is thermodynamically controlled.
The effect of the solvent on the synthesis was studied under similar reaction conditions (1![[thin space (1/6-em)]](https://www.rsc.org/images/entities/char_2009.gif) :
:![[thin space (1/6-em)]](https://www.rsc.org/images/entities/char_2009.gif) 2.8 equivalents of precursors) and NaBH4 (9 equivalents as reducing agent) using ethanol and methanol as the solvents at 240 °C for 72 h. Similar outcomes were anticipated because the critical temperatures of ethanol and methanol (240.75 and 239.45 °C respectively) lie nearby. However, the PXRD (Fig. 3) data of the compounds showed that while the reaction using ethanol yielded CoSb3 (ICDD 01-078-0976), the reaction using methanol yielded CoSb2 (ICDD 00-029-0126) as the major phase along with small amounts of CoSb3. The coexistence of the CoSb2 and CoSb3 phases when methanol was used as a solvent indicated that the rate of conversion of CoSb2 to CoSb3 was retarded. The higher polarity of methanol compared to ethanol stabilizes the CoSb2 surface which in turn delays its conversion to CoSb3. Further optimization is required to achieve the complete conversion of CoSb2 to CoSb3 when using methanol as the reaction medium.
2.8 equivalents of precursors) and NaBH4 (9 equivalents as reducing agent) using ethanol and methanol as the solvents at 240 °C for 72 h. Similar outcomes were anticipated because the critical temperatures of ethanol and methanol (240.75 and 239.45 °C respectively) lie nearby. However, the PXRD (Fig. 3) data of the compounds showed that while the reaction using ethanol yielded CoSb3 (ICDD 01-078-0976), the reaction using methanol yielded CoSb2 (ICDD 00-029-0126) as the major phase along with small amounts of CoSb3. The coexistence of the CoSb2 and CoSb3 phases when methanol was used as a solvent indicated that the rate of conversion of CoSb2 to CoSb3 was retarded. The higher polarity of methanol compared to ethanol stabilizes the CoSb2 surface which in turn delays its conversion to CoSb3. Further optimization is required to achieve the complete conversion of CoSb2 to CoSb3 when using methanol as the reaction medium.
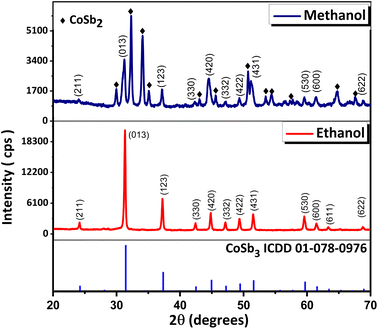 | ||
Fig. 3 PXRD pattern of products obtained in reactions using 1![[thin space (1/6-em)]](https://www.rsc.org/images/entities/char_2009.gif) : :![[thin space (1/6-em)]](https://www.rsc.org/images/entities/char_2009.gif) 2.8 equivalents of reactants for 72 h with ethanol and methanol as solvent. 2.8 equivalents of reactants for 72 h with ethanol and methanol as solvent. | ||
The SEM images of CoSb3 (Fig. 4(a) and S1†), reveal particles with various sizes and morphologies that are agglomerated, indicating accelerated nucleation and growth. Cassini oval-shaped particles with sizes ranging from 40 to 70 nm were observed along with plate-like particles with sizes ranging from 100 to 150 nm. Analysis of the SEM images (Fig. 4(b–d)) of particles at 24 h, 48 h, and 72 h showed an increase in the number of plate-like particles. This is due to the rapid growth of the initially formed cassini oval-shaped particles to plate-like particles by accumulating particles on their surface to reduce their surface energy.
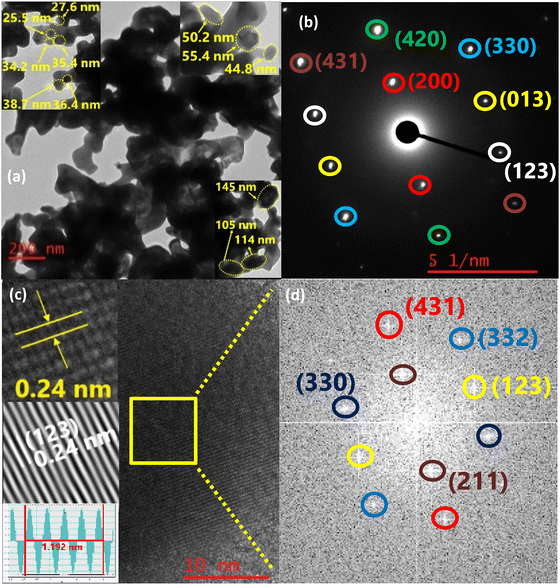
The TEM images of CoSb3 (Fig. 5(a) and S2†) also shows agglomerated particles. Cassini oval-shaped particles of size 25–55 nm along with plate-like particles of size 100–150 nm were observed. The SAED pattern (Fig. 5(b)) exhibited single crystalline behavior with a well-defined spot pattern. The planes with hkl values (200), (013), (123), (330), (420), and (431) with interplanar distances of 4.5 Å, 2.8 Å, 2.4 Å, 2.1 Å, 2 Å, and 1.7 Å respectively could be identified in the SAED pattern. Peaks corresponding to these planes are observed at 19.6°, 31.2°, 37.1°, 42.3°, and 51.5° in the PXRD pattern. The peak with the highest intensity in PXRD at 31.2°, followed by the next intense peak at 35.4° with hkl values of (013) and (123), could be traced in the SAED pattern. On determining the interplanar distance, spots in the FFT image (Fig. 5(d)) of the area shown in Fig. 5(c) correspond to the (211), (123), (330), (332), and (431) planes according to the ICDD 01-078-0976 pattern. The peaks of the planes (211) and (332) were observed at 24° and 47.1° in the PXRD pattern with interplanar distances of 3.6 Å and 1.9 Å respectively.
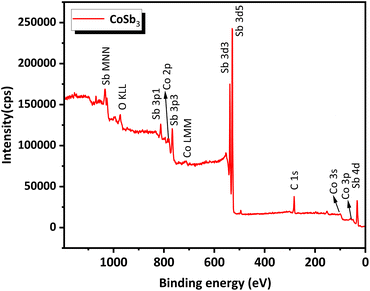
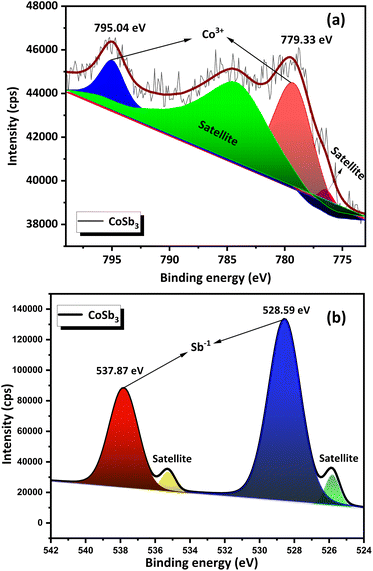
The survey scan XPS spectrum (Fig. 6) of the compound contained peaks corresponding to Co and Sb. The standard binding energy values for Co and Sb metals, according to the NIST X-ray Photoelectron Spectroscopy Database, are as follows, Co 2p3/2 – 778.15 eV, Co 2p1/2 – 793.30 eV, Sb 3d5/2 – 528.20 eV, and Sb 3d3/2 – 538.00 eV. High-resolution narrow-scan spectra of Co (Fig. 7(a)) exhibit peaks corresponding to the Co 2p3/2 state at 779.33 eV and Co 2p1/2 at 795.04 eV. This indicates that Co was present in the +3 oxidation state. Satellite peaks were present at 776.47 eV and 784.46 eV. Peaks corresponding to the Sb 3d5/2 and the Sb 3d3/2 were found in the narrow scan spectra of Sb (Fig. 7(b)) at 528.59 eV and 537.87 eV respectively. This indicated that Sb was present in the −1 oxidation state. Satellite peaks were found at 535.26 eV and 525.83 eV. The XPS data show that Co and Sb were in their oxidation states, corresponding to their stoichiometry. The XPS spectra of the compounds matched the previously reported data.25 An auger peak of oxygen (O KLL) arising from minor quantities of oxygen adsorbed on the CNS surface was observed in the survey scan XPS spectrum at 973.76 eV. The absence of peaks corresponding to the other oxidation states of Co and Sb in the narrow scan spectra indicated the formation of single-phase high-purity CoSb3, confirming the optimization procedure.
Thermal stability of CoSb3
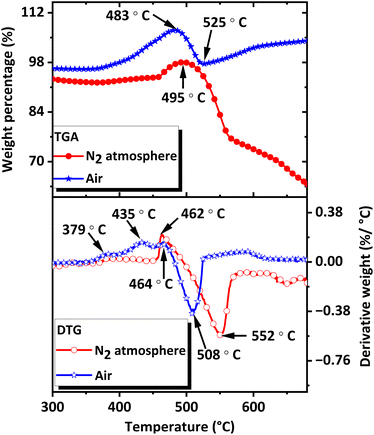
The thermal stability of the CNS was evaluated using TGA. The analysis was performed between 30 °C and 700 °C in air and N2 atmosphere using approximately 1.5 mg sample at a heating rate of 10 °C min−1.As shown in the TGA-Differential Thermogravimetry (TGA-DTG) plots (Fig. 8), CoSb3 is stable up to 455 °C under N2 atmosphere and up to 360 °C in air. In a N2 atmosphere, a weight gain was observed at 458 °C, indicating oxidation caused by trace amounts of oxygen present in the furnace and gas. The weight gain continued until 495 °C, after which the sample started to lose weight. The weight loss indicates the formation of volatile products from CoSb3 and oxidized products. In air, multistep weight gain occurred, with weight gain rates peaking at 379 °C, 435 °C, and 464 °C. The weight gain peak observed at 464 °C was followed by a weight loss peak at 508 °C. The more pronounced weight gain observed in air was attributed to the greater extent of oxidation in air. The multiple weight gains were attributed to the oxidation of CoSb3, Co, and Sb to form various oxides along with the formation of intermetallic compounds with oxygen. Oxidation was followed by weight loss, indicating the volatile nature of the decomposition products formed after the oxidation stage and the possible sublimation of Sb formed after the decomposition of CoSb3. Weight loss and decomposition is over at approximately 525 °C in air and around 567 °C in a N2 atmosphere. The products formed during and after the oxidation and decomposition stages were analyzed to determine the degradation mechanism of CoSb3 at elevated temperatures. The thermal stability of CNS in N2 atmosphere was further revealed by DTA (Fig. S5†), and DSC (Fig. S6†) curves.
Degradation mechanism and kinetic analysis
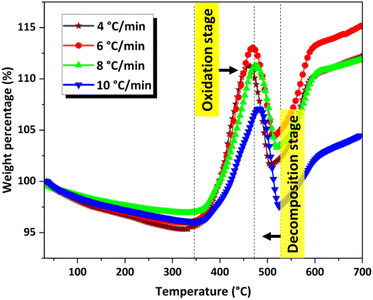
Details of the kinetic computations are provided in the ESI.† For the kinetic study, TGA analysis was performed at four different heating rates: 4 °C min−1, 6 °C min−1, 8 °C min−1, and 10 °C min−1 (Fig. 9) in air at a flow rate of 40 mL min−1 using approximately 1.5 mg of sample for each run. The corresponding DTG curves are shown in the ESI (Fig. S4).†The extent of conversion (α) was calculated from the weight change data obtained from TGA analysis using the equation α = (m0 − mt)/(m0 − mf). Where m0 is the initial mass, mt the mass at time t, and mf the final mass. The extent of conversion was calculated separately for the weight gain (oxidation stage from 360 to 480 °C) and weight loss (decomposition stage from 480 to 525 °C). The dependence of the extent of conversion of oxidation and the extent of conversion of degradation on temperature is shown in the ESI (Fig. S7 and S8).†
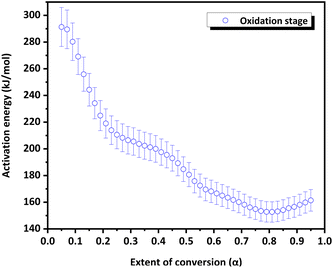
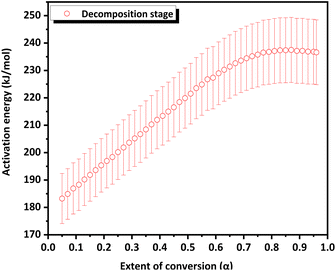
The variation in the apparent activation energy (Eα) with the extent of conversion (α) for oxidation is shown in Fig. 10 and the decomposition is shown in Fig. 11. Combined Eα vs. temperature curve and combined α vs. Eα curve for the oxidation and decomposition stages are given in the ESI (Fig. S9 and S10).† The data obtained were consistent with the reported data, where the activation energy for decomposition was 170–200 kJ mol−1.21 For the oxidation stage (Fig. 10), as the extent of conversion increases from 0.1 to 0.2, the activation energy decreased sharply from 273 kJ mol−1 to 223 kJ mol−1. Eα decreased gradually from 208 to 200 kJ mol−1 between 0.27 ≤ α ≥ 0.37. A steeper decrease was observed from 200 kJ mol−1 to 169 kJ mol−1 as α increased from 0.37 to 0.57. This was followed by a gradual decrease to 153 kJ mol−1 at α = 0.8, after which it increased slightly. The decrease in the activation energy for oxidation indicated the instability of CoSb3 in an oxygen-rich atmosphere. For the decomposition stage (Fig. 11) between 0.1 ≤ α ≥ 0.8, Eα increases uniformly. Beyond α = 0.8, Eα remained almost constant. The increase in the activation energy from 188 to 237 kJ mol−1 can be attributed to the interconversion of low-stability products formed during oxidation, to stable oxides.
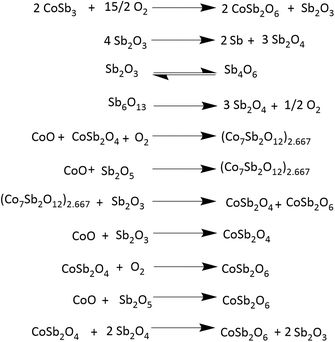
To gain more insight into the processes occurring, the residue from TG analysis in air and N2 atmosphere was collected at different stages. The first residue sample was collected after the TG analysis from room temperature to the temperature of maximum weight gain and is hereafter referred to as CNS-OA (CNS-oxidized residue, air) and CNS-ON (CNS-oxidized residue, N2 atmosphere). The second residue sample was collected after conducting TGA from room temperature to the temperature of maximum weight loss referred to hereafter as CNS-DA (CNS-degraded residue, air) and CNS-DN (CNS-degraded residue, N2 atmosphere), and the third residue sample after the complete run from room temperature to 700 °C, referred to hereafter as CNS-FA (CNS-full temperature range residue, air) and CNS-FN (CNS-full temperature range residue, N2 atmosphere). The PXRD analysis (Fig. 12) of CNS-OA showed peaks corresponding to CoSb3 (ICDD 01-078-0976), Sb2O5 (ICDD 00-050-1376), Sb2O4 (ICDD 01-073-1735), Co3O4 (ICDD 01-080-1533), (Co7Sb2O12)2.667 (ICDD 01-074-1857), and Sb2O3 (ICDD 00-042-1466). The PXRD data of CNS-ON (Fig. 13) sample showed peaks of CoSb2O6 (ICDD 01-084-2062), Sb2O5, Sb2O4, Co3O4, Sb2O3, Sb6O13 (ICDD 01-071-1091), and CoSb (ICDD 00-033-097). For CNS-DA, the peaks of all the compounds in CNS-OA, except CoSb3 and (Co7Sb2O12)2.667, were observed. CNS-DN exhibited peaks for all compounds present in CNS-ON except Sb6O13. Additionally, peaks corresponding to (Co7Sb2O12)2.667 and Sb4O6 were also observed in CNS-DN. The CNS-FA sample exhibited peaks corresponding to the higher oxides CoSb2O6, Sb2O5, and Sb2O4. Except for CoSb and Sb4O6, all compounds observed in CNS-DN were observed in CNS-FN. The absence of peaks corresponding to CoSb3 and (Co7Sb2O12)2.667 in CNS-DA indicates that the weight loss in the TGA curve corresponds to the direct decomposition of (Co7Sb2O12)2.667 and CoSb3, leading to the formation of volatile Sb. In the N2 atmosphere, the weight loss corresponds to the decomposition of CoSb3 and the conversion of Sb6O13 to Sb2O4. The formation of Sb4O6 in CNS-DN can be attributed to the dimerization of Sb2O3. The scarcity of oxygen in N2 atmosphere can act as a driving force for dimerization. As the temperature at which the TGA residues were collected increased from the temperature of maximum weight gain to the temperature of maximum weight loss and subsequently to 700 °C, the number of compounds observed in the TGA residue from air decreased, indicating rapid interconversion of the oxides formed. Co3O4 (consisting of Co2+ and Co3+) in CNS-DA was converted to CoO by the reduction of Co3+ to Co2+. The formed CoO and (Co7Sb2O12)2.667 combined with Sb oxides to form CoSb2O6. Furthermore, Sb2O3 loses volatile Sb to form a more stable, higher oxide Sb2O4. The presence of (Co7Sb2O12)2.667, Sb2O3, and Co3O4 in CNS-FN indicates that their conversion to the products obtained in CNS-FA (CoSb2O6, Sb2O5, and Sb2O4), as shown in Scheme 3, is restricted owing to the lack of oxygen. The formation of multiple oxides of Sb was attributed to its high affinity for oxygen. In addition, the formation of intermetallic oxides indicated that the oxidation of CoSb3 is a complex process involving parallel reactions. This indicates that multiple pathways occurred, which could have led to the formation of products observed in the PXRD pattern. Details of the products observed in the TGA residues are tabulated in the ESI (Table S1).†
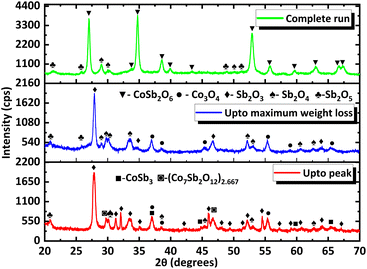 | ||
| Fig. 12 PXRD data of TGA residues obtained at different stages under air (the stages at which they are collected are provided in the corresponding PXRD pattern). | ||
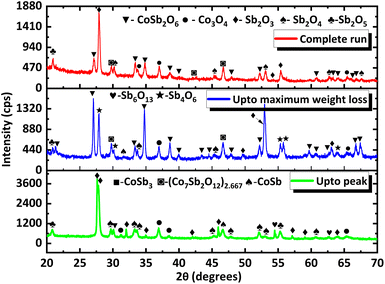 | ||
| Fig. 13 PXRD data of TGA residues obtained at different stages under a N2 atmosphere (the stages at which they are collected are provided in the corresponding PXRD pattern). | ||
To understand the microstructural changes and morphological modifications that occur in CoSb3 after degradation, SEM analysis of the residue was performed. SEM analysis revealed a significant change in the CNS morphology after thermal degradation. The change in size and morphology can be attributed to the various products formed during the TGA. After oxidation in air (Fig. 14(a) and S3(a)†), the particles agglomerated to form nearly spherical entities with sizes between 130 and 170 nm. The increased rate of nucleation of various phases upon exposure to high temperatures during the TG analysis led to the formation of spherical entities with increased particle size. The increased roughness of the surface of the particles compared with that of the CoSb3 surface is attributed to the multidirectional growth of CoSb2O6, which is the major phase in the TGA residue in air.26
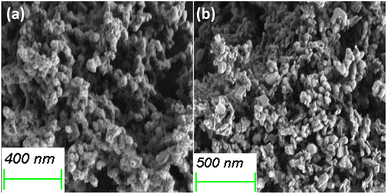 | ||
| Fig. 14 SEM images of the (a) TGA residue from room temperature to 700 °C in air and (b) N2 atmosphere. | ||
The SEM images of the TGA residue obtained under a N2 atmosphere, CNS-FN (Fig. 14(b) and S3(b)†) showed a non-uniform distribution of irregular spherical (115–180 nm) and plate-like (200–300 nm) particles. However, the particle surfaces are smooth, resembling those of CoSb3. Although CoSb2O6 was present to direct the growth of a rough surface, the other phases formed along with the change in atmosphere influenced the nucleation of particles with different morphologies and smooth surfaces.
In the TEM image of the TGA residue from the air, CNS-FA (Fig. 15(a) and S4†), the particles agglomerated, and the size and shape of the particles underwent a noticeable change. The particles appear as agglomerated nanospheres and nanoflakes. The particle sizes ranged from 100 to 300 nm. The SAED pattern (Fig. 15(b)) shows a spot pattern corresponding to the diffractions from single crystals of the various phases. The lattice planes of all the phases identified in the PXRD pattern can be traced to the SAED pattern. The planes with hkl values (220) and (222) belonged to Sb2O4 with an interplanar distance of 3.6 Å and 2.9 Å respectively. The planes of CoSb2O6, (110) and (103) had an interplanar distance of 3.2 Å and 2.5 Å. The (511) plane of Sb2O5 has an interplanar distance of 1.8 Å. For the TGA residue from the nitrogen atmosphere, CNS-FN (Fig. 16(a, b) and S4†), particles of various morphologies, such as nanorods (80–125 nm), nanospheres (40–90 nm), plate-like (40–60 nm), and irregular shapes were observed in the TEM image. A spot pattern corresponding to single crystals of various phases is observed in the SAED data. The planes of CoSb2O6, Sb2O3, and Sb2O5 are shown in Fig. 16(c) and of (Co7Sb2O12)2.667 and Sb2O4 in Fig. 16(d). The planes of CoSb2O6, (110), (114), and (310), have corresponding interplanar distances of 3.2, 1.8, and 1.4 Å. The (222) and (622) planes of Sb2O3 have an interplanar distance of 3.2 Å and 1.6 Å. The (111) plane belongs to Sb2O5 with an interplanar distance of 5.6 Å. In Fig. 16(d), the (220) plane belongs to (Co7Sb2O12)2.667 with an interplanar distance of 3 Å, and the (222) plane belongs to Sb2O4 with an interplanar distance of 2.9 Å.
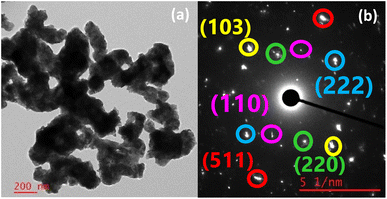 | ||
| Fig. 15 (a) TEM image and (b) SAED pattern of particles in the TGA residue from room temperature to 700 °C in air. | ||
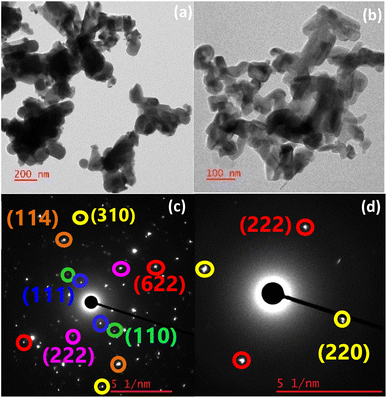 | ||
| Fig. 16 (a and b) TEM images of the particles with different morphologies in the TGA residue from room temperature to 700 °C in a N2 atmosphere and (c and d) SAED pattern. | ||
Based on the literature information27,28 and the present study, a probable oxidation and decomposition mechanism was derived, as shown in Scheme 3. Analysis of the TGA residue reinforced the results obtained from the kinetic analysis. The value of Eα decreases during the oxidation stage. The non-uniformity in the decrease in Eα could be due to the oxidation of various species occurring at different temperatures, indicating a decrease in the stability of the products formed during oxidation. However, the influence of the sublimation of volatile products, such as Sb, on the Eα value is apparent. The gradual increase in Eα beyond α = 0.8 can be due to the initiation of the decomposition of the products formed. During the decomposition stage, an increase in Eα was observed. The uniformity observed in the increase in Eα can be attributed to the lower number of species undergoing decomposition than oxidation. No further increase in Eα was observed beyond α = 0.8, as decomposition was almost complete.
Furthermore, the weight gain above 520 °C can be attributed to the formation of CoSb2O6 and interconversion of Sb oxides to Sb2O5 and Sb2O4. In addition, Sb sublimation, which occurs at approximately at 600 °C, further influences the reactions occurring in this temperature range. This indicates that the stability of CoSb3 decreases as the oxidation process advances and more stable oxidation products are formed at higher temperatures.
Conclusions
An optimized solvothermal synthesis of CoSb3 nanostructures (CNS) was developed by investigating the effects of reactant concentration, solvent, and reaction duration. The formation of CoSb3 proceeded through multiple steps, with SbCl3 identified as the limiting reactant during the optimization process. The formation of CoSb2 is kinetically controlled, whereas that of CoSb3 is thermodynamically controlled. CNS readily undergoes oxidation in air above 360 °C and above 455 °C in a nitrogen (N2) atmosphere. Thermogravimetric analysis (TGA) of the residues under N2 from room temperature to the point of maximum weight gain revealed the presence of CoSb2O6, Sb2O5, Sb2O4, Co3O4, Sb2O3, Sb6O13, and CoSb. Compared to the TGA residues in air, additional peaks corresponding to CoSb2O6, Sb6O13, and CoSb were observed in the N2 atmosphere. In air, the interconversion of oxides was rapid, as evidenced by the reduced number of compounds in the residues collected at temperatures increasing from the point of maximum weight gain to maximum weight loss and subsequently to 700 °C. In contrast, under N2, the interconversion was slower owing to limited oxygen availability. As the temperature increased from the point of maximum weight gain to the point of maximum weight loss in N2, peaks corresponding to Sb6O13 disappeared, while peaks for (Co7Sb2O12)2.667 and Sb4O6 emerged. This suggests that the weight loss in the TGA curve under N2 corresponds to the decomposition of CoSb3 and conversion of Sb6O13 to Sb2O4, with possible dimerization of Sb2O3, leading to the formation of Sb4O6. At 700 °C in N2, most compounds, except CoSb and Sb4O6, were consistent with those observed at the temperature of maximum weight loss, indicating the slow interconversion of oxides in a low-oxygen environment. These findings suggest the need to develop effective methods to prevent oxidation and suppress Sb sublimation to enable the efficient use of CNS in thermoelectric generators (TEGs) for mid-temperature applications. Although the higher polarity of methanol appears to stabilize the intermediate CoSb2 and influence the formation of CoSb3, further studies are needed to establish the specific role of methanol in CoSb3 formation.Data availability
Most of the data supporting the findings of this study are included in the ESI.† Additional data are available from the corresponding author upon reasonable request.Author contributions
The manuscript was written through the contributions of all authors.Conflicts of interest
There are no conflicts to declare.Acknowledgements
The authors thank the Science and Engineering Research Board [SERB/SRG/2021/001182], Defense Research and Development Organization [DRDO/ARMREB/HEM/2021/241], and FRG NIT Calicut for their financial support. The authors thank the University of Hyderabad for extending the TEM facility and the Centre for Materials Characterization (CMC)-NIT Calicut for the PXRD facility.References
- D. M. Rowe, CRC Handbook of Thermoelectrics, CRC Press, 1995 Search PubMed.
- K. Yin, L. Shi, Y. Zhong, X. Ma, M. Li and X. He, Phys. Chem. Chem. Phys., 2023, 25, 2517–2522 RSC.
- M. Rull-Bravo, A. Moure, J. F. Fernández and M. Martín-González, RSC Adv., 2015, 5, 41653–41667 RSC.
- O. Caballero-Calero, M. Rull-Bravo, D. Platzek, M. D. Cárdenas, R. Fernández, A. Moure, J. F. Fernández and M. Martín-González, Energy, 2021, 234, 121223 CrossRef CAS.
- M. Klein Altstedde, R. Sottong, O. Freitag, M. Kober, V. Dreißigacker, K. Zabrocki and P. Szabo, J. Electron. Mater., 2015, 44, 1716–1723 CrossRef CAS.
- G. P. Meisner, D. T. Morelli, S. Hu, J. Yang and C. Uher, Phys. Rev. Lett., 1998, 80, 3551–3554 CrossRef CAS.
- C. Bourgès, W. Zhang, K. K. Raut, Y. Owada, N. Kawamoto, M. Mitome, K. Kobayashi, J. F. Halet, D. Berthebaud and T. Mori, ACS Appl. Energy Mater., 2023, 6, 9646–9656 CrossRef.
- B. Feng, J. Xie, G. Cao, T. Zhu and X. Zhao, J. Mater. Chem. A, 2013, 1, 13111–13119 RSC.
- B. Wang, H. Jin, W. Yi, J. Chen, J. Li, Y. Zhao and J. Li, J. Alloys Compd., 2022, 909, 164733 CrossRef CAS.
- A. Gharleghi, Y. Liu, M. Zhou, J. He, T. M. Tritt and C. J. Liu, J. Mater. Chem. A, 2016, 4, 13874–13880 RSC.
- X. Shi, J. Yang, J. R. Salvador, M. Chi, J. Y. Cho, H. Wang, S. Bai, J. Yang, W. Zhang and L. Chen, J. Am. Chem. Soc., 2011, 133, 7837–7846 CrossRef CAS.
- Y. Chu, X. Tang, W. Zhao and Q. Zhang, Cryst. Growth Des., 2008, 8, 208–210 CrossRef CAS.
- L. Yang, H. H. Hng, H. Cheng, T. Sun and J. Ma, Mater. Lett., 2008, 62, 2483–2485 CrossRef CAS.
- J. L. Mi, X. B. Zhao, T. J. Zhu, J. P. Tu and G. S. Cao, J. Alloys Compd., 2006, 417, 269–272 CrossRef CAS.
- Y. Li, C. Li, B. Wang, W. Li and P. Che, J. Alloys Compd., 2019, 772, 770–774 CrossRef CAS.
- X. Xia, P. Qiu, X. Shi, X. Li, X. Huang and L. Chen, J. Electron. Mater., 2012, 41, 2225–2231 CrossRef CAS.
- E. Godlewska, K. Zawadzka, A. Adamczyk, M. Mitoraj and K. Mars, Oxid. Met., 2010, 74, 113–124 CrossRef CAS.
- D. Zhao, C. Tian, S. Tang, Y. Liu and L. Chen, J. Alloys Compd., 2010, 504, 552–558 CrossRef CAS.
- R. Hara, S. Inoue, H. T. Kaibe and S. Sano, J. Alloys Compd., 2003, 349, 297–301 CrossRef CAS.
- J. Leszczynski, K. T. Wojciechowski and A. L. Malecki, J. Therm. Anal. Calorim., 2011, 105, 211–222 CrossRef CAS.
- F. Wu, Q. He, D. Hu, F. Gao, H. Song, J. Jia and X. Hu, J. Electron. Mater., 2013, 42, 2574–2581 CrossRef CAS.
- F. Zelenka, J. Strádal, P. Brož, J. Vřešťál, J. Buršík, A. Zemanová, G. Rogl and P. Rogl, CALPHAD:Comput. Coupling Phase Diagrams Thermochem., 2021, 73, 102258 CrossRef CAS.
- D. K. Shin, I. H. Kim, K. H. Park, S. Lee and W. S. Seo, J. Electron. Mater., 2015, 44, 1858–1863 CrossRef CAS.
- G. I. Senum and R. T. Yang, J. Therm. Anal., 1977, 11, 445–447 CrossRef.
- A. P. Grosvenor, R. G. Cavell and A. Mar, Phys. Rev. B:Condens. Matter Mater. Phys., 2006, 74, 125102 CrossRef.
- H. Guillén-Bonilla, L. Gildo-Ortiz, M. De La, J. Santoyo-Salazar, V. M. Rodríguez-Betancourtt, A. Guillen-Bonilla and J. Reyes-Gómez, J. Nanomater., 2015, 2015, 308465 CrossRef.
- N. A. Asryan, A. S. Alikhanyan and G. D. Nipan, Inorg. Mater., 2004, 40, 626–631 CrossRef CAS.
- K. Swaminathan and O. M. Sreedharan, J. Mater. Sci., 2001, 36, 1031–1037 CrossRef CAS.
Footnote |
| † Electronic supplementary information (ESI) available. See DOI: https://doi.org/10.1039/d4ra08328h |
| This journal is © The Royal Society of Chemistry 2024 |

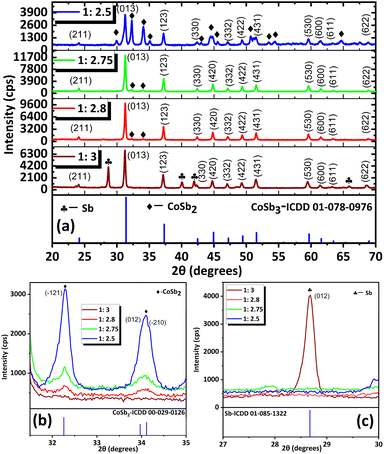
![[1 with combining macron]](https://www.rsc.org/images/entities/char_0031_0304.gif) 21), (012) and (
21), (012) and (![[2 with combining macron]](https://www.rsc.org/images/entities/char_0032_0304.gif) 10) peaks of CoSb2 and (c) 2
10) peaks of CoSb2 and (c) 2