 Open Access Article
At-line monitoring of hydrogen peroxide released from its photocatalytic and continuous synthesis†
Anders Ø.
Tjell‡
a,
Lars-Erik
Meyer‡
 b,
Barbara
Jud
a,
Selin
Kara
 bc and
Torsten
Mayr
 *a
*a
aInstitute of Analytical Chemistry and Food Chemistry, Graz University of Technology, Stremayrgasse 9/II, 8010, Graz, Austria. E-mail: torsten.mayr@tugraz.at
bInstitute of Technical Chemistry, Leibniz University Hannover, Callinstrasse 5, 30167 Hannover, Germany
cBiocatalysis and Bioprocessing Group, Department of Biological and Chemical Engineering, Aarhus University, Gustav Wieds Vej 10, 8000 Aarhus, Denmark
First published on 4th March 2024
Abstract
Providing hydrogen peroxide (H2O2) for enzyme-catalyzed reactions requires a careful balance between sufficient reactivity and toxicity. Herein, we demonstrate the photocatalytic synthesis of H2O2 in a continuous operation set-up using nitrogen-doped carbon nanodots (N-CNDs) and simultaneous determination of this in situ synthesis by continuous measurement with a novel developed H2O2 sensor.
Hydrogen peroxide (H2O2) is often used as an oxidizing agent in a variety of applications, e.g. wastewater treatment, industrial bleaching,1 or enzymatic bioreactors. In the latter, H2O2 participates in the reactions of peroxidases and peroxygenases,2 where two specific types of enzymes have received increased attention within recent years, namely lytic polysaccharide monooxygenases (LPMO),3,4 and unspecific peroxygenases (UPO).5,6
A promising way to supply H2O2 to biocatalyzed reactions is by generating it in situ. This has some advantages compared to an external supply, such as, no dilution of the reaction mixture, which might change reaction parameters. Furthermore, higher (local) concentrations of H2O2 at the inlet of a reactor can cause damage to the enzymes and affect their activity and stability. Additionally, in situ generation of H2O2 might present a more environmentally friendly and safe process compared to the conventional large scale production from oxidation of anthraquinone.2,7
In situ generation of H2O2 with a photocatalyst in a bioreactor is an elegant way to provide this delicate substrate on demand. H2O2 is produced with a photocatalyst from dissolved oxygen, and is subsequently used as co-substrate in an enzymatic reaction. In situ generation of H2O2 has previously been reported with enzymatic reactions,8 bioelectrocatalysts,2,7 or with photocatalysts, such as flavin,9 titanium dioxide, or graphite carbon nitride.2,7 In general, the use of light for biocatalysis and biocatalysis in flow are relatively new and expanding areas of research, and the advances in the field of photobiocatalysis,10 and flow biocatalysis can be found elsewhere.11
Here, we focused our efforts on nitrogen-doped carbon nanodots (N-CNDs) as a photocatalyst in dispersed phase.12,13 They are used for in situ photocatalytic generation of H2O2 in a glass capillary with a fixed illumination time, which serves as a model for a continuous plug-flow reactor. Thereby, the H2O2 production can be determined by quantification of H2O2 in the outlet.
Determination of H2O2 is a challenging task, and which method to use depends on the specific application. A common way is with an enzymatic assay, such as horseradish peroxidase.14,15 Though, these require sampling and are not suitable for continuous measurements. Alternatively, electrochemical sensors are suited for sustained measurements. However, they tend to lack selectivity due to a relatively high potential applied.16,17 Recently, we published an H2O2 sensor based on catalytic degradation and optical determination of produced oxygen (O2). The sensor can be operated at-line, and reliably down to one μM H2O2.18
In this short communication, we combined an at-line H2O2 sensor and photocatalytic generation of H2O2 in flow using N-CNDs. The synthesis of H2O2 is measured at two flow rates and four different light intensities.
Results and discussion
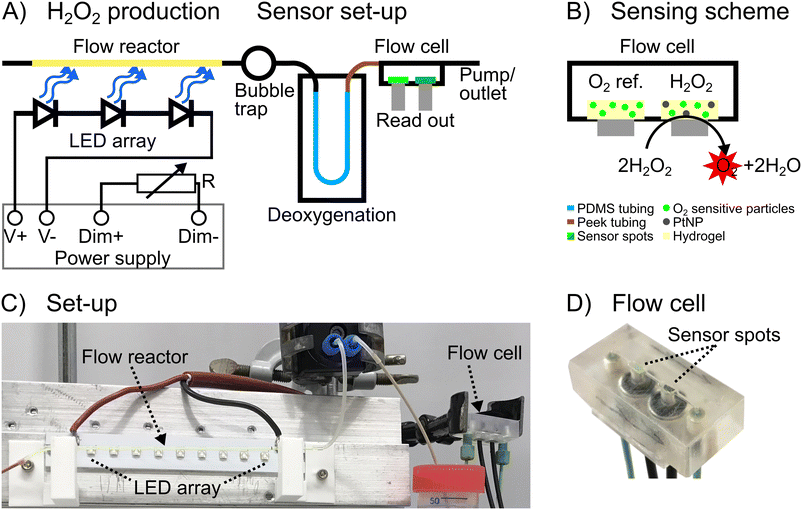
H2O2 is synthesized in a glass capillary (50 μL volume), which acts as a model for a plug-flow reactor, by illuminating an N-CND solution flowing through the column. H2O2 production is monitored with a connected flow cell with integrated luminescence sensor spots. The sensing scheme is based on the conversion of H2O2 to O2 and H2O using an immobilized inorganic catalysis (PtNP). The produced oxygen is determined by phosphorescent oxygen sensor particles, which are also embedded in the sensor spot (see Fig. 1B). The sample is deoxygenated before entering the sensor flow cell to increase the sensitivity of H2O2 sensing as previously described.18 A second sensor spot (without PtNP) is used as an O2 reference prior to the H2O2 detection. The difference between the two sensor spots (ΔpO2) is consequently the amount of O2 generated from the in situ synthesized H2O2.The sensor flow cell is operated at flow rates of 30 μL min−1 or 50 μL min−1. Increased H2O2 concentrations cause increased ΔpO2, due to a higher production of O2 at the H2O2 sensor spot (cf. Fig. S1A and C†), and are directly proportional as indicated in the calibration curves (cf. Fig. S1B and D†). The H2O2 sensor is fully reversible and shows no hysteresis. The response time of the sensor set-up (including retention time) is 5 or 3 min at flow rates of 30 or 50 μL min−1, respectively (Fig. S1A and C†).
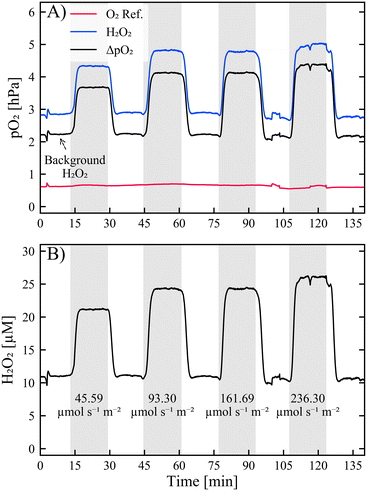
The sensor set-up is connected to an illuminated 50 μL glass capillary that serves as a model flow reactor with a 365 nm LED array. H2O2 is synthesized in the flow reactor by illuminating the dispersed N-CNDs (2.5% or 5% w/v), Fig. 1A. The residence time is fixed to 35 seconds by covering parts of the capillary to control the length. All of the following results are based on a residence time of 35 s. The light intensity is regulated with resistors of 10, 22, 47, and 82 kΩ, corresponding to photon counts of 45.59, 93.30, 161.69, and 236.30 μmol s−1 m−2, respectively. The set-up is conditioned with N-CND solution prior to measurements, which are performed by switching the LED light source on/off in 15 min cycles, corresponding to 26 residence times. The sensor response to a measurement at 30 μL min−1 with 2.5% w/v N-CNDs can be seen in Fig. 2A. Initially, the LED is off, and then switched on with different resistances, resulting in different light intensities (see above). This results in production of H2O2, which is measured by the sensor at 15 min. The H2O2 production reaches a steady state within a few minutes, and the H2O2 concentration returns to the background level of H2O2 at approx. 30 min, at which time point the LED is switched off.
 | ||
| Fig. 2 A) Sensor response with 2.5% N-CND solution at 30 μL min−1. ‘O2 ref.’ (red line) is the amount of DO measured at the O2 reference sensor spot, ‘H2O2’ is the amount of O2 measured at the H2O2 sensor spot, and ‘ΔpO2’ is the difference between the two sensor spots and the amount of produced O2. B) H2O2 concentrations calculated from ΔpO2 with the calibration curves in Fig. S1B and D.† The grey boxes indicate when the LED array is turned on, and the numbers are the photon counts in μmol photons per s m2. | ||
H2O2 is detected in the N-CND solution without illumination (cf.Fig. 2). This is likely caused by a background production of H2O2 from ambient light, for instance, during purification or preparation of the solutions. The ‘background H2O2’ is approx. double the amount at double the concentration of photocatalyst N-CNDs, Fig. S3.†
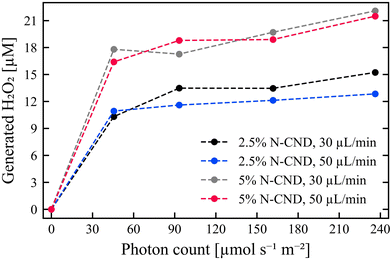
The synthesized amount of H2O2 (Fig. S3†) is calculated from the ΔpO2 and sensor calibrations. The amount of photogenerated H2O2 (Fig. 3) is obtained at each light intensity by subtracting the background H2O2. The general trend is that higher LED intensities produce larger amounts of H2O2. The difference in produced H2O2 between lowest photon count of 45.59 and highest photon count of 236.30 μmol s−1 m−2 (resistance of 10 kOhm to 82 kOhm, respectively) is approx. 5 μM for all measurements, except for 2.5% w/v of N-CNDs, with a flow rate of 30 μL min−1, where the difference is approx. 2 μM H2O2 (cf.Fig. 3).
 | ||
| Fig. 3 Amount of H2O2 produced with N-CND concentrations of 2.5 and 5%, and flow rates of 30 and 50 μL min−1. The values at each light intensity are averages of produced H2O2 with the background H2O2 subtracted. Sensor responses can be seen in Fig. S2 and S3.† | ||
There is little difference in the amount of H2O2 produced at different flow rates, due to the similar residence time, (cf.Fig. 3). Whereas, there is a greater influence of the N-CND concentration. It should be noted that the synthesis of H2O2 is not linear with the N-CND concentration or light intensity (including zero values). Overall, this indicates that the H2O2 synthesis is ‘saturated’ at the experimental conditions, which may also explain the relatively low effect of light intensity. When scaling up the system, however, the effect of light penetration depth should also be considered, as light intensity is inversely proportional to the square of the distance. Overall, the productivity of a photocatalytic system in flow set-up needs to be systematically analyzed to identify combinatory or conflicting effects of diverse operational conditions (catalyst amount, catalyst activity, residence time, wavelength of light, light intensity).19
The LED module develops heat during the experiments. This is confirmed by measuring the temperature with an optical temperature microsensor on the outside of the glass capillary. For that reason, we investigated whether the increased temperature causes autocatalytic synthesis of H2O2, by heating a 5% w/v N-CND solution in the absence of light (Fig. S4†). The increase in temperature did not cause synthesis of H2O2, since the ΔpO2 is stable when the temperature increases up to 80 °C. Therefore, we concluded that the H2O2 synthesis originates solely from the photocatalytic reaction catalyzed by N-CNDs. The N-CND solutions were further analyzed for bleaching during the measurements. UV-vis absorbance of the N-CND solutions was measured before and after light exposure (Fig. S4 and S5†). Neither the 2.5% w/v nor 5% w/v N-CND solutions showed photobleaching under the given conditions.
As mentioned by Battat, Weitz and Whitesides in a perspective article in 2022,20 new technologies will be purchased and utilized if they offer a decisive advantage over older technologies. The sensor's small size and simplicity can ensure its widespread use in the future, even beyond the academic interest. Recently, fed-batch addition of H2O2 for unspecific peroxygenase-catalyzed oxyfunctionalizations at 120 mL-scale reached the total turnover numbers up to 909![[thin space (1/6-em)]](https://www.rsc.org/images/entities/char_2009.gif) 000, the highest productivity reported so far.21 As consecutive steps of that technical demonstration, we believe that biotransformations using H2O2 as a (co)substrate can soon be scaled up. Moving from fed-batch operation to continuous set-up can provide several advantages ranging from selectivity (byproduct-to-product) to mass and heat transfer.22 In this context, precise monitoring of the inflow and outflow of H2O2 would be essential to have full process control.
000, the highest productivity reported so far.21 As consecutive steps of that technical demonstration, we believe that biotransformations using H2O2 as a (co)substrate can soon be scaled up. Moving from fed-batch operation to continuous set-up can provide several advantages ranging from selectivity (byproduct-to-product) to mass and heat transfer.22 In this context, precise monitoring of the inflow and outflow of H2O2 would be essential to have full process control.
This case study is currently the first of its kind. For the first time, we have been able to show that simultaneous synthesis and concentration measurement of H2O2 is possible. While some limitations and challenges need to be addressed in further studies, such as the restricted flow rate of a few milliliters per minute, this study marks a significant step forward in the field.
Conclusions
We have demonstrated the photocatalytic synthesis and monitoring of H2O2 in a continuously operated model flow reactor using N-CNDs as photocatalyst.The synthesis of H2O2 reaches a steady state within a few minutes of illumination with LED light sources and increases with light intensity and N-CND concentration. There is no effect of flow rate, with similar residence times between the two flow rates tested. Heating an N-CND solution in absence of light shows no production of H2O2, and it is therefore concluded that H2O2 is synthesized from N-CND photocatalysis. The N-CNDs show no photobleaching during measurements.
In general, our presented hydrogen peroxide sensor is well suited for flow-chemistry set-ups, but can also be applied in conventional batch reactors to measure H2O2 off-line or at-line and is a convenient alternative to enzymatic assays. We see potential applications in determining activity of H2O2 producing/consuming enzymes, H2O2 as a reactive oxygen species, and H2O2 in redox reactions. Our future experiments will be dedicated to coupling the developed set-up with UPOs for selective oxyfunctionalisations. We further envision the possibility of monitoring various bio- and non-bioprocesses relevant to both academia and industry.
In our future work, we will combine the photocatalytic system of in situ H2O2 synthesis and measurement with biocatalysis, such as enzymatic oxyfunctionalization in microfluidics. This will optimize the process through precise H2O2 monitoring and control.
Author contributions
The paper is conceptualized by A. Ø. T. and L.-E. M. Experimental work and data analysis are carried out by A. Ø. T. and B. J. The paper is written by A. Ø. T., L.-E. M., and T. M. The project was supervised by S. K. and T. M. All authors have approved the final version of the paper.Conflicts of interest
There are no conflicts to declare.Acknowledgements
This project has received funding from the European Union's Horizon 2020 research and innovation programme under the Marie Skłodowska-Curie (No. 812954). S. K. gratefully acknowledges the Independent Research Fund Denmark (PHOTOX-f project, Grant No. 9063-00031B) for the grant funding in the framework of Sapere Aude DFF-Starting Grant. The authors would like to thank Dr. Piera De Santis (Aarhus University) for the production of carbon nanodots and Dr. Markus Hobisch (Aarhus University) for his assistance with the experimental flow set-up.Notes and references
- R. Hage and A. Lienke, Applications of transition-metal catalysts to textile and wood-pulp bleaching, Angew. Chem., Int. Ed., 2005, 45, 206–222, DOI:10.1002/anie.200500525.
- H. L. Wapshott-Stehli and A. M. Grunden, In situ H2O2 generation methods in the context of enzyme biocatalysis, Enzyme Microb. Technol., 2021, 145, 109744, DOI:10.1016/j.enzmictec.2021.109744.
- B. Bissaro, A. Várnai, Å. K. Røhr and V. G. H. Eijsink, Oxidoreductases and Reactive Oxygen Species in Conversion of Lignocellulosic Biomass, Microbiol. Mol. Biol. Rev., 2018, 82, e00029-18, DOI:10.1128/MMBR.00029-18.
- G. Müller, P. Chylenski, B. Bissaro, V. G. H. Eijsink and S. J. Horn, The impact of hydrogen peroxide supply on LPMO activity and overall saccharification efficiency of a commercial cellulase cocktail, Biotechnol. Biofuels, 2018, 11, 209, DOI:10.1186/s13068-018-1199-4.
- D. T. Monterrey, A. Ménes-Rubio, M. Keser, D. Gonzalez-Perez and M. Alcalde, Unspecific peroxygenases: The pot of gold at the end of the oxyfunctionalization rainbow?, Curr. Opin. Green Sustainable Chem., 2023, 100786, DOI:10.1016/j.cogsc.2023.100786.
- M. Hobisch, D. Holtmann, P. Gomez de Santos, M. Alcalde, F. Hollmann and S. Kara, Recent developments in the use of peroxygenases – Exploring their high potential in selective oxyfunctionalisations, Biotechnol. Adv., 2020, 107615, DOI:10.1016/j.biotechadv.2020.107615.
- H. Hou, X. Zeng and X. Zhang, Production of Hydrogen Peroxide by Photocatalytic Processes, Angew. Chem., Int. Ed., 2020, 59, 17356–17376, DOI:10.1002/anie.201911609.
- E. Romero, M. J. Johansson, J. Cartwright, G. Grogan and M. A. Hayes, Oxalate Oxidase for In Situ H2O2-Generation in Unspecific Peroxygenase-Catalysed Drug Oxyfunctionalisations, Angew. Chem., 2022, 61, e202207831, DOI:10.1002/anie.202207831.
- E. Churakova, M. Kluge, R. Ullrich, I. Arends, M. Hofrichter and F. Hollmann, Specific photobiocatalytic oxyfunctionalization reactions, Angew. Chem., Int. Ed., 2011, 50, 10716–10719, DOI:10.1002/anie.201105308.
- L.-E. Meyer, B. E. Eser and S. Kara, Coupling light with biocatalysis for sustainable synthesis—very recent developments and future perspectives, Curr. Opin. Green Sustainable Chem., 2021, 31, 100496, DOI:10.1016/j.cogsc.2021.100496.
- P. De Santis, L.-E. Meyer and S. Kara, The rise of continuous flow biocatalysis – fundamentals, very recent developments and future perspectives, React. Chem. Eng., 2020, 5, 2155–2184, 10.1039/D0RE00335B.
- J. Kim, S. H. Lee, F. Tieves, S. Da Choi, F. Hollmann, C. E. Paul and C. B. Park, Biocatalytic C=C Bond Reduction through Carbon Nanodot-Sensitized Regeneration of NADH Analogues, Am. Ethnol., 2018, 130, 14021–14024, DOI:10.1002/ange.201804409.
- M. Hobisch, M. M. C. H. Schie, J. Kim, K. R. Andersen, M. Alcalde, R. Kourist, C. B. Park, F. Hollmann and S. Kara, Solvent-Free Photobiocatalytic Hydroxylation of Cyclohexane, ChemCatChem, 2020, 12, 4009–4013, DOI:10.1002/cctc.202000512.
- E. Pick and Y. Keisari, A simple colorimetric method for the measurement of hydrogen peroxide produced by cells in culture, J. Immunol. Methods, 1980, 38, 161–170, DOI:10.1016/0022-1759(80)90340-3.
- M. Zhou, Z. Diwu, N. Panchuk-Voloshina and R. P. Haugland, A stable nonfluorescent derivative of resorufin for the fluorometric determination of trace hydrogen peroxide: applications in detecting the activity of phagocyte NADPH oxidase and other oxidases, Anal. Biochem., 1997, 253, 162–168, DOI:10.1006/abio.1997.2391.
- W. Chen, S. Cai, Q.-Q. Ren, W. Wen and Y.-D. Zhao, Recent advances in electrochemical sensing for hydrogen peroxide: a review, Analyst, 2012, 137, 49–58, 10.1039/C1AN15738H.
- M. A. Riaz and Y. Chen, Electrodes and electrocatalysts for electrochemical hydrogen peroxide sensors: a review of design strategies, Nanoscale Horiz., 2022, 7, 463–479, 10.1039/D2NH00006G.
- A. Ø. Tjell, B. Jud, R. Schaller-Ammann and T. Mayr, Optical hydrogen peroxide sensor for measurements in flow, Sens. Actuators, B, 2024, 400, 134904, DOI:10.1016/j.snb.2023.134904.
- S. N. Chanquia, A. Valotta, H. Gruber-Woelfler and S. Kara, Photobiocatalysis in Continuous Flow, Front. Catal., 2022, 1 DOI:10.3389/fctls.2021.816538.
- S. Battat, D. A. Weitz and G. M. Whitesides, An outlook on microfluidics: the promise and the challenge, Lab Chip, 2022, 22, 530–536, 10.1039/d1lc00731a.
- M. Hobisch, P. De Santis, S. Serban, A. Basso, E. Byström and S. Kara, Peroxygenase-Driven Ethylbenzene Hydroxylation in a Rotating Bed Reactor, Org. Process Res. Dev., 2022, 26, 2761–2765, DOI:10.1021/acs.oprd.2c00211.
- L.-E. Meyer, B. F. Hauge, T. M. Kvorning, P. De Santis and S. Kara, Continuous oxyfunctionalizations catalyzed by unspecific peroxygenase, Catal. Sci. Technol., 2022, 12, 6473–6485, 10.1039/D2CY00650B.
Footnotes |
| † Electronic supplementary information (ESI) available: Experimental procedures and instrumentation, sensor calibrations, and additional results. See DOI: https://doi.org/10.1039/d3re00659j |
| ‡ These authors contributed equally. |
| This journal is © The Royal Society of Chemistry 2024 |

