 Open Access Article
A sequential lumped kinetic modelling approach for the co-pyrolysis of plastic mixtures with a heavy refinery intermediate product in a tubular reactor†
Sebastian-Mark
Lorbach
 *a,
Andreas E.
Lechleitner
b,
Teresa
Schubert
c and
Markus
Lehner
a
aChair of Process Technology and Industrial Environmental Protection, Montanuniversitaet Leoben, Franz-Josef-Straße 18, 8700 Leoben, Austria. E-mail: sebastian-mark.lorbach@unileoben.ac.at
bOMV Downstream GmbH, Mannswoerther Straße 28, 2320 Schwechat, Austria
cAIT Austrian Institute of Technology GmbH, Giefinggasse 4, 1210 Wien, Austria
First published on 10th April 2024
Abstract
The knowledge of reaction rates and reaction pathways is essential for the upscaling of laboratory- and pilot-sized plants to full scale industrial processes. Over the last decades lumped kinetic modelling became the standard modelling approach for cracking reactions of hydrocarbon blends. In this paper a sequential nine-lump kinetic model is developed. The model allows for a fully automatic calculation of the kinetic parameters and efficient implementation in process simulation software like PetroSim. The kinetic parameters were calculated using experiments in a laboratory sized tubular reactor with a mass throughput between 600 g h−1 and 2500 g h−1 and temperatures between 440 °C and 530 °C at a pressure of 15 bar. A feedstock of 30 wt% plastic in different blends (PP, LDPE, HDPE) and 70 wt% carrier medium, a heavy refinery intermediate product, was used for the fitting and evaluation of the kinetic model. The results were evaluated with a set of experimental data, independent from the set used for the fitting. A residual analysis shows that the model has good predictive capabilities and can be used to simulate the cracking reaction of plastics in a plug flow reactor over a broad range of operating conditions.
Introduction
In the 20th century waste management in general and especially plastic waste became one of the main problems of our society. Nevertheless, the worldwide plastic production is steadily growing from 335 million metric tons in 2016 to 368 million metric tons in 2019.1 The reasons for this growth are mainly the beneficial material properties like longevity and versatility and the absence of inexpensive alternatives. The problem is that those material properties, which make plastic a good material for our economy, are also the reason why plastic is an issue after the life cycle of the plastic product has ended. Foremost, the degradation rates of plastic in the environment are remarkably low, ranging from 450 years for a plastic bottle to over 1000 years for HDPE pipes.2 Despite this only 10% of the worldwide generated plastic waste was recycled in 2022 while 19% was incinerated, 49% was landfilled and 22% was mismanaged.3To save the environment and reduce mismanaged and landfilled plastic waste the European Union released their strategy for plastics in a circular economy. One of the main goals in this strategy is a plastic recycling rate of 75% by 2030.4 Achieving those goals in time will not be easy and necessitates a revolution in how post-consumer plastic is handled and processed.
Mechanical recycling, which is currently the dominant technique for plastic waste, is limited to thermoplastic materials with a high purity so that it can be remelted into new products. This results in major sorting and pre-processing efforts for mechanical recovery. Chemical recycling promises to supplement the classic ways of plastic recycling as an alternative, with lower requirements to the recycling material. In chemical recycling, specifically in its subdivision feedstock recycling, the plastic is broken down, either by thermal or chemical processes, into its petrochemical raw materials. Those materials can then be used in plastic production without an impact on the quality of the products.5–7
Plastic pyrolysis is a chemical recycling method where the long-chained macromolecules are cracked into smaller, less complex molecules and monomers. In general, this process is carried out at elevated temperature and pressure8–12 often in the presence of a catalyst.13–19 The products of the pyrolysis process are oil, gas, and coke. Depending on their boiling point and quality the pyrolysis oil and gas can be used as fossil fuel substituents in a multitude of existing petroleum refinery processes which close the recycling loop by providing monomers for plastic production.20–22 Furthermore, the reactors in which the thermal cracking takes place, like tubular reactors, fluidized bed reactors and screw reactors, are comparable to standard refinery equipment. Those arguments make a plastic waste pyrolysis reactor a perfect fit to supplement a petroleum refinery. For this use case all types of polyolefins and some other plastics like polystyrene are suitable feedstocks because of their lack of heteroatoms in their organic structure. The plastic feed can be a mixture of those plastics with minimal requirements for the pre-treatment and cleanliness of the material compared to mechanical recycling. Only plastic materials with heteroatoms, like polyvinylchloride, contaminate the process with unwanted elements and must be kept to a minimum to achieve the needed product quality requirements.
Research is currently underway on many different reactor designs which can be applied for the thermal pyrolysis of plastic waste. Fixed- and fluidized-bed reactors,23–25 which are already in use for the pyrolysis of other feedstocks like coal, are considered because it is relatively easy to achieve stable operating conditions of those reactors. Disadvantages of those designs are their limitation in size which restricts the scalability of the technology, and the reaction gas circulation and heating requires expensive equipment. Rotary kilns on the other hand can handle large quantities of plastic waste and the continuous motion ensures good mixing and uniform heating. However, due to the constant movement of the reactor and the resulting mechanical wear, this design is expensive and high in maintenance.26,27 Screw kilns also enable good mixing and uniform heat transfer but are the most complex technology in terms of equipment and are very difficult to scale due to the limited screw size and heat transfer limitations in scaled-up apparatus.28,29
A heated tubular reactor is a simple, cost effective and scalable solution for the pyrolysis of plastics. With this reactor design the material must be melted and pumped through the reactor where it gets heated under pressure and the cracking reaction takes place. The design allows for easy continuous operation and efficient heat transfer across the reactor walls. In addition, a tubular reactor is highly scalable by increasing the number of parallel passes through the reactor. Challenging are the high viscosity and the low heat conductivity of pure plastic melts. Because of the high viscosity no standard equipment would be able to transport the melt and because of the low heat conductivity the heat transport from the reactor wall to the medium would be hindered. In the past a process was developed in which the plastic melt gets diluted with an organic carrier medium. The carrier medium improves the thermal properties of the reactor feed and decreases the viscosity of the melt, so that it can be pumped through the reactor. This approach makes it possible to carry out the thermal cracking of plastic melts in a tubular reactor with largely the use of standard equipment.30
To simulate the chemical processes in a pyrolysis reactor, three different approaches are currently known: empirical models,31 lumped kinetic models,32 and mechanistic kinetic models.33 Empirical models do not adhere to the real reaction mechanism and only show a sufficient predictability in specific parameter ranges with poor ability to extrapolate. Mechanistic models include detailed molecular level information about the reaction mechanism but are characterized by a higher analytical and computational effort. Molecular level models are often not feasible for petrochemical applications because of the plethora of different molecules.34 Lumped kinetic models provide an excellent balance between complexity, scalability, and accuracy. In lump kinetic modelling chemical compounds with similar properties are grouped together into hypothetical components and only the apparent reactions between those hypothetical components are modelled. Properties according to which the components can be lumped are for example the chemical structure, the carbon number or the boiling point of the components.35
For the upscaling and simulation of the process, a robust kinetic model with clear predictive qualities is needed. The fitting of the kinetic parameters should be straightforward, ideally without manual intervention and not dependent on estimated starting values. Furthermore, it must be possible to implement the model into standard process simulation software like PetroSim. Presently not many studies for the modelling of plastic co-pyrolysis in tubular reactors are found,30,36 and most of them work well in scientific applications but lack in usability for everyday working environments. Most works focus on the plastic decomposition kinetic derived from TGA experiments with isoconversional methods.37–39 Those TGA-based models only consider one decomposition step from plastic to volatile products in an open system, which is not of use for the purpose of industrial reactor design. Other, more advanced, methods like kinetic Monte Carlo are computationally too expensive and complex for industrial applications.40
In this study, an a priori35 lumped kinetic model was developed which meets all those requirements. The model consists only of consecutive reactions with zero alternative reaction pathways. This fact allows for a straightforward implementation of the model, while the algorithm for the fitting of the kinetic parameters is fully automated. The model was developed with data gathered from a laboratory sized tubular reactor with a maximum throughput of 2500 g h−1.
Materials
For the development of the lumped kinetic model three different types of plastic mixed with a heavy petroleum fraction in different compositions were used as feedstock for the laboratory plant. The plastics were virgin polypropylene (PP), low-density polyethylene (LDPE) and high-density polyethylene (HDPE) powder specified in Table 1, which were also used in previous work.30 Because of the physical dimensions of the reactor, especially the narrow outer diameter of 6.4 mm of the tubes, the maximum particle size of the plastic feed must be smaller than 500 μm. For this reason, the plastic feed is ground in an impact mill at cryogenic conditions lower than −150 °C before it is used for the experiments. The maximum ratio of plastic feed to carrier medium achievable by the design of the plant is 30 wt%. Higher plastic ratios lead to blockage in the feed system of the reactors.| Molecular weight (Mw) | Calorific value | Upper heating value | TGA inflection point | |
|---|---|---|---|---|
| (g mol−1) | (kJ kg−1) | (kJ kg−1) | (°C) | |
| PP | 3.624 × 10⁵ | 44.510 | 47.343 | 484 |
| LDPE | 2.3834 × 10⁵ | 43.409 | 46.159 | 500 |
| HDPE | 2.0275 × 10⁵ | 43.525 | 46.409 | 509 |
The organic carrier medium used is a readily available by-product of the petroleum refinery process. The medium is mainly aliphatic with an aromatic content of around 25%, a density of 880 kg m−3 and a calorific value of 45 MJ kg−1. Since the carrier medium will also crack under the conditions present in the reactor, the kinetic parameters for the carrier medium alone were evaluated in preliminary tests.
Experimental setup and procedure
The experiments are carried out in a laboratory reactor which was specifically built for this process (Fig. 1). The reactor is equal to the one described in previous work41,42 with some adjustments to the experimental procedure. | ||
| Fig. 1 Scheme of the laboratory scale reactor used for this work with the scope of the simulation boundaries marked in red. | ||
A liquid carrier medium and the plastic powder are mixed manually in predefined mass ratios, between 0 wt% and 30 wt% of plastic, before the experimental runs. 30 wt% is the upper limit for the plastic content in the feed, because with higher solid content the flowability of the feed was no longer guaranteed and the process pump was not able to pump the mixture into the reactor. The feed mixture is filled into the feeding tank B1 where it is continuously stirred. The pump P1 is a progressing cavity pump necessary to transport the suspension through the reactors. Both reactors R1 and R2 are coiled tubes heated by fluidized sand baths to the required temperature range of 400 °C to 550 °C. A temperature probe in each sand bath (TI1, TI2) was used to monitor the sand bath temperature (TSB) around each tubular reactor. The length of each reactor coil can be varied between 8 m and 24 m for further adjustment of the residence time without changes in the flow pattern. After the medium has passed the reactor, it is cooled by an air-, and an oil-cooler to around 90 °C. Either a hand valve or an automatic membrane valve can be used to regulate the pressure inside the system and to flash the products to atmospheric pressure. For all the experiments the pressure of the system was regulated to 15 bar. This relatively high pressure range was chosen because previous work indicates that higher pressure favors the production of valuable light liquid and gaseous products.43 Most of the pyrolysis products are in a liquid state under the conditions in the flash-vessel. Those products are collected at the bottom of the vessel and sampled after each experiment balance period. Products which are gaseous under the conditions inside the flash-vessel leave it through the head and are led to two further cooling traps where those lighter products are sampled. The cooling traps are set to a temperature of 15 °C and 0 °C respectively. Following the product sampling all the liquids are weighted, cooled in a freezer, and mixed to the final liquid product which gets analysed. The pyrolysis products which are gaseous below 0 °C, behind the last cooling trap, are sampled with a gas balloon.
The experimental conditions are mainly varied by the temperature of the sand bath, the length of the reactors, the power of the pump and the composition of the feedstock. The pump power regulates the mass flow inside the reactors and has a minimum flow of 600 g h−1 and a maximum flow of 2500 g h−1. This results in residence times in a range of 5 min to 60 min depending on the operating conditions. The main influence on the residence time beside the pump power is the temperature of the reactor because the vapor fraction of the medium, and therefore its average density, is highly dependent on it.
The analysis of the gaseous product is done by gas chromatography according to DIN 51666. The results are the heating value, the specific weight, and a detailed molecular composition of the gas phase. The true boiling point curve of the liquid products and the carrier medium are analysed according to ASTM D7169 via simulated distillation (SimDist). Gas chromatography of the liquid products was carried out on an Agilent 7890B with COC injector and FID detector. The stationary phase material was nonpolar dimethylpolysiloxane in a stainless-steel column (DB-HT Agilent).
As part of this work three different test series were carried out. The first series consists of runs with pure carrier medium and no added plastic content. The aim of this first series is to determine the decomposition behavior of the pure carrier medium in the investigated temperature range. The second test series consists of runs with the carrier medium and a single pure plastic component (LDPE, HDPE, or PP) to determine the pyrolysis kinetics of the individual plastics and any interactions with the carrier medium. The third series consists of runs with mixtures of the available plastics and the carrier medium. In those experiments the plastic powders were mixed in a ratio of 1![[thin space (1/6-em)]](https://www.rsc.org/images/entities/char_2009.gif) :
:![[thin space (1/6-em)]](https://www.rsc.org/images/entities/char_2009.gif) 2 or 1
2 or 1![[thin space (1/6-em)]](https://www.rsc.org/images/entities/char_2009.gif) :
:![[thin space (1/6-em)]](https://www.rsc.org/images/entities/char_2009.gif) 1 if two plastics were examined and 1
1 if two plastics were examined and 1![[thin space (1/6-em)]](https://www.rsc.org/images/entities/char_2009.gif) :
:![[thin space (1/6-em)]](https://www.rsc.org/images/entities/char_2009.gif) 1
1![[thin space (1/6-em)]](https://www.rsc.org/images/entities/char_2009.gif) :
:![[thin space (1/6-em)]](https://www.rsc.org/images/entities/char_2009.gif) 1 if all three available types of plastics were used. This series of tests is used to validate the kinetics and the assumptions made for the model generation. Parameter ranges and the number of experiments for each test series are shown in Table 2. From each series two to three random experiments were chosen for the evaluation of the kinetic parameters and for the representation of the results in this work. The process parameters of the experiments used to represent the results in this work are shown in Table 3. The exact analysis of the liquid and gaseous products of those experiments can be found in the ESI.†
1 if all three available types of plastics were used. This series of tests is used to validate the kinetics and the assumptions made for the model generation. Parameter ranges and the number of experiments for each test series are shown in Table 2. From each series two to three random experiments were chosen for the evaluation of the kinetic parameters and for the representation of the results in this work. The process parameters of the experiments used to represent the results in this work are shown in Table 3. The exact analysis of the liquid and gaseous products of those experiments can be found in the ESI.†
| Number of runs for | Temperature range | Mass flow range | Reactor length range | Plastic content | ||
|---|---|---|---|---|---|---|
| Fitting | Evaluation | |||||
| (−) | (−) | (°C) | (g h−1) | (m) | (wt%) | |
| Carrier medium | 21 | 3 | 410–520 | 600–2500 | 32–48 | 0 |
| Polypropylene | 10 | 2 | 440–520 | 600–2500 | 32–48 | 10–30 |
| LD-polyethylene | 20 | 3 | 450–530 | 600–2500 | 48 | 10–30 |
| HD-polyethylene | 20 | 3 | 450–540 | 600–2500 | 48 | 10–30 |
| Mixed plastics | 0 | 32 | 440–530 | 600–2500 | 32–48 | 30 |
| Nr. | Feed | Feed composition | Temperatures | Pressure | Mass flow | Reactor length | |||||
|---|---|---|---|---|---|---|---|---|---|---|---|
| HDPE | LDPE | PP | Solvent | TI1 | TI2 | R1 | R2 | ||||
| (−) | (−) | (%) | (%) | (%) | (%) | (°C) | (°C) | (bar) | (g h−1) | (m) | (m) |
| 196 | Carrier (C) | 0 | 0 | 0 | 100 | 432 | 429 | 14.7 | 556 | 24 | 24 |
| 257 | Carrier (C) | 0 | 0 | 0 | 100 | 464 | 465 | 15.1 | 1095 | 24 | 24 |
| 293 | Carrier (C) | 0 | 0 | 0 | 100 | 456 | 462 | 15.0 | 848 | 24 | 24 |
| 310 | Carrier (C) | 0 | 0 | 0 | 100 | 440 | 464 | 15.1 | 773 | 24 | 24 |
| 191 | C + LDPE | 0 | 20 | 0 | 80 | 439 | 448 | 14.7 | 788 | 24 | 24 |
| 201 | C + LDPE | 0 | 30 | 0 | 70 | 461 | 464 | 15.0 | 878 | 24 | 24 |
| 230 | C + LDPE | 0 | 20 | 0 | 80 | 498 | 503 | 13.8 | 1534 | 24 | 24 |
| 258 | C + LDPE | 0 | 30 | 0 | 70 | 464 | 465 | 15.2 | 893 | 24 | 24 |
| 205 | C + HDPE | 10 | 0 | 0 | 90 | 442 | 443 | 14.9 | 791 | 24 | 24 |
| 209 | C + HDPE | 20 | 0 | 0 | 80 | 475 | 475 | 15.0 | 1569 | 24 | 24 |
| 212 | C + HDPE | 30 | 0 | 0 | 70 | 463 | 460 | 15.0 | 637 | 24 | 24 |
| 216 | C + HDPE | 20 | 0 | 0 | 80 | 452 | 459 | 15.1 | 935 | 24 | 24 |
| 222 | C + PP | 0 | 0 | 20 | 80 | 444 | 443 | 15.8 | 957 | 24 | 24 |
| 224 | C + PP | 0 | 0 | 30 | 70 | 458 | 455 | 15.0 | 703 | 24 | 24 |
| 318 | C + PP | 0 | 0 | 30 | 70 | 438 | 474 | 14.8 | 1532 | 16 | 16 |
| 275 | C + MIX | 10 | 10 | 10 | 70 | 457 | 465 | 14.9 | 880 | 24 | 24 |
Nine-lump kinetic model (9-LKM)
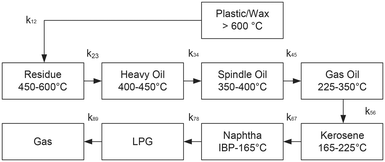
Lumped kinetic modelling is a standard modelling technique for the kinetics of hydrocarbon cracking.35,44–46 This approach is necessary because the typical feedstock for hydrocarbon pyrolysis is a mixture of many different molecules and considering every single real reaction between every molecule is not feasible in an industrial application. In this procedure every single component of the hydrocarbon feed is assigned to one specific lump in a reaction network. Typically, the separation of the lumps is according to the boiling point of the components or other material properties like molecular structure or density.35,47 Each lump acts as a pseudo- or hypothetical component with representative material properties derived from the molecules within. The cracking reactions between the lumps are modelled as irreversible, single step, monomolecular reactions (Fig. 2) where the reaction is assumed first order and the reaction rate r (eqn (1)) follows Arrhenius law (eqn (2)).| r12 = k12·XLump1 | (1) |
 | (2) |
| Lump name | Lump Nr. | Boiling range | Carbon number |
|---|---|---|---|
| (°C) | (−) | ||
| Plastic/wax (P) | 1 | >600 | >55 |
| Residue (Res) | 2 | 450–600 | 30–55 |
| Heavy oil (HO) | 3 | 400–450 | 23–30 |
| Spindle oil (SO) | 4 | 350–400 | 18–22 |
| Gas oil (GO) | 5 | 225–350 | 13–17 |
| Kerosene (Kero) | 6 | 165–225 | 10–12 |
| Naphtha | 7 | IBP–165 | 5–9 |
| LPG | 8 | C2–C4 | 2–4 |
| Gas | 9 | C1 | 1 |
It must be noted that light components can also be obtained directly from plastic through random chain scission, side chain cleavage or depolymerization.48 These reaction paths are not present in the sequential model, which places the model more on the empirical side of the spectrum between molecular models and empirical models. However, through validation with a database that is not part of the parameter fitting process, it is ensured that the model can still be extrapolated.
The sequential model considers the decomposition of mixtures of the plastics and the carrier medium in such a way that there is no interaction between the materials. For the carrier medium and each plastic in the feed the kinetic model is solved independently. The final mass fraction of lump j is the sum of all the lumps with equal boiling range from n separate components (eqn (3)).
 | (3) |
Simulation and kinetic parameter fitting
The reactor is programmed in PetroSim 7.2 as a custom operation unit in Visual Basic. For the simulation, the laboratory plant is separated into nine parts according to their geometry. Each part is simulated as a tubular plug flow reactor and differentiates itself by its geometry, surrounding temperature and pipe isolation from the other parts. For example, the first part is a horizontal insulated pipe, the second part a vertical bare pipe and the third is a downflowing coil inside the sand bath. All those geometries have different formulas for the heat transfer coefficient and different surrounding temperatures. The calculation of the heat transfer is detailed in previous work.30The initial condition for the integration of the first reactor part is the measured mass flow, the measured feed temperature, and the concentration of the feed as lumps. The initial conditions of the subsequent parts are the solutions of the differential equations of the preceding part.
The mass balance with the reaction of the lumps, the energy balance for the temperature of the fluid, which is required for the reaction rates, and the pressure loss equation for a two-phase fluid are solved in this model. The differential equations are discretized as one-dimensional grid along the length of the reactor tube (eqn (4)–(6)). TSB is the temperature of the sand bath surrounding the reactor tube, which is determined with the temperature sensors (TI1, TI2) in each reactor and modelled with a temperature gradient of −10 °C from the depth of the temperature sensor to the surface of the sand bath due to heat losses over the sand bath walls. The Darcy friction coefficient for the pressure loss calculation is calculated according to Beggs and Brill correlation for two phase flow.50 The slip ratio, which is the ratio between the velocity of the liquid and the velocity of gaseous phase at the location z, was calculated according to eqn (7).51 Since the calculated slip ratio does not exceed 1.3 across the whole reactor length, it is assumed that the gas and liquid phases have equal velocities. Under this assumption the residence time in the reactor can be calculated using eqn (8).
 | (4) |
 | (5) |
 | (6) |
 | (7) |
 | (8) |
For the fitting, PetroSim was accessed as a COM-Server by MATLAB to write the experiment parameters and measurements into the case and to get the results after the calculation. The simulation results are the lump composition of the simulated products compared to the measured real product composition. The model itself is handled as a black box by the surrogate solver which does not need a gradient for the fitting. The object function used in this study is the sum of squared errors between experimental and calculated lumped compositions according to eqn (9).
 | (9) |
Results
The experiment results show an important influence of the process parameters and feedstock composition on the boiling point distribution of the pyrolysis products. An overview of the experiment process data used for the following figures is given in Table 3.TBP distribution of the co-pyrolysis products
Fig. 4 compares the product boiling point distribution from experiments with similar process parameters and different feed compositions. It is noticeable that under those conditions (Table 4) the products of the polypropylene co-pyrolysis are in general lighter than the pyrolysis products of the other plastics. This suggests, that PP cracks to lighter products and at higher rates than LDPE and HDPE which is in line with findings from other works.53 Furthermore, the comparison of the LDPE and the HDPE pyrolysis products show a similar TBP-curve with the HDPE products being slightly heavier. Both of those findings can be explained with the molecular structure of the examined plastics. PP has the highest amount of tertiary carbon atoms in its molecular structure followed by LDPE because of its branched nature and HDPE with nearly no branches. Those tertiary carbon atoms have a higher probability of being cleavage points during thermal degradation, which results in this product distribution.54,55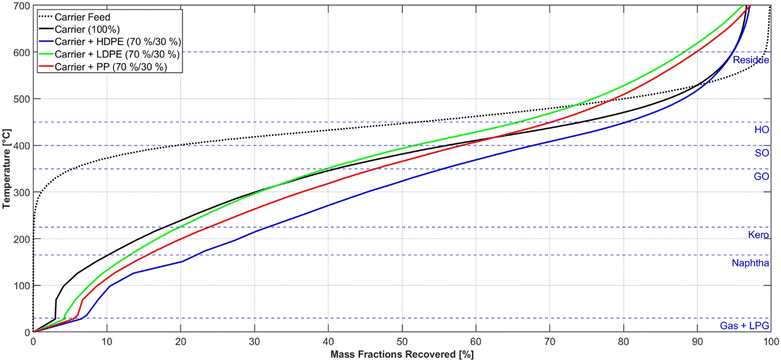 | ||
| Fig. 4 Measured TBP-curves for the carrier medium and liquid products from comparable experiments with a maximum pyrolysis temperature of 460 °C and a mass flow of 800 g h−1. | ||
The proportion of the gas and LPG lumps in the products indicate that the yield of those lumps is proportional to the cracking rate of the feed. The most gaseous products are obtained from the PP pyrolysis at the specified conditions, and less gaseous products are generated from the LDPE, HDPE, and carrier fluid pyrolysis. In Fig. 4, the exact boiling line of the gaseous components is approximated by a straight line between 0 °C and 20 °C, to achieve a consistent diagram.
Decomposition kinetic of different plastic types
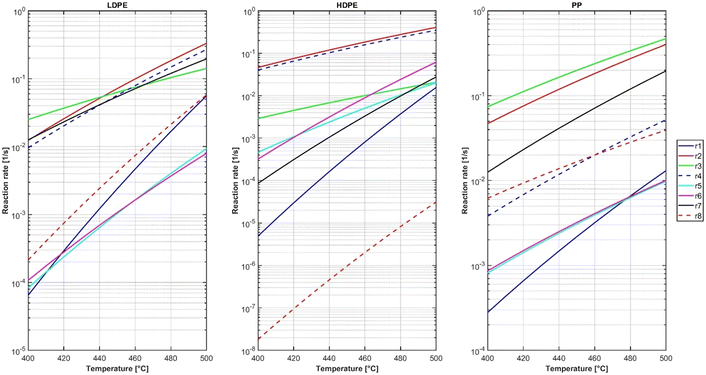
Since the heaviest lump consists of the plastics and their heaviest wax products, the k12-reactions from the respective kinetic networks can be considered as the decomposition rates of the plastics. Fig. 5 shows, that polypropylene cracks a lot faster than low-density and high-density polyethylene across most of the examined temperature range. This is in line with findings from other works56 and can be explained by the different C–C bond dissociation enthalpies (BDE) in the backbone of the respective polymers. The BDE of the PE backbone are between 362.2 kJ mol−1 and 369.9 kJ mol−1, and those of the PP backbone are in a range from 354.0 kJ mol−1 to 363.5 kJ mol−1.57 Those lower BDEs of the weakest links in PP signify a lower thermal stability of the PP molecule. The reaction rate from low-density polyethylene is two times as fast as high-density polyethylene across the investigated temperature range. It is noticeable that at 490 °C the reaction rates of all k12-reactions approach a similar value and the differences become less pronounced. The activation energies and frequency factors of the reactions are shown in Table 5.| Reaction | Frequency factor | Activation energy |
|---|---|---|
| (1 s−1) | (kJ mol−1) | |
| k 12 – PP | 1.84 × 10⁹ | 167.318 |
| k 12 – LDPE | 3.21 × 10¹⁹ | 316.124 |
| k 12 – HDPE | 7.16 × 10²⁰ | 338.287 |
Accuracy of the lumped kinetic model
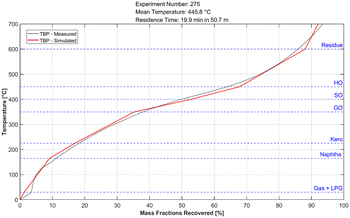
The calculated kinetic parameters were evaluated with a dataset which was not used for the fitting. The criterion for a good fit of the model was, that the maximum deviation from the simulated data to the experimental values is less than 0.05 kg kg−1 (eqn (10)) and no obvious systematic error is observable. Fig. 7 shows the deviation of the simulated from the measured mass fraction for every evaluation experiment plotted over the average temperature inside the reactor. Across all lumps for the whole temperature range, no systematic error is observable. It can also be seen that the accuracy across most of the lumps is within the accuracy criterion. The least accurate lump is the plastic/residue lump. In this lump two of the experiments show a slightly higher deviation than the threshold with a maximum deviation of 0.07 kg kg−1. Despite the higher deviation a systematic error is not noticeable, and therefore the kinetic parameters were considered as a good fit despite those two outliers. The higher deviation from the heaviest lump may be explained with the measurement inaccuracy of the SimDist, which is less accurate at higher boiling points.58 The true boiling point curve of the simulated pyrolysis products can be calculated with the lump composition and the boiling ranges of the respective lumps. For this calculation a linear boiling curve is assumed for each lump from the start of boiling to the end if its respective boiling range. Fig. 6 shows that the product boiling point distribution of the simulation (red) compared to the measured distribution (black) are in good agreement.| ΔXMax = Max(|Xj,Simulated − Xj,Measured|) ≤ 0.05 | (10) |
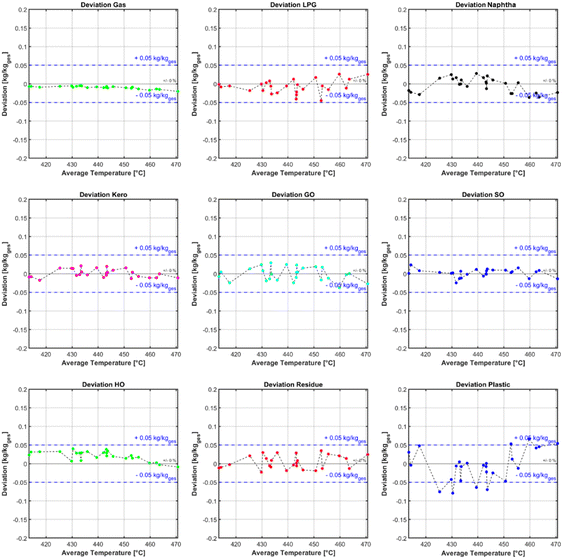 | ||
| Fig. 7 Deviation of each lump plotted over the mean reactor temperature for all experiments with plastic mixtures. | ||
Sensitivity analysis
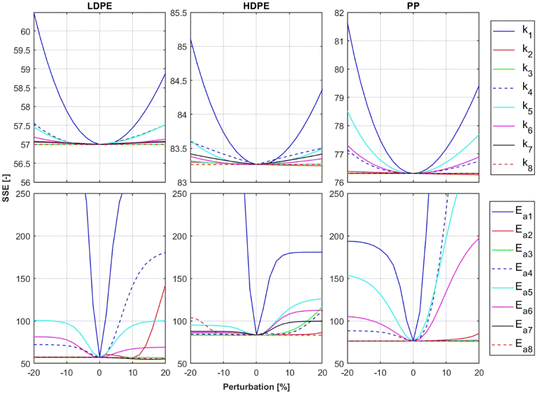
To ensure that the optimal solution for the kinetic parameters and the minimum of the objective function has been found, a sensitivity analysis59–61 was conducted for each model parameter based on the optimization data. The activation energies and frequency factors determined by surrogate optimization were each individually perturbed by ±20%, and for each perturbation of each parameter the cost function was evaluated. The results of this analysis are presented in Fig. 8. It is shown that the optimal parameters were found, demonstrated by the fact, that the minimal cost function value is at 0% perturbation. Furthermore, the figure shows, that the model reacts the most sensitive to change of the k1-kinetic parameters. This is the case because the composition of all lumps shifts by changing the k1 kinetics due to the serial reaction path.Laboratory reactor case study
The kinetic model was used in two case studies to find optimal experimental parameters for the laboratory plant. The first case study was carried out with a feed of 20 wt% LDPE, 10 wt% PP and 70% carrier medium. Fig. 9 shows the lump yields of the reactor across the whole temperature and mass flow range. It can be clearly seen that temperatures above 470 °C have a positive impact on the yield of the valuable product cuts with cut points below 350 °C. Above this temperature nearly all the plastic cracks into the lighter fractions kerosene and gas oil which have a clear maximum yield of 0.14 kg kg−1 and 0.25 kg kg−1 respectively. A second case study with a feed of 30 wt% PP and 70 wt% carrier medium is shown in Fig. 10. The temperature trends are comparable to the first case study, with the difference that the potential kerosene and gas oil yields are higher with values of 0.18 kg kg−1 and 0.35 kg kg−1 respectively. This difference can be explained by the fact that PP is generally easier to crack than LDPE and a significant larger fraction of the PP pyrolysis products have a boiling range between 165 and 350 °C.62 It must be noted that the used model does not take coke formation into account, since the experimental setup does not allow for a reliable way of measuring the production rate of the coke. Nevertheless, it has been proven that the model has a good predictive accuracy in the considered temperature range.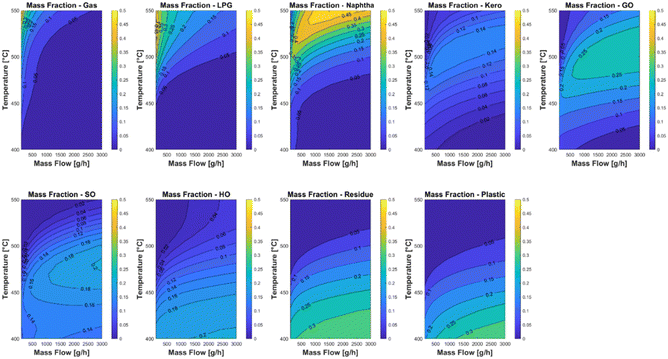 | ||
| Fig. 9 Case study of different operating conditions of the laboratory plant with a feed of 20 wt% LDPE, 10 wt% PP and 70% carrier medium. | ||
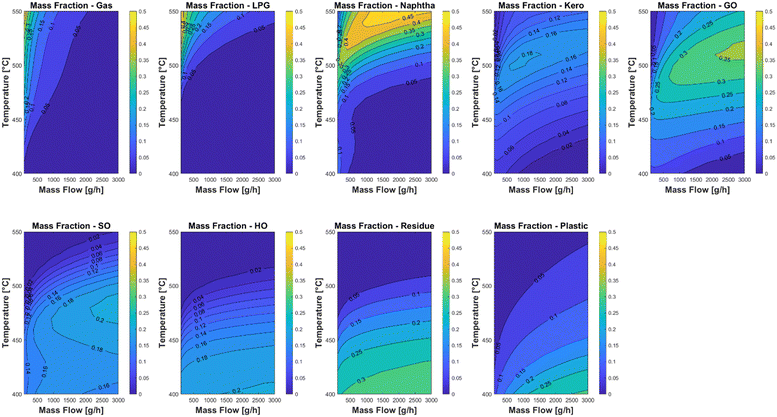 | ||
| Fig. 10 Case study of different operating conditions of the laboratory plant with a feed of 30 wt% PP and 70% carrier medium. | ||
Outlook
Since optimum temperatures are higher than previously investigated, a clear indication for the requirement of future work is given. The LKM should be expanded with a coke lump to make it possible to estimate the coking rate of the process. The coking rates increase with the temperature63 and have a major influence on the operating time and required maintenance intervals of the plant. With this information, it would be possible to estimate the optimal temperature window more precisely and take maintenance intervals of the process equipment into account.Conclusion
Pyrolysis processes for the chemical recycling of plastics are a necessary technology for a full circular economy. In this paper it was shown that a simple lumped kinetic model consisting of nine lumps with only serial reactions can model the decomposition of polyolefins in an organic carrier medium with excellent accuracy. The resolution of the boiling cuts of the products is more precise than other models with less lumps used in the past, while limiting the number of unknown parameters for the fitting of the kinetic parameters. The maximum deviation of the modelled mass fraction from the experimental results for most of the lumps has a value of less than 0.05 kg kg−1, except for the plastic residue lump which has a maximum deviation of 0.07 kg kg−1. Although the model is more on the empirical side since parallel reactions that take place through depolymerization and side chain cleavage are neglected, it has been shown in pilot plant experiments that the model can be extrapolated. It was proven that this accuracy is verifiable in the relevant temperature range for slow pyrolysis above 400 °C and below 500 °C. A case study for the laboratory plant has shown that there is a distinct temperature window between 470 °C and 520 °C for a maximum yield of kerosene and gas oil.Author contributions
Conceptualization, S.-M. L.; methodology, S.-M. L.; software, S.-M. L.; validation, S.-M. L. and A. E. L.; formal analysis, S.-M. L.; investigation, S.-M. L.; resources, S.-M. L.; data curation, S.-M. L.; writing – original draft preparation, S.-M. L.; writing – review and editing, S.-M. L. and T. S.; visualization, S.-M. L.; supervision, M. L.; project administration, A. E. L. All authors have read and agreed to the published version of the manuscript.Conflicts of interest
Andreas E. Lechleitner reports a relationship with OMV Downstream GmbH that includes employment. Andreas E. Lechleitner has patent pending to OMV Downstream GmbH. Sebastian-Mark Lorbach has patent pending to OMV Downstream GmbH.References
- Plastics Europe, Plastics - the Facts 2021, https://plasticseurope.org/knowledge-hub/plastics-the-facts-2021/, (accessed 25 January 2023).
- A. Chamas, H. Moon, J. Zheng, Y. Qiu, T. Tabassum, J. H. Jang, M. Abu-Omar, S. L. Scott and S. Suh, Degradation Rates of Plastics in the Environment, ACS Sustainable Chem. Eng., 2020, 8, 3494–3511 CrossRef CAS.
- OECD Environment Statistics, OECD, 2017.
- European Comission, A european strategy for plastics in a circular economy, https://www.europarc.org/wp-content/uploads/2018/01/Eu-plastics-strategy-brochure.pdf.
- T. Thiounn and R. C. Smith, Advances and approaches for chemical recycling of plastic waste, J. Polym. Sci., 2020, 58, 1347–1364 CrossRef CAS.
- European bioplastics, Mechanical Recycling, https://docs.european-bioplastics.org/publications/bp/EUBP_BP_Mechanical_recycling.pdf, (accessed 27 January 2023).
- P. S. Roy, G. Garnier, F. Allais and K. Saito, Strategic Approach Towards Plastic Waste Valorization: Challenges and Promising Chemical Upcycling Possibilities, ChemSusChem, 2021, 14, 4007–4027 CrossRef CAS PubMed.
- S. M. Al-Salem, A. Antelava, A. Constantinou, G. Manos and A. Dutta, A review on thermal and catalytic pyrolysis of plastic solid waste (PSW), J. Environ. Manage., 2017, 197, 177–198 CrossRef CAS PubMed.
- O. Y. Yansaneh and S. H. Zein, Recent Advances on Waste Plastic Thermal Pyrolysis: A Critical Overview, Processes, 2022, 10, 332 CrossRef CAS.
- P. Kasar, D. K. Sharma and M. Ahmaruzzaman, Thermal and catalytic decomposition of waste plastics and its co-processing with petroleum residue through pyrolysis process, J. Cleaner Prod., 2020, 265, 121639 CrossRef CAS.
- C.-H. Wu, C.-Y. Chang, J.-L. Hor, S.-M. Shih, L.-W. Chen and F.-W. Chang, On the thermal treatment of plastic mixtures of MSW: Pyrolysis kinetics, Waste Manage., 1993, 13, 221–235 CrossRef CAS.
- M. Zeller, N. Netsch, F. Richter, H. Leibold and D. Stapf, Chemical Recycling of Mixed Plastic Wastes by Pyrolysis – Pilot Scale Investigations, Chem. Ing. Tech., 2021, 93, 1763–1770 CrossRef CAS.
- S. Budsaereechai, A. J. Hunt and Y. Ngernyen, Catalytic pyrolysis of plastic waste for the production of liquid fuels for engines, RSC Adv., 2019, 9, 5844–5857 RSC.
- R. Miandad, M. A. Barakat, A. S. Aburiazaiza, M. Rehan and A. S. Nizami, Catalytic pyrolysis of plastic waste: A review, Process Saf. Environ. Prot., 2016, 102, 822–838 CrossRef CAS.
- Y. Peng, Y. Wang, L. Ke, L. Dai, Q. Wu, K. Cobb, Y. Zeng, R. Zou, Y. Liu and R. Ruan, A review on catalytic pyrolysis of plastic wastes to high-value products, Energy Convers. Manage., 2022, 254, 115243 CrossRef CAS.
- A. Lopez-Urionabarrenechea, I. de Marco, B. M. Caballero, M. F. Laresgoiti and A. Adrados, Catalytic stepwise pyrolysis of packaging plastic waste, J. Anal. Appl. Pyrolysis, 2012, 96, 54–62 CrossRef CAS.
- H. W. Ryu, D. H. Kim, J. Jae, S. S. Lam, E. D. Park and Y.-K. Park, Recent advances in catalytic co-pyrolysis of biomass and plastic waste for the production of petroleum-like hydrocarbons, Bioresour. Technol., 2020, 310, 123473 CrossRef CAS PubMed.
- B.-S. Kim, Y.-M. Kim, H. W. Lee, J. Jae, D. H. Kim, S.-C. Jung, C. Watanabe and Y.-K. Park, Catalytic Copyrolysis of Cellulose and Thermoplastics over HZSM-5 and HY, ACS Sustainable Chem. Eng., 2016, 4, 1354–1363 CrossRef CAS.
- S. Lee, J. Lee and Y.-K. Park, Simultaneous Upcycling of Biodegradable Plastic and Sea Shell Wastes Through Thermocatalytic Monomer Recovery, ACS Sustainable Chem. Eng., 2022, 10, 13972–13979 CrossRef CAS.
- S. D. Anuar Sharuddin, F. Abnisa, W. M. A. Wan Daud and M. K. Aroua, A review on pyrolysis of plastic wastes, Energy Convers. Manage., 2016, 115, 308–326 CrossRef CAS.
- J. Lee, E. E. Kwon, S. S. Lam, W.-H. Chen, J. Rinklebe and Y.-K. Park, Chemical recycling of plastic waste via thermocatalytic routes, J. Cleaner Prod., 2021, 321, 128989 CrossRef CAS.
- R. Palos, A. Gutiérrez, F. J. Vela, M. Olazar, J. M. Arandes and J. Bilbao, Waste Refinery: The Valorization of Waste Plastics and End-of-Life Tires in Refinery Units. A Review, Energy Fuels, 2021, 35, 3529–3557 CrossRef CAS PubMed.
- W. Kaminsky, Chemical recycling of plastics by fluidized bed pyrolysis, Fuel Communications, 2021, 8, 100023 CrossRef.
- K. Suresh Kumar Reddy, P. Kannan, A. Al Shoaibi and C. Srinivasakannan, Thermal Pyrolysis of Polyethylene in Fluidized Beds: Review of the Influence of Process Parameters on Product Distribution, J. Energy Resour. Technol., 2012, 134(3), 034001 CrossRef.
- Ö. Çepelioğullar and A. E. Pütün, Products characterization study of a slow pyrolysis of biomass-plastic mixtures in a fixed-bed reactor, J. Anal. Appl. Pyrolysis, 2014, 110, 363–374 CrossRef.
- Y. Zhang, G. Ji, C. Chen, Y. Wang, W. Wang and A. Li, Liquid oils produced from pyrolysis of plastic wastes with heat carrier in rotary kiln, Fuel Process. Technol., 2020, 206, 106455 CrossRef CAS.
- A. Li, X. Li, S. Li, Y. Ren, Y. Chi, J. Yan and K. Cen, Pyrolysis of solid waste in a rotary kiln: influence of final pyrolysis temperature on the pyrolysis products, J. Anal. Appl. Pyrolysis, 1999, 50, 149–162 CrossRef CAS.
- A. V. Lozhechnik and V. V. Savchin, Pyrolysis of Rubber in a Screw Reactor, J. Eng. Phys. Thermophys., 2016, 89, 1482–1486 CrossRef CAS.
- D. Serrano, J. Aguado, J. Escola and E. Garagorri, Conversion of low density polyethylene into petrochemical feedstocks using a continuous screw kiln reactor, J. Anal. Appl. Pyrolysis, 2001, 58–59, 789–801 CrossRef CAS.
- A. E. Lechleitner, T. Schubert, W. Hofer and M. Lehner, Lumped Kinetic Modeling of Polypropylene and Polyethylene Co-Pyrolysis in Tubular Reactors, Processes, 2021, 9, 34 CrossRef CAS.
- J. Ancheyta-Juárez, F. López-Isunza and E. Aguilar-Rodríguez, 5-Lump kinetic model for gas oil catalytic cracking, Appl. Catal., A, 1999, 177, 227–235 CrossRef.
- I. Pitault, D. Nevicato, M. Forissier and J.-R. Bernard, Kinetic model based on a molecular description for catalytic cracking of vacuum gas oil, Chem. Eng. Sci., 1994, 49, 4249–4262 CrossRef CAS.
- T. M. Kruse, H.-W. Wong and L. J. Broadbelt, Mechanistic Modeling of Polymer Pyrolysis: Polypropylene, Macromolecules, 2003, 36, 9594–9607 CrossRef CAS.
- X. Zhao and S. Sun, Lumped Kinetic Modeling Method for Fluid Catalytic Cracking, Chem. Eng. Technol., 2020, 43, 2493–2500 CrossRef CAS.
- L. P. de Oliveira, D. Hudebine, D. Guillaume and J. J. Verstraete, A Review of Kinetic Modeling Methodologies for Complex Processes, Oil Gas Sci. Technol., 2016, 71, 45 CrossRef.
- B. Csukás, M. Varga, N. Miskolczi, S. Balogh, A. Angyal and L. Bartha, Simplified dynamic simulation model of plastic waste pyrolysis in laboratory and pilot scale tubular reactor, Fuel Process. Technol., 2013, 106, 186–200 CrossRef.
- Z. Gao, T. Kaneko, I. Amasaki and M. Nakada, A kinetic study of thermal degradation of polypropylene, Polym. Degrad. Stab., 2003, 80, 269–274 CrossRef CAS.
- A. Aboulkas, K. El harfi and A. El Bouadili, Pyrolysis of olive residue/low density polyethylene mixture: Part I Thermogravimetric kinetics, J. Fuel Chem. Technol., 2008, 36, 672–678 CrossRef.
- S. Khedri and S. Elyasi, Kinetic analysis for thermal cracking of HDPE: A new isoconversional approach, Polym. Degrad. Stab., 2016, 129, 306–318 CrossRef CAS.
- L. Da Pires Mata Costa, A. L. Brandão and J. C. Pinto, Modeling of polystyrene degradation using kinetic Monte Carlo, J. Anal. Appl. Pyrolysis, 2022, 167, 105683 CrossRef.
- T. Schubert, M. Lehner and W. Hofer, Experimental and modeling approach of LDPE thermal cracking for feedstock recycling, 14th MINISYMPOSIUM CHEMICAL & PROCESS ENGINEERING and 5th PARTICLE FORUM Book of Abstracts, 2018 Search PubMed.
- T. Schubert, A. Lechleitner, M. Lehner and W. Hofer, 4-Lump kinetic model of the co-pyrolysis of LDPE and a heavy petroleum fraction, Fuel, 2020, 262, 116597 CrossRef CAS.
- T. Schubert, M. Lehner, T. Karner, W. Hofer and A. Lechleitner, Influence of reaction pressure on co-pyrolysis of LDPE and a heavy petroleum fraction, Fuel Process. Technol., 2019, 193, 204–211 CrossRef CAS.
- R. Radmanesh, Y. Courbariaux, J. Chaouki and C. Guy, A unified lumped approach in kinetic modeling of biomass pyrolysis, Fuel, 2006, 85, 1211–1220 CrossRef CAS.
- J. Ancheyta, S. Sánchez and M. A. Rodríguez, Kinetic modeling of hydrocracking of heavy oil fractions: A review, Catal. Today, 2005, 109, 76–92 CrossRef CAS.
- E. Ranzi, M. Dente, A. Goldaniga, G. Bozzano and T. Faravelli, Lumping procedures in detailed kinetic modeling of gasification, pyrolysis, partial oxidation and combustion of hydrocarbon mixtures, Prog. Energy Combust. Sci., 2001, 27, 99–139 CrossRef CAS.
- T. C. Ho, Kinetic Modeling of Large-Scale Reaction Systems, Catal. Rev.: Sci. Eng., 2008, 50, 287–378 CrossRef CAS.
- A. Marongiu, T. Faravelli and E. Ranzi, Detailed kinetic modeling of the thermal degradation of vinyl polymers, J. Anal. Appl. Pyrolysis, 2007, 78, 343–362 CrossRef CAS.
- A. P. Kudchadker and B. J. Zwolinski, Vapor Pressure and Boiling Points of Normal Alkanes, C 21 to C 100, J. Chem. Eng. Data, 1966, 11, 253–255 CrossRef CAS.
- Standard handbook of petroleum & natural gas engineering, Gulf Publ, Houston, TX, 1996 Search PubMed.
- D. Chisholm, Two-phase flow in pipelines and heat exchangers, Godwin, London usw, 1983 Search PubMed.
- J. Mueller, MATSuMoTo: The MATLAB Surrogate Model Toolbox For Computationally Expensive Black-Box Global Optimization Problems (Version 1), arXiv, 2014, preprint, arXiv:1404.4261 [math.OC], DOI:10.48550/ARXIV.1404.4261.
- A. Aboulkas, K. El harfi and A. El Bouadili, Thermal degradation behaviors of polyethylene and polypropylene. Part I: Pyrolysis kinetics and mechanisms, Energy Convers. Manage., 2010, 51, 1363–1369 CrossRef CAS.
- E. Ranzi, T. Faravelli, P. Gaffuri, E. Garavaglia and A. Goldaniga, Primary Pyrolysis and Oxidation Reactions of Linear and Branched Alkanes, Ind. Eng. Chem. Res., 1997, 36, 3336–3344 CrossRef CAS.
- C. David, in Degradation of Polymers, Elsevier, 1975, pp. 1–173 Search PubMed.
- Y. Rodríguez Lamar, J. Noboa, A. S. Torres Miranda and D. Almeida Streitwieser, Conversion of PP, HDPE and LDPE Plastics into Liquid Fuels and Chemical Precursors by Thermal Cracking, J. Polym. Environ., 2021, 29, 3842–3853 CrossRef.
- J. B. Huang, G. S. Zeng, X. S. Li, X. C. Cheng and H. Tong, Theoretical studies on bond dissociation enthalpies for model compounds of typical plastic polymers, IOP Conf. Ser.: Earth Environ. Sci., 2018, 167, 12029 CrossRef.
- Agilent Technologies, Agilent 7890B Gas Chromatograph. Operation Manual, https://www.agilent.com/cs/library/usermanuals/Public/7890B_Operation.pdf, (accessed 13 February 2023).
- V. Sámano, A. Tirado, G. Félix and J. Ancheyta, Revisiting the importance of appropriate parameter estimation based on sensitivity analysis for developing kinetic models, Fuel, 2020, 267, 117113 CrossRef.
- S. Verenich, A. Laari and J. Kallas, Parameter Estimation and Sensitivity Analysis of Lumped Kinetic Models for Wet Oxidation of Concentrated Wastewaters, Ind. Eng. Chem. Res., 2003, 42, 5091–5098 CrossRef CAS.
- L. A. Alcázar and J. Ancheyta, Sensitivity analysis based methodology to estimate the best set of parameters for heterogeneous kinetic models, Chem. Eng. J., 2007, 128, 85–93 CrossRef.
- İ. Çit, A. Sınağ, T. Yumak, S. Uçar, Z. Mısırlıoğlu and M. Canel, Comparative pyrolysis of polyolefins (PP and LDPE) and PET, Polym. Bull., 2010, 64, 817–834 CrossRef.
- A. Niaei, D. Salari, J. Towfighi, A. Chamandeh and R. Nabavi, Aluminized Steel and Zinc Coating for Reduction of Coke Formation in Thermal Cracking of Naphtha, Int. J. Chem. React. Eng., 2008, 6 DOI:10.2202/1542-6580.1660.
Footnote |
| † Electronic supplementary information (ESI) available. See DOI: https://doi.org/10.1039/d4re00075g |
| This journal is © The Royal Society of Chemistry 2024 |


