 Open Access Article
Creative Commons Attribution 3.0 Unported Licence
Modelling the impact of mass transport in a miniplant photoreactor†
Florian
Gaulhofer
a,
Henning
Becker
 a,
Alexander
Peschl
b and
Dirk
Ziegenbalg
 *a
*a
aInstitute of Chemical Engineering, Ulm University, Albert-Einstein-Allee 11, 89081, Ulm, Germany. E-mail: dirk.ziegenbalg@uni-ulm.de
bPeschl Ultraviolet GmbH, Weberstraβe 19, 55130 Mainz, Germany
First published on 27th August 2024
Abstract
The scale-up of photoreactions posses challenges due to the non-linear coupling of the radiation field with reaction kinetics and mass transport. A knowledge-based scale-up requires a sufficiently detailed theoretical description of these processes. In this work, a transient, two-dimensional photoreactor model is proposed and used to systematically investigate mass transport limitations in photoreactors, including the effect of transversal mass transport through static mixers and the self-shading effect of the studied homogeneous photoisomerization of a spiropyrane. Simulation results of the proposed photoreactor model indicated that mass transport along the direction of light has a major impact. The transversal dispersion would be increased by a factor of 6 by the installation of static mixers, which would allow for a 1.27 fold increase in conversion in an up-scaled photoreactor. A shrinking of the reaction zone was identified when increasing the light power, eventually limiting the reactor performance. Furthermore, a model-based scale-up study emphasized the importance of mass transport for scaling photoreactors.
1 Introduction
The application of light-driven processes ranges from water purification by photocatalysis, to synthesis of organic chemicals and pharmaceutical products.1–5 The attractiveness of photochemistry results from its ability to raise the energetic state of a molecule to unlock unique mechanistic reaction pathways.6 Photochemical reactions are considered building blocks of a sustainable chemistry, due to the non-invasive activation by photons, and meet many principles of Green Chemistry, such as improved safety, high energy efficiency, and reduced waste.7–13The exponential attenuation of the photon flux along the direction of light rays represents the main aspect to be addressed in photoreactors. The change in intensity results in a similar steep gradient of reaction rate along the optical pathlength and with these demands for a compensation by mass transport. During the last decades, microstructured photoreactors were used to address this design challenge.14–23
Modelling photochemical processes has been common practice for analysing and designing (microstructured) photoreactors for several decades.6,24–29 The intensification of photochemical processes is inextricably linked to the analysis of mass transport limitations.30–32 Recently, the impact of heat transfer on the observed catalytic activity was studied theoretically to differentiate photothermal from photochemical effects.33 Modelling has also been established for determining the absorbed photon flux density by chemical actinometry.34,35 Moreover, great progress has been achieved in recent decades in the development of numerical methods to calculate the dynamics of fluids, the radiation transfer and chemical reaction networks. Both free and commercial software packages were established, which enabled the investigation of diverse photochemical processes.33,36–46
The scale-up strategy for micro-photoreactors typically follows either an internal or external numbering-up approach.47 While this concept is very promising at first glance, it comes with a significant burden on the investment costs and also has limitations for multiphase reactions when large overall throughputs have to be realized. A (partial) geometrical scale-up (scale-out) is therefore the next logical step for the development of industrial scale photoreactors.48 When leaving the microscale through geometry transformation, material and energy transport processes change, dispersion effects are now of more importance and thus the molecules encounter a different process experience.49 The situation becomes even more complex for competitive photochemical reaction networks that exhibit shading or involve (heterogeneous) photocatalytic systems, leading to the non-linear coupling of the radiation field to the concentration, temperature and flow fields.50,51 The installation of static mixers is a meaningful strategy to narrow the residence time distribution by accelerating transversal mass transport, while at the same time improving the reaction performance for a self-shading reaction, in which the absorption of the product inhibits the reaction progress.52–54 Such reactions are not only of interest as benchmark reactions to probe the efficiency of mass transport enhancements but are industrially relevant, with the photochemical production of vitamin D3 as the most prominent example, which features a complex dynamic equilibrium between four photoisomers and overlapping absorption spectra.3,55
On the way to an industrial application, scale-up strategies are required to transfer photoreactions from bench to mini-plant and subsequently production scale. Reaction systems can be classified into different scales: laboratory (V < 0.5 L), mini-plant (V < 5 L) and production plant (V > 5 L).56 The scale-up concept towards industrial photoreactors is typically based on scaling the length of the light source and the subsequent realization of a multi-lamp system (internal numbering-up). Maintaining similar process experiences for the reacting molecules throughout the scale-up is essential to this concept.49 For this purpose, a fully characterized single-unit photoreactor, the modular, industrial scalable, continuously operated photoreactor (MISCOP), is designed to bridge the gap between laboratory photoreactors (small scale), and industrial photoreactors (large scale). To attain a profound understanding of the interplay between mass transport and reaction performance, and to further improve the performance of photoreactors for demanding homogeneous reactions, such as self-shading or photocatalytic reactions, a more comprehensive modelling approach is needed that describes the following aspects of real large-scale photoreactors:
• local reaction rate for involved reactants,
• convective mass transport based on the velocity profile,
• dispersive mass transport in transversal and axial direction induced by static mixers,
• and the emission characteristics of the light source.
In this contribution, a novel transient, two-dimensional photochemical model is presented that describes the before mentioned aspects. The model was parametrized with experimental and theoretically data previously obtained for the mini-plant photoreactor (MISCOP) and subsequently used to analyse the effect of mass transport enhancements in the MISCOP system on the performance and efficiency as well as a potential scale-up. For the theoretical assessment, four key factors were identified for an effective modelling of the MISCOP system: the Bodenstein number Bo, the photonic utilization factor ηsys of the reactor, the absorption coefficient of participating species, and the quantum yield Φ of the photochemical reaction. Thus, the photochemical reactor model aims to complete the understanding of the performance of real photoreactors and the occurring mass transport effects to support the development of scale-up strategies. As a side aspect, the quantum yield for the studied photoisomerization, which is required for all modelling approaches, was obtained with a model-based analysis of experimental data measured in a capillary photoreactor.
2 Theoretical methods
2.1 Effective modeling approach for photoreactors
The fundamentals for the mathematical description of photoreactors, namely radiation transport, kinetics, and the conservation equations for mass, heat, and momentum balance, remain essential, independent of the chosen modelling approach. Nonetheless, numerous investigations focus only on individual aspects because integrating all these principles leads to highly intricate interdependencies. The individual phenomena are essential for comprehending the fundamentals of photoreactors and are mutually supportive, yet frequently only partial aspects of the whole reactor system are addressed. Experimental methods often have the advantage of considering multiple physical influencing factors (multiphysics) of the process in the reactor. However, characterization often occurs through concentration measurements at the reactor outlet. The limitation of these studies is in the derived integral values, which prevent the evaluation of specific local physical effects. Experimental methods typically probe multiple physical influencing factors at once (multiphysics). However, commonly integral properties are measured such as concentrations at the reactor outlet, limiting the evaluation of specific local physical effects.The MISCOP system is designed to serve as a foundation for the further development of large-scale processes and requires thorough characterization.
Studies on the implementation of static mixers in the MISCOP system and the consequent alterations in hydrodynamics and the radiation field, as detailed in prior publications, are utilized to parameterize the photoreactor model. Incorporating static mixers improves mass transport in the reaction space but concurrently shades the reaction zone from incident light. On the other hand, the studied photoisomerization cause a self-shading effect, whereby the light absorption of the product hinders the progress of the reaction. Analyzing the impact of transversal dispersion on the conversion of the MISCOP system necessitates a local examination of both mass and photon transport. The objective of the effective reactor modelling was to identify and quantify the key influences of the MISCOP system with static mixers for a self-shading photoreaction based on continuum mechanical principles.
The following influences were considered: i) the decoupling of axial and transversal dispersion, ii) the competitive absorption of the product molecule, iii) the use of internal structures (static mixers), and iv) the exponential decrease of radiant power orthogonal to the main flow direction.
The modeling of the MISCOP system is based on publications analyzing the residence time distribution of the static mixers and the calculation of the radiation field.45,46Fig. 1 summarizes the dependencies of the 2D transient 2Dt model developed for the MISCOP system and outlines the direct dependence on the axial dispersion coefficient Dy, the photon utilization factor ηsys, and the quantum yield Φ. All three influencing factors describe fundamental aspects of photochemical reaction engineering, namely mass transport, photon transport, and photokinetics. These parameters are essential input variables for a comprehensive photoreactor model designed to support the development and scaling of photoreactors.
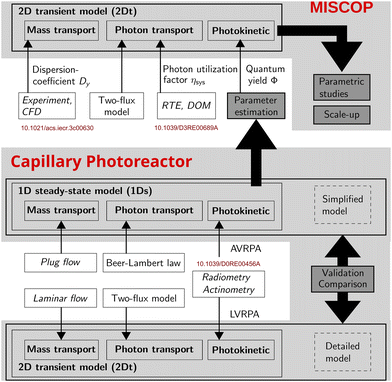 | ||
| Fig. 1 Representation of the dependencies of the basic principles of a photoreactor and its effective integration into modeling approaches of the 1Ds and 2Dt model. | ||
Solving the 2Dt model for the MISCOP reactor requires the determination of the quantum yield of species 2 in the used solvent, i.e. technical grade ethanol. This was achieved by estimation of the photokinetic parameters based on experimental data obtained at suitable conditions and fitted with a 1D steady state 1Ds model. This model is a simplified version of the 2Dt model, to reduce computational efforts. The validity of this approach was then checked by using the complex model for the prediction of and comparison against the experimental data using the estimated quantum yield. Since the complex model requires more parameters than obtainable with the 1Ds model, a thorough screening of unknown parameters was conducted to proof the reliability of the estimated quantum yield.
This was achieved by applying a 1D steady-state 1Ds model for experimental conditions suited to obtain photokinetic parameters. As a simplified version of the 2Dt model, the 1Ds model was derived by reducing the level of description to meaningful boundary cases, i.e. plug flow, no axial dispersion and collimated irradiation.
2.2 Photochromic reaction system
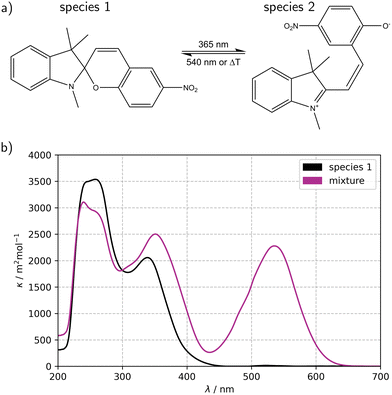
Fig. 2a illustrates the reversible reaction scheme of the ring-opening photoisomerization of 1,3,3-trimethylindolino-6′-nitrobenzopyrylospirane (6-NO2-BIPS), which was chosen as a benchmark reaction to elucidate the potential impact of a static mixer on mass transfer processes in the mini-plant photoreactor (MISCOP). The main characteristic of this photochemical reaction is a self-shading effect, which demands sufficient mixing of the reaction solution to achieve a high conversion, making this reaction suitable for studying the effect of mass transport limitations.46 The spiropyrane 1 is referenced as closed form, the merocyanine 2 as opened form. Upon irradiation with UV light (λirr = 365 nm), the colourless species 1 isomerizes to the coloured species 2, which also absorbs light in the UV region (see Fig. 2b).57–61 The spiropyrane is a photochromic compound of type T and P, i.e. the reversible back reaction (2 → 1) is induced either by temperature increase of the reaction solution or by irradiation with green light at a wavelength of about 540 nm. Without UV irradiation, the reaction system equilibrates thermally. Detailed information on the thermal back reaction, the absorption spectra, and the photodegradation were already published.46The unimolecular reaction  is induced by monochromatic light of wavelength λirr, and is assumed to be a single photochemical step. During photon absorption, the rate of the photon activated step (primary event) is proportional to the absorbed local photon flux density Lap(
![[x with combining right harpoon above (vector)]](https://www.rsc.org/images/entities/i_char_0078_20d1.gif) , t) (local volumetric rate of photon absorption, LVRPA). The proportionality constant of this relation is the primary reaction quantum yield Φ.62–66 The product of quantum yield and absorbed local photon flux density, Lap(
, t) (local volumetric rate of photon absorption, LVRPA). The proportionality constant of this relation is the primary reaction quantum yield Φ.62–66 The product of quantum yield and absorbed local photon flux density, Lap(![[x with combining right harpoon above (vector)]](https://www.rsc.org/images/entities/i_char_0078_20d1.gif) , t) results in an expression for the local reaction rate of the photochemical step rp:
, t) results in an expression for the local reaction rate of the photochemical step rp:
rp = Φ·Lap(![[x with combining right harpoon above (vector)]](https://www.rsc.org/images/entities/i_char_0078_20d1.gif) , t). , t). | (1) |
For the kinetics of the photoisomerization, only the photochemical forward reaction is considered. The experimental reaction times are below 60 s, which is a short enough timespan to neglect the thermal back reaction.46 Degradation process were previously observed, but were neglected in this study because the degradation was found to only be relevant for long term irradiation experiments with a recycle reactor.46 The quantum yield ϕ of a photochemical reaction  at wavelength λirr is defined as the number of defined events, occurring per photon absorbed by the system:63
 | (2) |
The absorbed local photon flux density Lap(![[x with combining right harpoon above (vector)]](https://www.rsc.org/images/entities/i_char_0078_20d1.gif) , t) (LVRPA) represents the amount of photons that are absorbed per unit time and unit reaction volume, and this property depends linear on the radiation field and is expressed as:64
, t) (LVRPA) represents the amount of photons that are absorbed per unit time and unit reaction volume, and this property depends linear on the radiation field and is expressed as:64
Lap(![[x with combining right harpoon above (vector)]](https://www.rsc.org/images/entities/i_char_0078_20d1.gif) , t) = α·Ep,o( , t) = α·Ep,o(![[x with combining right harpoon above (vector)]](https://www.rsc.org/images/entities/i_char_0078_20d1.gif) , t), , t), | (3) |
 | (4) |
The photon fluence rate Ep,o (overall, o) is the integral over the solid angle Ω of the photon flux density Lp(![[x with combining right harpoon above (vector)]](https://www.rsc.org/images/entities/i_char_0078_20d1.gif) , t) incident from all directions onto a small sphere, divided by the cross-sectional area of that sphere:
, t) incident from all directions onto a small sphere, divided by the cross-sectional area of that sphere:
 | (5) |
The photon flux density Lp,Ω(![[x with combining right harpoon above (vector)]](https://www.rsc.org/images/entities/i_char_0078_20d1.gif) , t) is obtained from the photon transport equation. The derivation of the photon transport equations is presented in the ESI† 2.1.
, t) is obtained from the photon transport equation. The derivation of the photon transport equations is presented in the ESI† 2.1.
2.3 Mathematical modelling
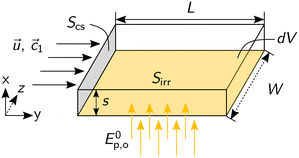
Fig. 3 depicts the cuboidal balance volume dV, which consists of a fluid of concentration c(t, x, y) = ![[c with combining right harpoon above (vector)]](https://www.rsc.org/images/entities/i_char_0063_20d1.gif) flowing through the cross-section S with a velocity
flowing through the cross-section S with a velocity ![[u with combining right harpoon above (vector)]](https://www.rsc.org/images/entities/i_char_0075_20d1.gif) (x) in y-direction. The balance volume is irradiated perpendicular to the flow direction through area Sirr with a homogeneously distributed photon fluence rate Ep = const.
(x) in y-direction. The balance volume is irradiated perpendicular to the flow direction through area Sirr with a homogeneously distributed photon fluence rate Ep = const.
The following model assumptions were used:
• homogeneous single-phase,
• convective pressure driven mass transport,
• dispersive mass transport in y (axial) and x (transversal) direction, and constant values along z direction,
• laminar flow as explicit parabolic velocity profile,
• unimolecular reaction,
• local photochemical reaction rate based on the evaluation of the radiation field (LVRPA),
• monochromatic irradiation,
• thermal back, and photodegradation reactions are neglected,
• isothermal operation.
The material balance of a species i is expressed as:
 | (6) |
![[x with combining right harpoon above (vector)]](https://www.rsc.org/images/entities/i_char_0078_20d1.gif) , t) (see eqn (1) and (3)). The velocity
, t) (see eqn (1) and (3)). The velocity ![[u with combining right harpoon above (vector)]](https://www.rsc.org/images/entities/i_char_0075_20d1.gif) in y-direction is expressed as a parabolic velocity profile with the mean flow velocity
in y-direction is expressed as a parabolic velocity profile with the mean flow velocity  :
: | (7) |
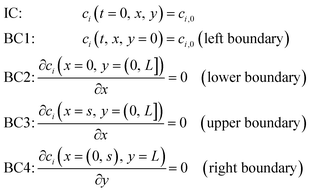 | (8) |
The photon transport is simplified by a two-flux approximation for one-sided irradiation (see eqn (S6)†) in a rectangular geometry and two absorbing species:71,72
 | (9) |
 | (10) |
 of the key component i at the inlet and outlet of the reactor:
 | (11) |
Because the cross-section area Scs is constant, the mean molar flux, ![[J with combining macron]](https://www.rsc.org/images/entities/i_char_004a_0304.gif) i instead of the mean molar flow
i instead of the mean molar flow  is used for the calculation of the conversion. The mean molar flux in the x-direction at the reactor's outlet (y = L) depends on the local velocity u(x) and the local concentration ci(x), and is calculated by integrating Ji from x1 = 0 to x2 = s:
 | (12) |
Assuming plug flow (![[u with combining right harpoon above (vector)]](https://www.rsc.org/images/entities/i_char_0075_20d1.gif) = ū) within the reactor, the mean molar flux
= ū) within the reactor, the mean molar flux ![[J with combining macron]](https://www.rsc.org/images/entities/i_char_004a_0304.gif) i at the reactor outlet is calculated from the mean concentration
i at the reactor outlet is calculated from the mean concentration ![[c with combining macron]](https://www.rsc.org/images/entities/i_char_0063_0304.gif) i along the x-direction:
i along the x-direction:
 | (13) |
 | (14) |
 | (15) |
![[u with combining right harpoon above (vector)]](https://www.rsc.org/images/entities/i_char_0075_20d1.gif) = ū is assumed, iii) the concentration change perpendicular to the flow direction (x-coordinate) is negligible, and iv) an average volumetric rate of photon absorption (AVRPA) is assumed, thus no local reaction rate is calculated. These assumptions are very strong, but common simplification in photochemical reaction engineering. The reaction rate gradient must remain small in experimental investigations to be consistent with the model assumptions, which is controlled by the following parameters: small concentration differences, short optical path lengths, short reaction times and low photon fluence rate.
= ū is assumed, iii) the concentration change perpendicular to the flow direction (x-coordinate) is negligible, and iv) an average volumetric rate of photon absorption (AVRPA) is assumed, thus no local reaction rate is calculated. These assumptions are very strong, but common simplification in photochemical reaction engineering. The reaction rate gradient must remain small in experimental investigations to be consistent with the model assumptions, which is controlled by the following parameters: small concentration differences, short optical path lengths, short reaction times and low photon fluence rate.
The material balance of a species i is expressed as:
 | (16) |
| ci(y = 0) = ci,0. | (17) |
The expression of the reaction rate rp for a photochemical step induced by monochromatic light is used as the average absorbed photon flux density 〈Lap〉V (average volumetric rate of photon absorption, AVRPA):
| rp = Φ·〈Lap〉V. | (18) |
 at wavelength λ. The absorbed photon flux density 〈Lap〉V is written as:
 | (19) |
For a collimated beam of radiation (![[x with combining right harpoon above (vector)]](https://www.rsc.org/images/entities/i_char_0078_20d1.gif) = x), eqn (5) reduces to Lp,
= x), eqn (5) reduces to Lp,![[capital Omega, Greek, vector]](https://www.rsc.org/images/entities/i_char_e1d9.gif) (
(![[x with combining right harpoon above (vector)]](https://www.rsc.org/images/entities/i_char_0078_20d1.gif) , t) = Ep,o(
, t) = Ep,o(![[x with combining right harpoon above (vector)]](https://www.rsc.org/images/entities/i_char_0078_20d1.gif) , t), thus the absorbed photon flux density 〈Lap〉V can be calculated with:
, t), thus the absorbed photon flux density 〈Lap〉V can be calculated with:
 | (20) |
![[x with combining right harpoon above (vector)]](https://www.rsc.org/images/entities/i_char_0078_20d1.gif) , t). Inserting the expression of the photochemical reaction rate rp into the material balance (see eqn (16)), and integrating over the volume V yields a differential equation for the conversion X1:30
, t). Inserting the expression of the photochemical reaction rate rp into the material balance (see eqn (16)), and integrating over the volume V yields a differential equation for the conversion X1:30 | (21) |
| A0e = c1,0·(κ1 + κ2)·s, | (22) |
 | (23) |
 | (24) |
 | (25) |
The non-linear ordinary differential equation was solved numerically as initial value problem over tr. Eqn (16) was fitted to the experimental results by varying the quantum yield Φ and minimizing the sum of squared residuals r = fexp − f(X, qemp, tr, Φ). Numerics and parametrization were implemented in Python with the following packages: NumPy, SciPy, LMFIT.74–77
2.4 Model application to studied photoreactors
 | (26) |
 | (27) |
 | (28) |
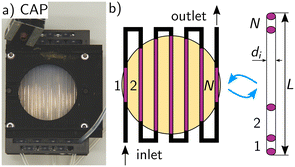 | ||
| Fig. 4 a) Picture of the capillary photoreactor. b) Schematic representation of the volume of the capillary reactor and the segmental assembly of the used control volume V = A·L. | ||
The geometric transformation of a cylinder into a cuboid can only be valid if the volume of the actual cylindrical reactor is equal to that of the cuboidal model reactor. The model only works for a cuboid geomery, while the actual reactor is a tube. Hence, for a valid application of the model on the real geometry the volume of both is assumed to be equal.
 | (29) |
| Sirr = L·di, | (30) |
 | (31) |
 | (32) |
The reaction time t is estimated from the hydrodynamic residence time τ in the irradiated volume/segment of the reactor:
 | (33) |
To obtain a reproducible initial concentration for parameter fitting of the quantum yield, the reaction solution was thermally equilibrated under dark conditions for several hours. Thus, the boundary condition (see eqn (17)) was initialized as:
 | (34) |
Studies on the residence time distribution of capillary tubes with different diameters indicate that Bodenstein numbers in the range of 100 to 150 are realistic for a diameter of 1.6 mm.79 The lower limit for the Bodenstein number of an ideal flow reactor (PFR) is also about 100. Thus this value was used for the simulations of the 2Dt model.
The upper limit of the axial dispersion coefficient Dy is calculated using the definition of the Bodenstein number Bo:
 | (35) |
The molecular diffusion coefficient Dm for species 1 in ethanol was estimated using the Wilke–Chang equation, which provides a correlation for diffusion coefficients in diluted solutions, to assess transversal dispersion (see ESI† 2.3).80 The calculated value for the molecular diffusion coefficient Dm is used as the lower boundary case for the transversal dispersion coefficient Dx.
The collimation factor Λ specifies the spatial emission characteristic of rays from the light source. A collimated emission can only be assumed for very short distances between the light source and the reaction site or for special light sources, such as lasers. In real systems, the value ranges from 1 to 2, depending on the light source used.
For the purpose of comparing the 1Ds and 2Dt models presented in section 3.1.2, the 2Dt model of the capillary photoreactor was simulated with a collimation factor of Λ = 1.
The model parameters for the capillary photoreactor, as utilized in both the 1Ds and 2Dt models, are summarized in Table 1.
| Operation conditions | |
|---|---|
| c 1,0 | 3.1 mmol L−1 |
![[V with combining dot above]](https://www.rsc.org/images/entities/i_char_0056_0307.gif)
|
1 mL min−1 to 100 mL min−1 |
| Re | 8.83 to 883 |
| Geometry | |
|---|---|
| L | 0.495 m |
| d i | 1.5875 mm |
| s | 1.2468 mm |
| V | 0.98 mL |
| Light source | |
|---|---|
| Λ | 1 |
| λ 1 | 365 nm |
| P e1 | 0.663 W |
| η el | 0.275 |
| η sys | 0.54 |
| Photophysical/photokinetic parameters | |
|---|---|
| κ 1 (365 nm) | 1302 m2 mol−1 |
| κ 2 (365 nm) | 3959 m2 mol−1 |
| Φ | 0.14 |
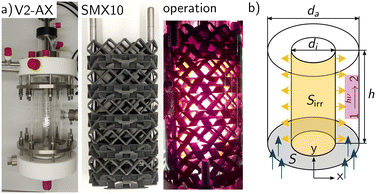 | ||
| Fig. 5 a) Picture of the annular mini-plant photoreactor with static mixer (SMX10). b) Representation of the annular geometry of the mini-plant photoreactor.45,46 | ||
The annular geometry is converted into a cuboid volume (see Fig. 3) and the following definitions are introduced: the optical path length s in the x direction, the length of the cuboid L in the y direction, as well as the cross-sectional area Scs and the irradiated area Sirr:
 | (36) |
| L = h, | (37) |
 | (38) |
| Sirr = πdi·L. | (39) |
Two MISCOP configurations were analysed using the 2Dt model: the empty photoreactor (EMPTY) and the photoreactor with a static mixer (SMX10). The crucial geometric assumption is the estimation of the length of the reaction zone and, consequently, the incident photon flux per area. In the analysis of the radiation field simulations using OpenFOAM®, it was determined that the length of the light source closely approximates the length of the reaction zone in the y direction: L = 0.1 m.46
The installation of the 10 SMX mixers reduces the fluid volume of the reactor, necessitating an adjustment for the SMX10 model parameters to ensure comparability with the empty reactor, characterized by an optical path length of 20 mm, this characteristic length s is kept constant for both models. The reduction in available volume, described by the volume fraction ε, increases the actual average velocity in the SMX configuration, as the volume flow remains constant.
 | (40) |
| Va = Scs·L − VSMX. | (41) |
The volume of the SMX mixers, VSMX, is 0.0982 L along a length of L = 0.1 m. The cross-section area Scs of the SMX10 changes according to the volume reduction caused by the static mixer.
The available experimental and theoretical results on the hydrodynamics and radiation field of the MISCOP system are used for the mathematical description of the photoreactor. The hydrodynamic analysis provides the experimental Bo numbers for a range of static mixers. The model parameter for axial dispersion, Dy, is determined from the experimental residence time distribution of the MISCOP. The axial dispersion coefficient Dy is calculated using eqn (35) for a volumetric flow rate of ![[V with combining dot above]](https://www.rsc.org/images/entities/i_char_0056_0307.gif) = 4 L min−1 and the characteristic length L = h of the cuboid balance volume.
= 4 L min−1 and the characteristic length L = h of the cuboid balance volume.
Furthermore, the influence of static mixers on the radiation field in the reactor was investigated by utilizing the photon utilization factor, ηsys, of the reactor setup determined in a predecessor publication for various static mixers.46 The static mixers shade the reaction space from the photons, thereby reducing the initial photon flux density, E0p,o. The photon utilization factor of the MISCOP system generally depends on the three-dimensional local concentration field, which was previously considered for the simulation of the radiation field under the assumption of a constant linear Napierian absorption coefficient α for the two limiting cases, the reaction start and end. Simplifying the MISCOP system modeling, the average photon utilization factor from these two boundary cases was utilized.46 Thus, the boundary condition for photon transport is given by (see Gl. (10)):
 | (42) |
In section 3.2, experimental results are compared with the theoretical results of the 2Dt model. Experimentally, the reaction solution in the storage tank was irradiated with a wavelength of 540 nm to switch back the reaction system photochemically and ensure a reproducible initial concentration c1,0 before the actual irradiation with a wavelength of 365 nm was started. Therefore, the initial and boundary conditions (see eqn (8)) can be initialized by:
| c1(t = 0, x, y) = c1,0 | (43) |
| X1(t = 0, x, y) = 0. | (44) |
Table 2 summarizes the model parameters for the MISCOP system without mixing elements (EMPTY) and with mixing elements (SMX10).
| Model | EMPTY | SMX10 |
|---|---|---|
| Operating condition | ||
| c 1,0 | 0.37 mmol L−1 | |
![[V with combining dot above]](https://www.rsc.org/images/entities/i_char_0056_0307.gif)
|
4 L min−1 | |
| Re | 350 | 436 |
| Geometry | ||
|---|---|---|
| L | 0.1 m | 0.1 m |
| d i | 0.06 m | 0.06 m |
| d o | 0.1 m | 0.1 m |
| s | 20 mm | 20 mm |
| V | 0.5 L | 0.5 L |
| Photophysical/photokinetic parameter | ||
|---|---|---|
| κ 1 (365 nm) | 1302 m2 mol−1 | |
| κ 2 (365 nm) | 3959 m2 mol−1 | |
| A 0e | 39.16 | 39.16 |
| Φ | 0.143 | |
3 Results
3.1 Analysis of capillary photoreactor
The operating window of the used capillary reactor is chosen to ensure low conversion, which is achieved by a low photon flux and short reaction/residence times. On the other hand, full absorption of the solution is required to avoid transmission through the capillary, thus a Napierian absorbance of Ae > 2 of the irradiated solution is crucial. Given these requirements are fulfilled, the 1D model (see eqn (21)) allows for determining the overall chemical quantum yield that describes the intrinsic efficiency of all elementary photophysical and photochemical steps.57,59,81
The quantum yield Φ of the reaction of the photoisomerization (see Fig. 2a), dissolved in technical grade ethanol (EtOH (tech)), was determined in a capillary photoreactor. Experiments for different flow rates (![[V with combining dot above]](https://www.rsc.org/images/entities/i_char_0056_0307.gif) = 75 to 100 mL min−1), incident photon fluxes (q0p = 0.07 × 10⁻² to 0.3 μmol s−1), and two concentrations c1,0 = [3.1, 2.17] mol m−3 were conducted in a differential mode of operation.
= 75 to 100 mL min−1), incident photon fluxes (q0p = 0.07 × 10⁻² to 0.3 μmol s−1), and two concentrations c1,0 = [3.1, 2.17] mol m−3 were conducted in a differential mode of operation.
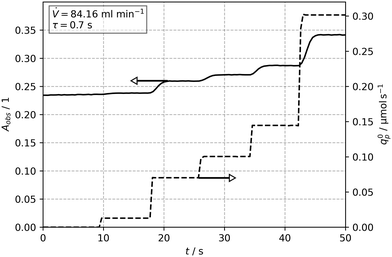
Fig. 6 shows the temporal evolution of the observed absorbance Aobs for a constant flow rate of ![[V with combining dot above]](https://www.rsc.org/images/entities/i_char_0056_0307.gif) = 84 mL min−1 (tr = 0.7 s), and a step-wise increase of the incident photon flux q0p. The stepwise increase of the photon flux causes a swift and stable response in the absorbance after a few seconds. After each step, the final and thus stable values were then used to obtain the concentration and conversion values for further evaluation (see Tables S1 and S2†). The variation of the flow rate lead also to a corresponding change of the reaction time, tr. Subsequent parameter fitting using the X1 and tr data with eqn (21) resulted in values for Φ = f(qp, c1,0) between 0.138 to 0.149 for the different incident photon fluxes and initial concentrations. A mean value of Φ = 0.14 for 8 operating points (2 concentrations and 4 photon fluxes) was calculated.
= 84 mL min−1 (tr = 0.7 s), and a step-wise increase of the incident photon flux q0p. The stepwise increase of the photon flux causes a swift and stable response in the absorbance after a few seconds. After each step, the final and thus stable values were then used to obtain the concentration and conversion values for further evaluation (see Tables S1 and S2†). The variation of the flow rate lead also to a corresponding change of the reaction time, tr. Subsequent parameter fitting using the X1 and tr data with eqn (21) resulted in values for Φ = f(qp, c1,0) between 0.138 to 0.149 for the different incident photon fluxes and initial concentrations. A mean value of Φ = 0.14 for 8 operating points (2 concentrations and 4 photon fluxes) was calculated.
Fig. 7 depicts the experimental data set and the solution of eqn (21) for Φ = 0.14, confirming the validity of the fitting procedure. The conversion X1 at t = 0 is greater than zero, since fresh solutions were thermally equilibrated overnight to ensure a constant initial concentration c1,eq across all experiments. A quantum yield of Φ = 0.17 in ethanol for flash photolysis experiments was reported by Görner for irradiation with a 354 nm laser at 25 °C.59 Aillet et al. carried out experiments in a spiral shaped micro-photoreactor setup with one third of the diameter used in this study (d = 508 μm), and reported a quantum yield of Φ = 0.24 in ethanol.31 A lower quantum yield (Φ = 0.14) observed in this work is reasoned by an increase of the solvent's polarity (EtOH (tech), containing water).57,82
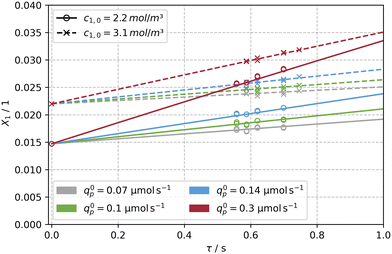 | ||
| Fig. 7 Experimental data (×, ○) obtained from the capillary reactor and solution of the model (see eqn (21), —, --) for a determined quantum yield of Φ = 0.14. The model was evaluated for two initial concentrations of c1,0 = [3.1, 2.17] mol m−3 and four photon fluxes in the range of qp = 0.07 to 0.3 μmol s−1 along reaction times of tr = 0.56 to 0.7 s. | ||
The excellent agreement between the quantum yield of this work and literature values is attributed to respecting the operating window for conducting photokinetic experiments, i.e. X < 0.05. In addition, the capillaries of the photoreactor are arranged such that the superimposed effect of self-shading is hydrodynamically counteracted by secondary flows, which are induced when redirecting the capillaries at the beginning and end of the scaffold (see Fig. S1a†), similar to the intensification of mass transport by coiled flow inverters. The laminar, parabolic velocity profile is disturbed by secondary flow structures such as Dean vortices, homogenizing the concentration in the cross-section of the capillary.83–85 Assuming a critical De number of 54 and a radius of curvature rc of 1.5 times the inner diameter of the capillary, the following relationship results:
 | (45) |
Consequently, Dean vortices occur for Re numbers above 93, which applies to the photokinetic operating range of the capillary photoreactor. This effect further justifies the assumption of plug-flow in eqn (16) and introduces this type of photoreactor and evaluation method as a valid option for conducting photokinetic experiments.
The 2Dt model used the quantum yield (Φ = 0.14) obtained from the parameter estimation with the 1Ds model. The dispersion coefficients were assigned either a value of the molecular diffusion coefficient (lower boundary) or a value derived from a Bodenstein number of 100 (upper boundary).79 Additionally, either ideal plug flow with a constant velocity profile ![[u with combining overline]](https://www.rsc.org/images/entities/i_char_0075_0305.gif) or an ideal laminar Poiseuille flow with parabolic velocity profile
or an ideal laminar Poiseuille flow with parabolic velocity profile ![[u with combining right harpoon above (vector)]](https://www.rsc.org/images/entities/i_char_0075_20d1.gif) were applied. The collimation factor Λ was assigned as either one or two to evaluate the extreme cases of a fully collimated and an isotropic emission.
were applied. The collimation factor Λ was assigned as either one or two to evaluate the extreme cases of a fully collimated and an isotropic emission.
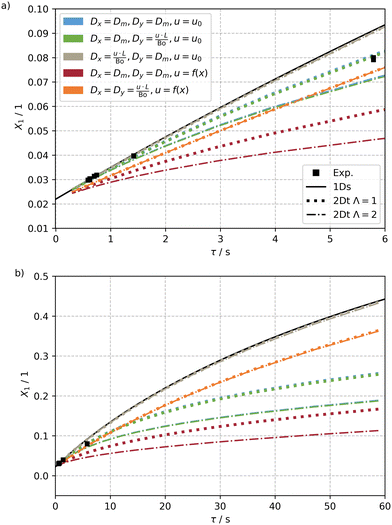
The results of the simulations of this sensible set of these parameters for the 2Dt and the 1Ds model as well as the experiments are shown in Fig. 8a for the experimentally studied residence time τ, ranging from 0 to 6 s, and a ten times longer period in Fig. 8b. Only results for the highest investigated incident photon flux q0p = 0.3 μmol s−1 are shown. Results for further photon fluxes q0p = 0.07 × 10⁻² to 0.14 μmol s−1 can be found in the ESI† (see Fig. S7).
An analysis of the results reveals that the simple 1Ds model predicts conversion well only for residence times below 1 s. For longer residence times, the model overpredicts the experimentally measured conversion, but also the conversions calculated by the other models.
For a dispersion coefficients identical to the molecular diffusion coefficient and a constant velocity profile, an increasing deviation from the high values of the 1Ds model was found (blue curves). The deviation is even more pronounced for an isotropic emission. These deviations stem from formation of transversal concentration gradients compensated by the transversal dispersion, which in this case occurs only slowly by molecular diffusion. Consequently, the gradients get more and more pronounced with reactor length. Close to the irradiated wall x = 0, the reactant is rapidly converted to the product, which absorbs light about three times as effective as the reactant. Meanwhile, at the far side from the irradiation, almost no reaction is taking place, as only a tiny fraction of light reaches this part of the reactor. This aggravating effect is even more pronounced when the light source is divergent, because in that case the exponential drop of the photon flux is twice as severe, causing a larger fraction of the reactor to be unutilised.
Increasing the axial dispersion coefficient Dy by several orders of magnitude, defined by the Bodenstein number, has virtually no effect on the conversion (green curves). The concentration gradients are much steeper in transversal direction, on which the axial dispersion has no direct influence and thus just a very limited impact on the conversion is found.
Increasing the transversal dispersion coefficient instead of the axial one results in much higher conversion (gray curves), quite comparable to the results of the 1Dt model. The fast transversal dispersion mitigates the evolution of strong concentration gradients and thus the effect of self-shading. In line with this, the collimation factor has almost no effect on the conversion.
For a Poiseuille flow velocity profile instead of a constant velocity and only molecular dispersion in axial and transversal directions (red curves), the collimation factor is of greater importance again. In this case, the locations closest to the irradiation experience higher conversions even earlier in the capillary due to the low flow velocity in this zone. This negatively impedes the photon flux incident on the core flow, where the flow velocity is highest, and all parts further away from the irradiated side. Thus, the calculated conversions are the lowest observed in this study. For a collimation factor of 2 even lower conversions are found due to the more pronounced attenuation of the photon flux.
Combining high values for the dispersion coefficients with a Poiseuille flow velocity distribution results in an increased conversion (orange curves) compared to the previous case. While the axial dispersion is largely irrelevant, the increased transversal dispersion increases conversion. The non-constant velocity profile leads to the opposite effect. Albeit the obtained conversion values are not as high as for the 1Ds model, they are quite close to them for long residence times, but also unexpectedly low for low residence times. This may suggest that the impact of the velocity distribution outweighs the effect of dispersion at low residence times with high flow velocities. For longer residence times there is more time for the dispersive mass transport to occur, eventually equalising the concentration field and thus leading to a higher conversion. For this case the calculated results are also quite close to the experimental ones obtained at about 5.8 s of residence time (this also holds for results calculated for different photon fluxes, see ESI†).
Interestingly, experimental results for very low residence times below 1 s are best described by assuming a fast transversal dispersion and a constant velocity profile (gray curves) (see Fig. S8†). This is reasoned by more intense Dean vortices that occur with higher flow velocities at low residence times, which is in good agreement with the experimental findings for residence times below 1 s (squares).
The residence time above which Dean vortices become unstable and contribute less intensively to a mixing of the flow was estimated to t = 5.7 s (see eqn (45)). Experimentally, a reduced conversion has already been observed for t = 5.8 s. Presumably, the convection induced by the Dean vortices decreases significantly for longer residence times, resulting in a velocity profile that is more similar to a Poiseuille flow. Thus, the last case (orange) fits the experimental data best when all photon fluxes are considered (see ESI†).
Two main conclusions can be drawn from the simulations with the 2Dt model. First and most important, the 1Dt model is properly describing the reactor behaviour for low residence times and thus can be used to generate valid estimates for the quantum yield. Second, for longer residence times, especially when a target conversion of more than 10% is desired, the 2Dt model provides superior predicting capabilities. However, since the precision relies heavily on a known velocity profile and dispersion coefficients, these should be estimated prior to simulation either by experiments, fluid dynamic simulations or from correlation functions.
3.2 Analysis of mini-plant photoreactor (MISCOP)
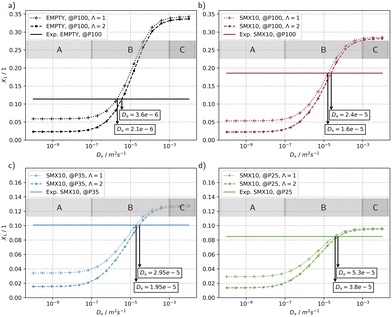
The results of a parameter study of the transversal dispersion coefficient Dx for the configuration of the MISCOP system without a mixer (EMPTY) and at a power of P = 100% is shown in Fig. 9a. Fig. 9b–d show the MISCOP system with a mixer (SMX10) at 3 different power levels: P = 100%, P = 35%, and P = 25%. In all cases, an increase in conversion with an increasing transversal dispersion coefficient Dx is predicted. Three distinct regions of transversal dispersion coefficients Dx can be assigned: i) a region where transversal mass transport is limited (Dx < 1 × 10⁻⁷, region A), ii) a region B that is sensitive to the transversal mass transport, and iii) a region where the transversal mass transport is not limiting (Dx > 1 × 10⁻³, region C). Another conclusion that can be drawn is that the conversion depends on the emission properties of the light source. In the mass transport-limited region (region A), lower conversion values are expected for isotropic light distribution, while in the unrestricted mass transport region (region C), the emission characteristics of the light source do not cause differences between the models. Region B reflects operating conditions of a real reactor, with the conversion being dependent on the time constants of mass transport and the reaction.
The lower conversion in region A for an isotropic photon propagation can be attributed to the slow molecular diffusion in x-direction, which is insufficient to compensate the concentration gradient in the same direction. Thus, strongly absorbing layers of the product are formed, which are particularly unfavourable when photons are not incident perpendicular to the reaction solution. In region C, the unrestricted mass transport compensates for the larger gradient of light absorption of isotropic emission, thus making the conversion independent of the emission characteristics.
The calculated conversion in the mass transport-limited region (region A) is similar for the EMPTY and SMX10 configurations (X1(EMPTY) = 0.059 and X1(SMX10) = 0.053, respectively), even though the SMX10 configuration has a lower photon utilization efficiency ηsys than the EMPTY configuration. This is attributed to the higher axial dispersion coefficient Dy (BoSMX10 > BoE) in the EMPTY configuration. The reduced incident photon flux, thus the lower self-shading by the formed species 2 is compensated by an enhanced axial mass transport, resulting in similar conversions.
The lower conversion of the SMX10 configuration without mass transport limitation (region C) can be attributed to the lower photon utilization factor ηsys and the reduced residence time compared to the EMPTY configuration.
The real transversal dispersion coefficient Dx can be derived by comparison of the simulations with experimental data. The experimental results are indicated as solid line in the diagrams. Generally, a 6.67 to 7.62 times increase of Dx can be observed when using static mixers, depending on the collimation factor Λ.
In Fig. 10, the concentration and radiation fields in the MISCOP are depicted as dimensionless concentration  and dimensionless photon flux density
  under stationary conditions (t = 20 s) for the reactor configurations EMPTY and SMX10. The dimensionless spatial coordinates
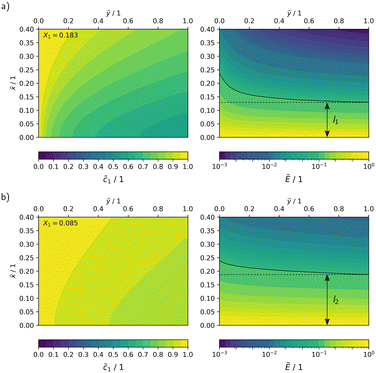
 ![[x with combining tilde]](https://www.rsc.org/images/entities/i_char_0078_0303.gif) and ỹ are normalized by the optical path length s and the reactor length L, respectively. The calculations were conducted for a collimation factor of Λ = 1 and the corresponding transversal dispersion coefficient Dx. In the empty photoreactor (EMPTY), the concentration field indicates a confined reaction zone along the x-axis, ending at
and ỹ are normalized by the optical path length s and the reactor length L, respectively. The calculations were conducted for a collimation factor of Λ = 1 and the corresponding transversal dispersion coefficient Dx. In the empty photoreactor (EMPTY), the concentration field indicates a confined reaction zone along the x-axis, ending at ![[x with combining tilde]](https://www.rsc.org/images/entities/i_char_0078_0303.gif) ≈ 0.45. Consequently, the EMPTY configuration utilizes merely about 50% of the available reaction volume in the x-direction.
≈ 0.45. Consequently, the EMPTY configuration utilizes merely about 50% of the available reaction volume in the x-direction.
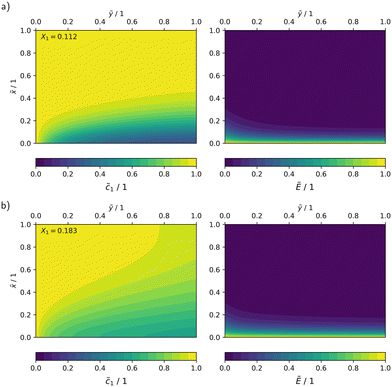 | ||
Fig. 10 Dimensionless representation of the concentration ![[c with combining tilde]](https://www.rsc.org/images/entities/i_char_0063_0303.gif) and photon flux density Ẽ, calculated using the 2Dt model with a collimation factor of Λ = 1 for two configurations: a) EMPTY, b) SMX10. and photon flux density Ẽ, calculated using the 2Dt model with a collimation factor of Λ = 1 for two configurations: a) EMPTY, b) SMX10. | ||
Due to the significant enhancement of transversal mass transport in the SMX10 configuration, pronounced concentration changes in the x-direction are found towards at the reactor exit, eventually resulting in a higher conversion.
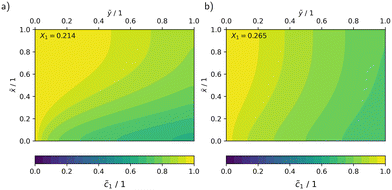
Fig. 11 presents the results of the concentration field of the SMX10 configuration for transversal dispersion coefficients increased by 2 (Fig. 11 (a)) and 10 (Fig. 11 (b)) times. The concentration gradients in the x-direction diminish along the reactor length, and a twofold or tenfold increase in Dx leads to conversions of 21.4% and 26.5%, respectively. This significant increase in conversion emphasizes the potential of optimized static mixer designs for a more efficient utilization of the reactor volume. The studied static mixers have not yet been optimized for an application in photoreactors and thus offer considerable potential for optimization.
![[x with combining tilde]](https://www.rsc.org/images/entities/i_char_0078_0303.gif) ≈ 0). This increases the demand for mass transport. The absolute reaction rate gradient is four times steeper with a higher photon flux, leading to faster product formation near the reactor wall. Furthermore, an analysis of the radiation field shows a reduction in the reaction zone, visualized by lines of constant photon flux density (Ẽ ≈ 0.1). The optical path length at the reactor exit, where this photon flux rate is reached, decreases from l2 ≈ 0.19 to l1 ≈ 0.13 when the relative light power increases from PLED = 25% to PLED = 100%, indicating a reduction of the reaction zone by approximately 30%. This amplifies the detrimental self-shading effect, which restricts the overall reaction rate and results in less efficient photon utilization.
≈ 0). This increases the demand for mass transport. The absolute reaction rate gradient is four times steeper with a higher photon flux, leading to faster product formation near the reactor wall. Furthermore, an analysis of the radiation field shows a reduction in the reaction zone, visualized by lines of constant photon flux density (Ẽ ≈ 0.1). The optical path length at the reactor exit, where this photon flux rate is reached, decreases from l2 ≈ 0.19 to l1 ≈ 0.13 when the relative light power increases from PLED = 25% to PLED = 100%, indicating a reduction of the reaction zone by approximately 30%. This amplifies the detrimental self-shading effect, which restricts the overall reaction rate and results in less efficient photon utilization.
The photonic efficiency ξ can be used as performance indicator to assess the efficiency of light utilization. It can be calculated as:
 | (46) |
In the MISCOP system without internal mixing elements, the absorbed photon flux qap matches the emitted photon flux of qem = 132 μmol s−1, given that the reaction solution's absorption is adequately high. A photonic efficiency of ξ(PLED = 25%) = 0.0238 was calculated for a relative light source power of PLED = 25%, while a photonic efficiency of ξ(PLED = 100%) = 0.0128 was determined for PLED = 100%.
As a result of the occurring mass transport limitation, the photonic efficiency for a relative power of PLED = 100% is halved compared to operating the light source at a relative power of PLED = 25%. These findings emphasize the need to align the time constants of reaction and mass transport, either by lowering the relative light power or by enhancing mass transport, to ensure efficient photoreactor operation.
Currently, the technical limit for the length of LED light sources is approximately 2 m. Developing longer light sources requires enlarging the diameter of the electrical connections, which in turn increases both the diameter of the light source and the overall diameter of the photoreactor. Further scaling can be achieved by using a system with multiple lamps.86
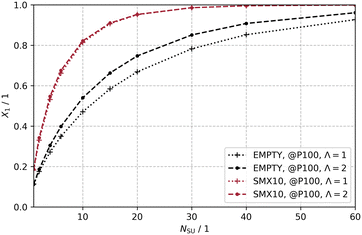
A theoretical study on the scale-up is conducted using the 2Dt model and an 80 × 40 grid (Nx, Ny). The reactor volume of the single-unit photoreactor is increased by Nsu stages, while the power of the light source is also multiplied by Nsu to maintain the same reaction conditions through a constant photon flux density E0p,o.
Increasing the reaction volume naturally leads to a longer residence time τ of the reactants in the reactor, which is why the end of the integration time tend is adjusted accordingly (tend = τ). By increasing the reactor length, reaction conditions are created that are expected to result in complete conversion, as no reactions are considered in which species 2 is converted. The higher the dispersive mass transport and the more efficient the photon transfer, the fewer stages Nsu are needed to reach complete conversion.
Fig. 13 shows the scaling-up for the two discussed configurations: EMPTY and SMX10 for Λ = 1 and Λ = 2. Increasing the number of stages leads to higher conversion in both configurations. The SMX10 configuration at Λ = 1 is capable of achieving full conversion at Nsu = 40, while the EMPTY configuration delivers a conversion of X1 = 0.85. It is evident that the prediction of conversion in scaled photoreactors crucially depends on the nature of the light source, which emits either directed or undirected photons. This effect is particularly noticeable in photoreactors with mass transport limitations. The difference in conversion between Λ = 1 and Λ = 2 at Nsu = 40 is ΔX1 = 0.078 for the EMPTY configuration, and no significant difference is observed for the SMX10 configuration. Ultimately, the conversion for Nsu = 20 is increased by a factor of 1.42 or 1.27, depending on Λ, when static mixers are used in a realistically scaled photoreactor of 2 m length.
4 Conclusions
The scale-up of photoreactors can only be enabled by reducing transport limitations of photoreactions mainly due to laminar flow conditions and a smart reactor design to counteract the exponential decline of the radiative transport. For the studied case of competitive absorption of photons by reactants and products, the interaction between photon and transport processes becomes even more important. In a narrow reaction zone close to the light source, steep reaction rate gradients occur, which demand for an intensification of the mass transport. Consequently, understanding the impact of mass transport in photoreactors is key for high-performance reactors.In this study, a comprehensive model was developed to assess local reaction conditions in the MISCOP system to elaborate the complex interplay between transport processes and self-shading reactions. The model development and parametrization was based on previous analysis of the hydrodynamics and the radiation field. Together with the determined quantum yield of the studied photoisomerization, it was possible to calculate locally resolved concentration profiles. The results demonstrate that the hydrodynamic situation in the photoreactor can effectively be manipulated by installing static mixers, eventually increasing the overall efficiency of the photoreactor. The comparison of the numerical solution with experimental results allowed, for the first time, the determination of the transversal dispersion coefficient for a large scale photoreactor system with static mixers. The developed model is also capable of estimating the scalability of photoreactors. Scale-up studies emphasize that a successful scale-up of self-shading reactions is only possible by ensuring fast mass transport.
It is concluded, that the impact of transport processes can not be underestimated for the scale-up of photoreactors. An increase in capacity always requires an increase of the photon flux provided to the photoreactor. Realizing this by raising the power of single light sources leads to a larger photon flux, which will find its natural scale-up limit as soon as the maximum rate of mass transport is reached. Hence, concepts to provide fast mass transport in photoreactors are required for the scale-up of intensified photoreactors.
List of symbols
Abbreviations
| AVRPA | Average volumetric rate of photon absorption |
| CFD | Computational fluid dynamics |
| LED | Light-emitting diode |
| LVRPA | Local volumetric rate of photon absorption |
| MISCOP | Modular, industrial scalable, continuously operated photoreactor |
| RTE | Radiative transport equation |
| SMX | Synonym for Sulzers SMX™-type mixers |
Latin letters
| S cs | Cross-sectional area, m2 |
| S irr | Irradiation area, m2 |
| A | Absorbance, 1 |
| Bo | Bodenstein number, 1 |
| c i | Concentration of species i, mol m−3 |
| c i,0 | Initial and feed concentration of species i, mol m−3 |
| c i,eq | Concentration of species i in thermal equilibrium, mol m−3 |
![[c with combining tilde]](https://www.rsc.org/images/entities/i_char_0063_0303.gif)
| Dimensionless concentration, 1 |
| d i | Inner diameter, m |
| d o | Outer diameter, m |
| D x | Transversal dispersion coefficient, m2 s−1 |
| D y | Axial dispersion coefficient, m2 s−1 |
| De | Dean number, 1 |
| E p,o | Photon fluence rate, mol s−1 m−2 |
| E p | Photon irradiance, mol s−1 m−2 |
| Ẽ p,o | Dimensionless photon fluence rate, 1 |
| J i | Molar flux of species i, mol s−1 m−2 |
| L | Length, m |
| L p,λ | Incident spectral photon flux density, mol s−1 cm−3 nm−1 |
| L ap | Absorbed local photon flux density, mol s−1 cm−3 |
| ṅ i | Molar flow rate of species i, mol s−1 |
| N su | Number of stages, 1 |
| N x | Number of grid point in x direction, 1 |
| N y | Number of grid point in y direction, 1 |
| P | Power, W |
| q | Radiant flux, W |
| q p | Photon flux, mol s−1 |
| r p | Photochemical reaction rate, mol m−3 s−1 |
| r c | Radius of curvature, m |
| Re | Reynolds number, 1 |
| η sys | Photonic utilization factor, 1 |
| t | Time, s |
![[u with combining overline]](https://www.rsc.org/images/entities/i_char_0075_0305.gif)
| Mean velocity, m s−1 |
![[u with combining right harpoon above (vector)]](https://www.rsc.org/images/entities/i_char_0075_20d1.gif)
| Parabolic velocity profile, m s−1 |
| V | Volume, m3 |
![[V with combining dot above]](https://www.rsc.org/images/entities/i_char_0056_0307.gif)
| Volumetric flow rate, m3 s−1 |
| s | Optical pathlength, m |
| X 1 | Conversion of species 1, 1 |
![[x with combining tilde]](https://www.rsc.org/images/entities/i_char_0078_0303.gif)
| Dimensionless coordinate in x-direction, 1 |
| ỹ | Dimensionless coordinate in y-direction, 1 |
Greek letters
| α λ | Spectral linear Napierian absorption coefficient, m−1 nm−1 |
| β | Dimensionless absorption coefficient, 1 |
| ε | Volume fraction, 1 |
| η sys | Photonic utilization factor, 1 |
| Λ | Collimation factor, 1 |
| κ | Napierian absorption coefficient, m2 mol−1 |
| Φ | Quantum yield, 1 |
| τ | Hydrodynamic residence time, s |
| λ | Wavelength, m |
| ξ | Photonic efficiency, 1 |
Superscripts
| 0 | Incident |
| a | Absorbed |
| em | Emitted |
Subscripts
| cs | Cross-section |
| su | Single unit |
| e | Natural logarithm based unit |
| exp | Experiment |
Data availability
The data that support the findings of this study are available from the corresponding author, DZ, upon reasonable request.Author contributions
F. G.: conceptualization (lead), data curation (lead), formal analysis (lead), investigation (lead), methodology (lead), software (equal), validation (lead), visualization (lead), writing – original draft (lead), writing – review and editing (equal). H. B.: conceptualization (supporting), methodology (supporting), software (equal), visualization (supporting), review and editing (equal). A. P.: funding acquisition (equal), project administration (equal), resources (equal), supervision (supporting), writing – review and editing (supporting). D. Z.: conceptualization (supporting), funding acquisition (equal), methodology (supporting), project administration (equal), resources (equal), supervision (lead), writing – review and editing (equal).Conflicts of interest
A. P. is CEO of Peschl Ultraviolet GmbH. Support for this research was provided by Peschl Ultraviolet GmbH and participated in the interpretation of data, review, and approval of this publication.Acknowledgements
This work was supported through the German Ministry of Economic Affairs and Energy (BMWi), based on a resolution of the German Parliament within the AiF/ZIM project MISCOP, grant no. ZF4654701ZG8.References
- M. Schiavello, Electrochim. Acta, 1993, 38, 11–14 CrossRef CAS.
- O. Legrini, E. P. D. Oliveros and A. M. Braun, Chem. Rev., 1993, 93, 671–698 CrossRef CAS.
- H. J. C. Jacobs and E. Havinga, in Photochemistry of Vitamin D and its Isomers and of Simple Trienes, John Wiley &Sons, Ltd, 1979, pp. 305–373 Search PubMed.
- Ü. Taştan and D. Ziegenbalg, React. Chem. Eng., 2021, 6, 82–89 RSC.
- S. Triemer, K. Gilmore, G. T. Vu, P. H. Seeberger and A. Seidel-Morgenstern, Angew. Chem., Int. Ed., 2018, 57, 5525–5528 CrossRef CAS PubMed.
- A. E. Cassano, P. L. Silveston and J. M. Smith, Ind. Eng. Chem., 1967, 59, 18–38 CrossRef CAS.
- G. Ciamician, Bull. Soc. Chim. Fr., 1908, 4, 1–27 Search PubMed.
- P. T. Anastas and M. M. Kirchhoff, Acc. Chem. Res., 2002, 35, 686–694 CrossRef CAS PubMed.
- N. Hoffmann, Photochem. Photobiol. Sci., 2012, 11, 1613 CrossRef CAS PubMed.
- H. C. Erythropel, J. B. Zimmerman, T. M. de Winter, L. Petitjean, F. Melnikov, C. H. Lam, A. W. Lounsbury, K. E. Mellor, N. Z. Janković and Q. Tu, et al. , Green Chem., 2018, 20, 1929–1961 RSC.
- H. E. Bonfield, T. Knauber, F. Lévesque, E. G. Moschetta, F. Susanne and L. J. Edwards, Nat. Commun., 2020, 11, 804 CrossRef CAS PubMed.
- N. Hoffmann, Chem. Rev., 2008, 108, 1052–1103 CrossRef CAS PubMed.
- T. Noël and E. Zysman-Colman, Chem Catal., 2022, 2, 468–476 CrossRef.
- H. Löwe, V. Hessel and A. Mueller, Pure Appl. Chem., 2002, 74, 2271–2276 CrossRef.
- E. E. Coyle and M. Oelgemöller, Photochem. Photobiol. Sci., 2008, 7, 1313–1322 CrossRef CAS PubMed.
- T. Noël, in Discovering the Future of Molecular Sciences, Wiley-VCH Verlag GmbH & Co. KGaA, 2014, pp. 137–164 Search PubMed.
- W.-Y. Lin, Y. Wang, S. Wang and H.-R. Tseng, Nano Today, 2009, 4, 470–481 CrossRef CAS PubMed.
- Z. He, Y. Li, Q. Zhang and H. Wang, Appl. Catal., B, 2010, 93, 376–382 CrossRef CAS.
- M. Oelgemoeller, Chem. Eng. Technol., 2012, 35, 1144–1152 CrossRef.
- L. D. Elliott, J. P. Knowles, P. J. Koovits, K. G. Maskill, M. J. Ralph, G. Lejeune, L. J. Edwards, R. I. Robinson, I. R. Clemens, B. Cox, D. D. Pascoe, G. Koch, M. Eberle, M. B. Berry and K. I. Booker-Milburn, Chem. – Eur. J., 2014, 20, 15226–15232 CrossRef CAS.
- C. Sambiagio and T. Noël, Trends Chem., 2020, 2, 92–106 CrossRef CAS.
- J. D. Williams and C. O. Kappe, Curr. Opin. Green Sustainable Chem., 2020, 25, 100351 CrossRef.
- G. X. de Oliveira, S. Kuhn, H. G. Riella, C. Soares and N. Padoin, React. Chem. Eng., 2023, 8, 2119–2133 RSC.
- O. M. Alfano, R. L. Romero and A. E. Cassano, Chem. Eng. Sci., 1986, 41, 421–444 CrossRef CAS.
- O. M. Alfano, R. L. Romero and A. E. Cassano, Chem. Eng. Sci., 1986, 41, 1137–1153 CrossRef CAS.
- A. M. Braun, M.-T. Maurette and E. Oliveros, Photochemical Technology, John Wiley & Sons Ltd, New York, 1991 Search PubMed.
- O. M. Alfano, M. I. Cabrera and A. E. Cassano, Chem. Eng. Sci., 1994, 49, 5327–5346 CrossRef CAS.
- R. J. Brandi, O. M. Alfano and A. E. Cassano, Chem. Eng. Sci., 1996, 51, 3169–3174 CrossRef CAS.
- M. Pasquali, F. Santarelli, J. F. Porter and P.-L. Yue, AIChE J., 1996, 42, 532–537 CrossRef CAS.
- T. Aillet, K. Loubière, L. Prat and O. Dechy-Cabaret, AIChE J., 2015, 61, 1284–1299 CrossRef CAS.
- T. Aillet, K. Loubière, O. Dechy-Cabaret and L. Prat, Chem. Eng. Technol., 2016, 39, 115–122 CrossRef CAS.
- K. Loubière, M. Oelgemöller, T. Aillet, O. Dechy-Cabaret and L. Prat, Chem. Eng. Process.: Process Intesif., 2016, 104, 120–132 CrossRef.
- H. Becker, D. Ziegenbalg and R. Güttel, Catal. Sci. Technol., 2023, 13, 645–664 RSC.
- T. Aillet, K. Loubiere, O. Dechy-Cabaret and L. Prat, Int. J. Chem. React. Eng., 2014, 12, 257–269 Search PubMed.
- B. Wriedt and D. Ziegenbalg, J. Flow Chem., 2020, 10, 295–306 CrossRef.
- J. Esteban Duran, F. Taghipour and M. Mohseni, Int. J. Heat Mass Transfer, 2009, 52, 5390–5401 CrossRef CAS.
- C. Passalía, O. M. Alfano and R. J. Brandi, J. Hazard. Mater., 2012, 211–212, 357–365 CrossRef PubMed.
- M. Subramanian and A. Kannan, Chem. Eng. Sci., 2010, 65, 2727–2740 CrossRef CAS.
- G. Vincent, E. Schaer, P.-M. Marquaire and O. Zahraa, Process Saf. Environ. Prot., 2011, 89, 35–40 CrossRef CAS.
- F. Jović, V. Kosar, V. Tomašić and Z. Gomzi, Chem. Eng. Res. Des., 2012, 90, 1297–1306 CrossRef.
- C. Casado, J. Marugán, R. Timmers, M. Muñoz and R. van Grieken, Chem. Eng. J., 2017, 310, 368–380 CrossRef CAS.
- C. Ariza, C. Casado, R.-Q. Wang, E. Adams and J. Marugán, Chem. Eng. Technol., 2018, 41, 1473–1483 CrossRef CAS.
- F. Guba, F. Gaulhofer and D. Ziegenbalg, J. Flow Chem., 2021, 11, 495–513 CrossRef CAS.
- J. Moreno-SanSegundo, C. Casado, D. Concha, A. S. Montemayor and J. Marugán, Open Res. Eur., 2021, 1, 2 Search PubMed.
- F. Gaulhofer, M. Metzger, A. Peschl and D. Ziegenbalg, Ind. Eng. Chem. Res., 2023, 62, 11456–11469 CrossRef CAS.
- F. Gaulhofer, M. Metzger, A. Peschl and D. Ziegenbalg, React. Chem. Eng., 2024, 9, 1845–1858 RSC.
- L. Buglioni, F. Raymenants, A. Slattery, S. D. A. Zondag and T. Noël, Chem. Rev., 2021, 122, 2752–2906 CrossRef PubMed.
- M. G. Beaver, E.-x. Zhang, Z.-q. Liu, S.-y. Zheng, B. Wang, J.-p. Lu, J. Tao, M. Gonzalez, S. Jones and J. S. Tedrow, Org. Process Res. Dev., 2020, 24, 2139–2146 CrossRef CAS.
- T. V. Gerven and A. Stankiewicz, Ind. Eng. Chem. Res., 2009, 48, 2465–2474 CrossRef.
- H. Böttcher, J. Bending, M. A. Fox, G. Hopf and H.-J. Timpe, Technical applications of photochemistry, Deutscher Verlag für Grundstoffindustrie, 1991, p. 274 Search PubMed.
- C. Pratley, Y. Shaalan, L. Boulton, C. Jamieson, J. A. Murphy and L. J. Edwards, Org. Process Res. Dev., 2024, 28, 1725–1733 CrossRef CAS.
- V. Hessel, H. Löwe and F. Schönfeld, Chem. Eng. Sci., 2005, 60, 2479–2501 CrossRef CAS.
- S. Liu, A. N. Hrymak and P. E. Wood, AIChE J., 2006, 52, 150–157 CrossRef CAS.
- M. K. Singh, P. D. Anderson and H. E. H. Meijer, Macromol. Rapid Commun., 2009, 30, 362–376 CrossRef CAS PubMed.
- M. Escribà-Gelonch, A. Halpin, T. Noël and V. Hessel, ChemPhotoChem, 2018, 2, 922–930 CrossRef.
- A. Behr, H. Witte and M. Zagajewski, Chem. Ing. Tech., 2012, 84, 694–703 CrossRef CAS.
- A. K. Chibisov and H. Görner, J. Phys. Chem. A, 1997, 101, 4305–4312 CrossRef CAS.
- H. Bouas-Laurent and H. Dürr, Pure Appl. Chem., 2001, 73, 639–665 CrossRef CAS.
- H. Görner, Phys. Chem. Chem. Phys., 2001, 3, 416–423 RSC.
- M. Maafi and R. G. Brown, Int. J. Chem. Kinet., 2007, 39, 539–545 CrossRef CAS.
- A. S. Kholmanskii and K. M. Dyumaev, Russ. Chem. Rev., 1987, 56, 136 CrossRef.
- H. A. Irazoqui, J. Cerdá and A. E. Cassano, Chem. Eng. J., 1976, 11, 27–37 CrossRef.
- S. E. Braslavsky, A. M. Braun, A. E. Cassano, A. V. Emeline, M. I. Litter, L. Palmisano, V. N. Parmon and N. Serpone, Pure Appl. Chem., 2011, 83, 931–1014 CrossRef CAS.
- A. E. Cassano, C. A. Martin, R. J. Brandi and O. M. Alfano, Ind. Eng. Chem. Res., 1995, 34, 2155–2201 CrossRef CAS.
- W. A. Noyes and P. A. Leighton, The Photochemistry of Gases, Dover Publications, Inc., 1941 Search PubMed.
- J. G. Calvert and J. N. Pitts, Photochemistry, John Wiley & Sons, Inc., New York, 2nd edn, 1966 Search PubMed.
- M. S. Okino and M. L. Mavrovouniotis, Chem. Rev., 1998, 98, 391–408 CrossRef CAS PubMed.
- N. Vora and P. Daoutidis, AIChE J., 2001, 47, 2320–2332 CrossRef CAS.
- T. Nien, J. Mmbaga, R. Hayes and M. Votsmeier, Chem. Eng. Sci., 2013, 93, 362–375 CrossRef CAS.
- J.-F. Cornet, Chem. Eng. Sci., 2010, 65, 985–998 CrossRef CAS.
- A. Schuster, Astrophys. J., 1905, 21, 1 CrossRef.
- J.-F. Cornet, C. Dussap, J.-B. Gros, C. Binois and C. Lasseur, Chem. Eng. Sci., 1995, 50, 1489–1500 CrossRef CAS.
- M. Sender, B. Wriedt and D. Ziegenbalg, React. Chem. Eng., 2021, 6, 1601–1613 RSC.
- G. Van Rossum and F. L. Drake, Python 3 Reference Manual, CreateSpace, Scotts Valley, CA, 2009 Search PubMed.
- C. R. Harris, K. J. Millman, S. J. van der Walt, R. Gommers, P. Virtanen, D. Cournapeau, E. Wieser, J. Taylor, S. Berg, N. J. Smith, R. Kern, M. Picus, S. Hoyer, M. H. van Kerkwijk, M. Brett, A. Haldane, J. F. del Río, M. Wiebe, P. Peterson, P. Gérard-Marchant, K. Sheppard, T. Reddy, W. Weckesser, H. Abbasi, C. Gohlke and T. E. Oliphant, Nature, 2020, 585, 357–362 CrossRef CAS PubMed.
- M. Newville, T. Stensitzki, D. B. Allen and A. Ingargiola, LMFIT: Non-Linear Least-Square Minimization and Curve-Fitting for Python, 2014 Search PubMed.
- P. Virtanen, R. Gommers, T. E. Oliphant, M. Haberland, T. Reddy, D. Cournapeau, E. Burovski, P. Peterson, W. Weckesser, J. Bright, S. J. van der Walt, M. Brett, J. Wilson, K. J. Millman, N. Mayorov, A. R. J. Nelson, E. Jones, R. Kern, E. Larson, C. J. Carey, İ. Polat, Y. Feng, E. W. Moore, J. VanderPlas, D. Laxalde, J. Perktold, R. Cimrman, I. Henriksen, E. A. Quintero, C. R. Harris, A. M. Archibald, A. H. Ribeiro, F. Pedregosa, P. van Mulbregt, A. Vijaykumar, A. P. Bardelli, A. Rothberg, A. Hilboll, A. Kloeckner, A. Scopatz, A. Lee, A. Rokem, C. N. Woods, C. Fulton, C. Masson, C. Häggström, C. Fitzgerald, D. A. Nicholson, D. R. Hagen, D. V. Pasechnik, E. Olivetti, E. Martin, E. Wieser, F. Silva, F. Lenders, F. Wilhelm, G. Young, G. A. Price, G.-L. Ingold, G. E. Allen, G. R. Lee, H. Audren, I. Probst, J. P. Dietrich, J. Silterra, J. T. Webber, J. Slavič, J. Nothman, J. Buchner, J. Kulick, J. L. Schönberger, J. V. de Miranda Cardoso, J. Reimer, J. Harrington, J. L. C. Rodríguez, J. Nunez-Iglesias, J. Kuczynski, K. Tritz, M. Thoma, M. Newville, M. Kümmerer, M. Bolingbroke, M. Tartre, M. Pak, N. J. Smith, N. Nowaczyk, N. Shebanov, O. Pavlyk, P. A. Brodtkorb, P. Lee, R. T. McGibbon, R. Feldbauer, S. Lewis, S. Tygier, S. Sievert, S. Vigna, S. Peterson, S. More, T. Pudlik, T. Oshima, T. J. Pingel, T. P. Robitaille, T. Spura, T. R. Jones, T. Cera, T. Leslie, T. Zito, T. Krauss, U. Upadhyay, Y. O. Halchenko and Y. Vázquez-Baeza, Nat. Methods, 2020, 17, 261–272 CrossRef CAS PubMed.
- D. Russo, D. Spasiano, M. Vaccaro, R. Andreozzi, G. Li Puma, N. M. Reis and R. Marotta, Chem. Eng. J., 2016, 283, 243–250 CrossRef CAS.
- S. R. L. Gobert, S. Kuhn, L. Braeken and L. C. J. Thomassen, Org. Process Res. Dev., 2017, 21, 531–542 CrossRef CAS.
- C. R. Wilke and P. Chang, AIChE J., 1955, 1, 264–270 CrossRef CAS.
- T. Bercovici, R. Heiligman-Rim and E. Fischer, Mol. Photochem., 1969, 1, 23–55 CAS.
- H. Dürr and H. Bouas-Laurent, Photochromism: Molecules and Systems, Elsevier, 1990 Search PubMed.
- W. Dean, Philos. Mag., 1927, 4, 208–223 Search PubMed.
- L. Janssen, Chem. Eng. Sci., 1976, 31, 215–218 CrossRef CAS.
- L. Sharma, K. Nigam and S. Roy, Chem. Eng. Sci., 2017, 160, 227–235 CrossRef CAS.
- L. L. Simon, M. Dieckmann, A. Robinson, T. Vent-Schmidt, D. Marantelli, R. Kohlbrenner, A. Saint-Dizier, D. Gribkov and J.-P. Krieger, Org. Process Res. Dev., 2021, 25, 2221–2229 CrossRef CAS.
Footnote |
| † Electronic supplementary information (ESI) available. See DOI: https://doi.org/10.1039/d4re00192c |
| This journal is © The Royal Society of Chemistry 2024 |

![[small eta, Greek, macron]](https://www.rsc.org/images/entities/i_char_e0c8.gif)
