 Open Access Article
Creative Commons Attribution 3.0 Unported Licence
Quantifying the influence of 3d–4s mixing on linearly coordinated metal-ions by L2,3-edge XAS and XMCD†
Myron S.
Huzan
 ab,
Timothy G.
Burrow
 ab,
Manuel
Fix
c,
Franziska A.
Breitner
c,
Sut Kei
Chong
ab,
Peter
Bencok
d,
Matteo
Aramini
d,
Anton
Jesche
c and
Michael L.
Baker
ab,
Manuel
Fix
c,
Franziska A.
Breitner
c,
Sut Kei
Chong
ab,
Peter
Bencok
d,
Matteo
Aramini
d,
Anton
Jesche
c and
Michael L.
Baker
 *ab
*ab
aDepartment of Chemistry, The University of Manchester, Manchester, M13 9PL, UK. E-mail: michael.baker@manchester.ac.uk
bThe University of Manchester at Harwell, Diamond Light Source, Harwell Campus, OX11 0DE, UK
cEP VI, Center for Electronic Correlations and Magnetism, Institute of Physics, University of Augsburg, D-86159 Augsburg, Germany
dDiamond Light Source, Harwell Science and Innovation Campus, Chilton, Didcot, OX11 0DE, UK
First published on 26th December 2023
Abstract
The mixing valence d and s orbitals are predicted to strongly influence the electronic structure of linearly coordinated molecules, including transition metals, lanthanides and actinides. In specific cases, novel magnetic properties, such as single-ion magnetic coercivity or long spin decoherence times, ensue. Inspired by how the local coordination symmetry can engender such novel phenomena, in this study, we focus our attention on dopants (Mn, Fe, Co, Ni, Cu) in lithium nitride to accept innovation from molecular magnetism in a high symmetry P6/mmm solid-state crystal. The linear coordination environment results in strong 3d–4s mixing, proving to be an ideal series to investigate the role of d–s mixing and bonding on electronic structure and magnetism. It is shown that L2,3-edge XAS can be applied to experimentally identify the presence of 3d–4s mixing and the influence this has on the ligand-field splitting. XMCD specifies how spin–orbit coupling is affected. The combined spectroscopies are analysed to determine the effect of 4s mixing with support from ab initio calculations. The results provide new insight of relevance to future applications, including quantum information processing and the sustainable replacement of rare earths in magnets.
1 Introduction
The selection of solid-state compounds with local coordination environments that mimic novel molecular complexes provides a promising route to accept innovation from molecular magnetism at a dopant site while maintaining a rigid solid-state extended coordination environment to reduce spin-phonon coupling and maintain rigorous local coordination symmetry. In this light, we look towards the growing interest in low coordination complexes within the field of molecular magnetism due to exceptional energy barriers to magnetisation reversal1,2 and high-frequency quantum clock transitions.3 It has been shown that molecular-based linearly coordinated transition metal-ions can facilitate an unquenched orbital angular momentum (L) unperturbed by Jahn–Teller distortions.4 Prominent linear single-ion magnets (SIMs) include divalent [Co(C(SiMe3)3)2]2− and monovalent [Fe(C(SiMe3)3)2]1− which exhibit pronounced magnetic remanence and slow magnetic relaxation. The former exhibits a non-Aufbau ground-state with maximal orbital angular momentum, L = 3, resulting from ligand-field energy stabilisation competing with interelectronic repulsions.In a previous study, we applied single-crystal K-edge X-ray absorption near-edge structure and extended X-ray absorption fine structure to determine that iron doped in lithium nitride (Li2(Li1−xFex)N) is mono-valent, clean of stoichiometric vacancies where Fe sites are geometrically equivalent, linearly coordinated, occupying a D6h symmetry pocket.5,6 The local geometric structure and oxidation state of Fe sites were found not to vary as a function of doping concentration (x) and variable temperature L2,3-edge XAS measurements showed that Li2(Li1−xFex)N exhibits a large spin reversal energy barrier, Ueff ≈ 33 meV.5,7,8 This energy barrier is comparable to [Fe(C(SiMe3)3)2]1−, however, the magnetisation relaxation time at low temperatures (τ) is many orders of magnitude longer in Li2(Li1−xFex)N, τ ∼ 104 s (ref. 8) than [Fe(C(SiMe3)3)2]− where τ ∼ 10−2 s. In this study, we conduct a detailed investigation of transition metal ions (TM) = Mn, Fe, Co, Ni and Cu doped in Li2(Li1−xTMx)N to investigate the role of metal-ion 3d–4s mixing and metal–ligand covalency on electronic structure and magnetism.
The mixing of d–s metal-ion orbital character and related energy stabilisation of the dz2 orbital (Fig. 1) is of general importance to fundamental understandings of electronic structure. Both ligand-field theories9–11 and ab initio calculations12,13 predict d–s orbital mixing for metal-ions spanning the periodic table from transition metals, to lanthanides14,15 and actinides.12,16 Electron paramagnetic resonance (EPR) can be applied for Kramers ions to quantify d–s orbital mixing via the hyperfine effect. Enhanced hyperfine interactions due to d–s orbital mixing have been shown to result in avoided state crossings in applied magnetic fields with enhanced phase time memory (quantum clock transitions) of relevance to quantum computing.3,17 However, evidencing d–s mixing by EPR requires a d–s hybridised orbital to be singly occupied. This specificity limits experimental quantification of d–s mixing. Consequently, most reported insights derive from calculations, including complete active space self-consistent field (CASSCF) and density functional theory (DFT).18 In this work, we identify that X-ray absorption spectroscopy (XAS) can be applied to evaluate the impact of d–s mixing on electronic structure and magnetism. To identify how the linear ligand-field, including d–s mixing, relates to spin–orbit coupling, the XAS studies are combined with X-ray magnetic circular dichroism (XMCD). The results with accompanying theoretical calculations are interpreted to obtain insights into the superior magnetic properties exhibited for Li2(Li1−xFex)N and Li2(Li1−xNix)N relative to other linearly coordinated single-ion magnets.
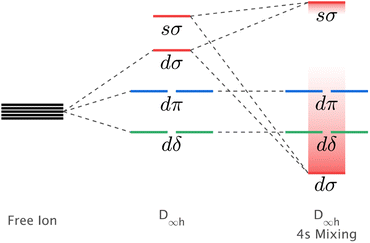 | ||
| Fig. 1 Schematic showing the influence of d–s orbital mixing on the energy of the d-orbitals for linearly coordinated transition metal ions. | ||
2 Methods
2.1 Preparation of transition metal doped Li3N
Synthesis of Li2(Li1−xMnx)N (Mn), Li2(Li1−xFex)N (Fe), Li2(Li1−xCox)N (Co), Li2(Li1−xNix)N (Ni) and Li2(Li1−xCux)N (Cu) single crystals was achieved through a Li-rich solution, concentrations of each transition metal ion were deduced to be x = 0.123(1), 0.156(2), 0.092(1), 0.167(2), 0.094(2) respectively. Detailed information on crystal synthesis is reported elsewhere.19 Metal-ion substitution within the α-Li3N matrix replaces a Li-ion situated at the 1b Wyckoff position. Li2(Li1−xTMx)N crystallises as a hexagonal lattice of Li2N layers alternating with Li1−xTMx planes perpendicular to the crystallographic c axis.2.2 Experimental
L2,3-edge XAS and XMCD measurements were performed at the I10-BLADE high-field magnet end station at Diamond Light Source, UK. Continuously scanning monochromator energy scans were acquired for each transition metal ion at the respective metal L2,3-edges: Mn (620–690 eV), Fe (690–755 eV), Co (750–840 eV), Ni (835–920 eV) and Cu (920–1000 eV), each at 0.1 eV energy intervals. Measurements were performed at 21 K within an ultra-high vacuum (10−10 bar). Total fluorescence yield (TFY) was acquired in a back-scattering geometry using a 10 × 10 mm2 silicon diode with a 150 nm Al cover to filter out emitted electrons. The Li2(Li1−xTMx)N single crystals are air sensitive. Crucibles were opened and crystals were mounted with Torr Seal to sample holders within an argon atmosphere glovebox (<0.5 ppm O2 and H2O). The samples were rapidly transferred into the XMCD load lock through a nitrogen-purged glove bag. XMCD measurements were performed at 14 T and collected through the individual detection of right (σr) and left (σl) circular polarisation with TFY detection. XAS measurements were acquired through linear horizontal polarisation (σh) and TFY detection. Background subtraction of XAS spectra was performed with a linear fitting of the pre-edge and normalised through a linear fitting of the post-edge. The 2p3/2 and 2p1/2 continuum transitions were subtracted through a double arctangent function (further details of background subtraction see ESI† of Huzan et al.5).3 Computational
3.1 Ab initio calculations
Time-dependent density functional theory (TD-DFT) and complete active space self-consistent field (CASSCF)20,21 calculations presented in this work were performed using the quantum chemistry software suite, ORCA, version 5.0.2.22 Structural optimisation of N–TM–N bond lengths were calculated through energy minimisation of DFT-SCF calculations for TM = Mn, Ni and Cu of the [Li14TMN2]9+ fragment, Fig. 2; EXAFS deduced bond lengths were used for Fe5 and Co.23 Calculations used a combination of the def2-TZVPP, def2-TZVP and def2-SVP all-electron basis sets24 for the transition metal, nitrogen and lithium atoms, respectively. Scalar relativistic effects are included through the second-order Douglas–Kroll–Hess (DKH2)25,26 method. TD-DFT calculations applying the B3LYP27 functional were performed with spin multiplicity of the Cu metal centre defined as 2S + 1 = 1 and fragment charge of +9, Fig. 2. The molecular fragment (Fig. 2) was selected to maintain the D6h symmetry of α-Li3N. There was no significant deviation in the simulated spectroscopic line shape upon varying the Cu–N bond lengths within a reasonable range. Saturation of the spectroscopic features required 150 roots per multiplet, and an empirical shift of 9.33 eV was applied to match the experimental data. State averaged (SA) CASSCF calculations in conjunction with N-electron-valence perturbation theory (NEVPT2)28–30 were performed with an active space of N electrons in five orbitals (N,5), where N = 6 through to 9 for TM = Mn (5 quintets, 45 triplets and 50 singlets), Fe (10 quartets and 40 doublets), Co (10 triplets and 15 singlets) and Ni (5 doublets). The SA-CASSCF/NEVPT2 results were projected using the ab initio ligand-field theory (AILFT)31,32 method available within ORCA upon the d-orbital basis set giving ligand-field parameters (Ds, Dt), Slater integrals (B and C) and spin–orbit coupling strengths (ζ3dn, ζ2p) for all the metal ions. These parameters were imported into Quanty to calculate the fluorescence-XAS spectra. Further details are found in the ESI.† Complementary periodic DFT computational details and L3-edge calculations are provided within the ESI.† SA-CASSCF/NEVPT2 calculations based on a larger six orbital active space (N,6) were conducted to quantify trends in Li2(Li1−xTMx)N d–s mixing. The active space was constructed through rotation of the unoccupied sσ orbital of the previously converged five orbital CASSCF active space to construct CASSCF(N,6), where N = 6 through to 10 for TM = Mn (1 septet, 35 quintets, 189 triplets and 175 singlets), Fe (6 sextets, 84 quartets and 210 doublets), Co (15 quintets, 105 triplets and 105 singlets), Ni (20 quartets and 70 doublets) and Cu (15 triplets and 21 singlets).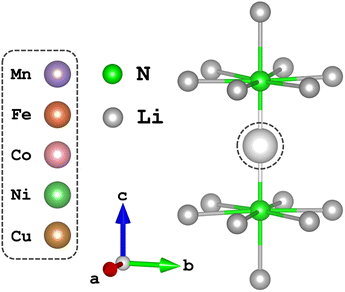 | ||
| Fig. 2 The local dopant environment, as a cation fragment [Li14TMN2]9+, utilised for TD-DFT and SA-CASSCF/NEVPT2 calculations where TM ions replace the Li-ion at the 1b-Wyckoff position. | ||
3.2 Multiplet calculations
Multiplet calculations were undertaken using the many-body scripting language, Quanty33–35 for the simulation of L2,3-edge fluorescence-XAS and XMCD. Slater–Condon–Shortley integrals Fkdd, Fkpd (Coulomb) and Gkpd, Gkds, Gkps (exchange) were obtained from ab initio Hartree–Fock calculations and scaled down to 80% to account for the overestimated electron–electron repulsions observed within these calculations for free ions.36–38 Spin–orbit coupling constants (ζ3d) were taken as their atomic values where experimental data is not available. The 2p5 core-hole spin–orbit coupling constants (ζ2p) are consistent with the atomic values. The strength of ligand-field splitting in the D∞h point group, 3d–4s mixing, and metal-to-ligand charge-transfer were parameterised to match the single crystal XAS and XMCD data using the result of AILFT calculations as a starting point before refinement to improve the fit with respect to the single crystal L2,3-edge XAS and XMCD experimental data. A complete description of the computational details is provided within the ESI.†4 Results and analysis
4.1 L2,3-edge XAS, 3d–4s mixing and covalency
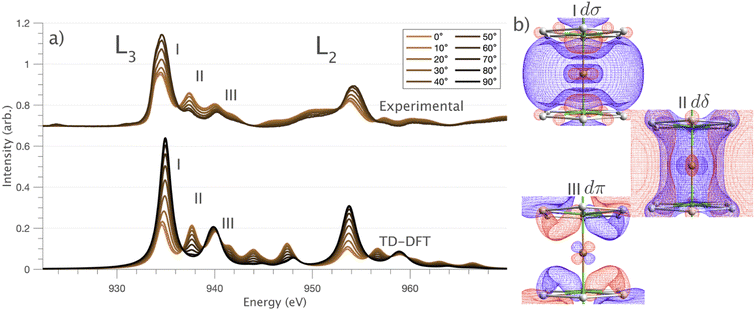
 and 90° with
  . The L2,3-edge involves an electric dipole allowed 2p core-electron excitation. The 2p5 core configuration undergoes spin–orbit coupling causing the division of the edge into the 2p3/2 (L3) and 2p1/2 (L2), which in the case of Cu is split by ∼20 eV. The L2-edge is ∼1.5 times broader than the L3-edge due to additional Coster–Kronig Auger decay channels for this excitation. Generally, transition metal L2,3-edge XAS is dominated by 2p → 3d dipole transitions.41 For Cu(I), with a fully occupied 3d shell, the L2,3-edge XAS exhibits weak 2p → 4s dipole transitions,42 and in the absence of 3d–4s hybridisation, no significant angular dependence in these transitions is expected. The L2,3-edge XAS of Cu, exhibits multiple transitions with strong angular dependence. The L2-edge (944–966 eV) and L3-edge (930–944 eV) are very similar; however, since the L3-edge has better spectral energy resolution, analysis of transitions is focused on this region of the spectra. The Cu L3-edge features are dominated by three (I–III) sets of peaks centred at 934.4, 937.4 and 940.1 eV, respectively. Interestingly, peaks I and II exhibit opposing angular dependence, indicating that they originate from final states with differing symmetries. The angular dependence of peak III is composed of multiple overlapping features following a less pronounced angular dependence than I and II.
DFT calculations are applied to simulate the measured spectra to assist the transition assignment and further investigate the electronic structure. Since Cu is a dopant within an extended solid, it is necessary to identify if the L3-edge XAS final states are localised to the immediate Cu coordination environment or if significant transition intensity relates to the band structure of the Li3N crystal. To address this question, molecular and periodic DFT calculations are applied to simulate the measured spectra (see ESI† for the periodic DFT calculations). Both methods are found to accurately reproduce the L3-edge XAS spectral shape and angular dependence (Fig. 3a and S2a†) inferring that the theoretical [Li14TMN2]9+ molecular fragment suitably captures the essential electronic structure of Li2(Li1−xTMx)N at the dopant sites. Both periodic and molecular DFT calculations aid in the assignment of the Cu spectra providing evidence of the admixture of Cu 3d character into the lowest energy unoccupied states at the dopant. Peak I has maximum intensity with the incident X-ray wave vector,  parallel to the principle c-axis, and can therefore be assigned as relating to states with strong Cu 3dσ mixing. Peak II, with opposing angular dependence to I, is assigned as relating to states with Cu 3dδ mixing. Peak III has similar but less resolved angular dependencies than peak II and originates from Cu 3dπ mixing. Identification of the natural transition orbitals supports this interpretation for peaks I to III from which characteristic Cu 3dz2 (dσ), Cu 3dx2−y2,xy (dδ) and Cu 3dxz,yz (dπ) orbitals can be identified, Fig. 3b. Similarly, the partial density of states extracted from periodic DFT calculations provides further support for the assignment of peaks I to III (Fig. S2b†). An analysis of [Li14CuN2]9+ molecular orbitals are shown in Fig. S3† along with Löwdin population analysis (Table S1†). Unoccupied virtual orbitals with significant Cu character are similar in shape and phase relative to the natural transition orbitals for transitions I, II and III. At lowest energy there is an unoccupied σ molecular orbital composed of Cu 3dz2, Cu 4s, N 2pz and N 2s character. At higher energy there is an δ molecular orbital composed of Cu 3dx2−y2,xy character mixed with Li 2px,y and Li 2s character. At highest energy, there is a π molecular orbital composed of N 2px and 2py character, mixed with Cu 3dxz,yz and Li 2s and 2p character. Analysis of the highest occupied molecular orbitals identify the presence of significant π bonding interactions between Cu 3dxz,yz and N 2px,y, with 27.2% N character mixing into the 3dπ bonding orbitals. Similarly, significant σ bonding interactions are identified, with 15% N 2pz character and 15.2% Cu 4s character mixing into the 3dσ bonding orbital. Cu 3dx2−y2,xy is non-bonding. This indicates that the L2,3-edge XAS accessed virtual δ orbital (natural transition orbital II) does not relate to the bonding character of Cu.
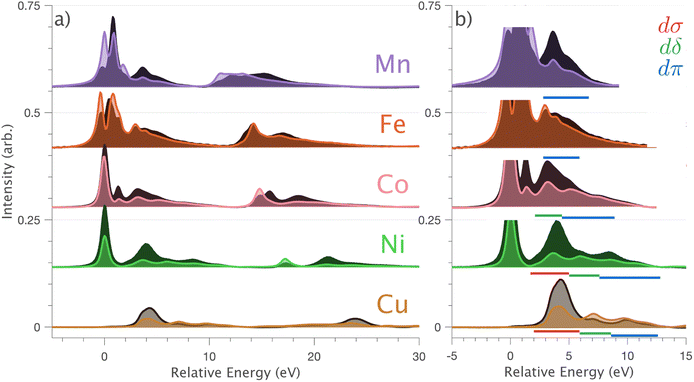
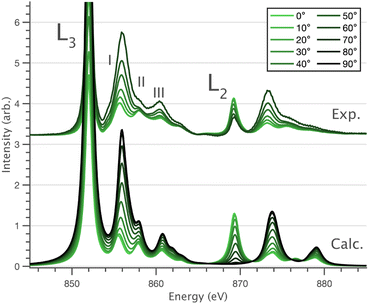
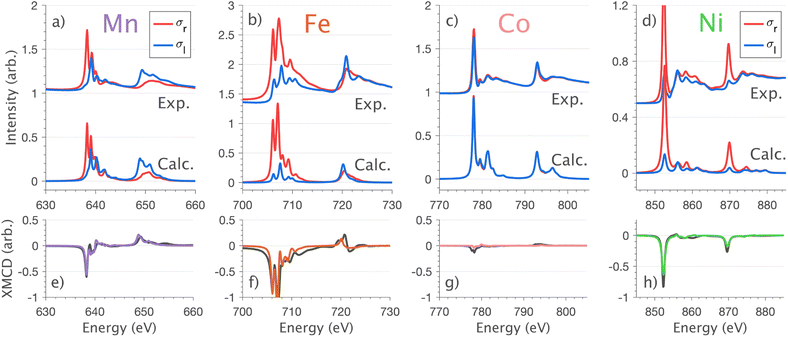
In going from Cu to Ni, large 2p → 3d dipole transitions are observed at the L2 and L3-edges, Fig. 4, consistent with a Ni(I) (3d9) oxidation state. The intense Ni L3-edge (0 eV relative energy) and less intense L2-edge (17.2 eV relative energy) XAS peaks have an opposing angular dependence; the L3-edge shows a maximum intensity with  while the L2-edge shows a maximum with
  . This angular dependence is unique to the excitation relating to a final state with 3dxz,yz character (see Fig. S4† which demonstrates this with Ni(I) multiplet simulations for a series of ligand-field symmetries).
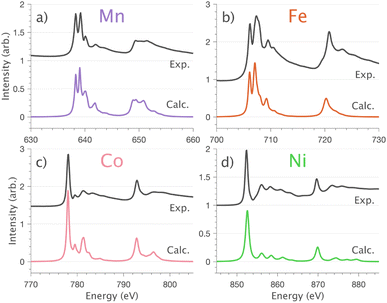
Intense Co L2,3-edge 2p → 3d dipole transitions (0 and 17.2 eV relative energies) exhibit the same angular dependencies as Ni. This assigns the lowest unoccupied molecular orbital 3dxz,yz in character. The main L2- and L3-edge peaks for Co are more intense relative to Ni, which is consistent with an additional 3dxz,yz-hole in going from monovalent Ni (3d9) to monovalent Co (3d8). The Co spectra also exhibit an additional peak (1.5 eV relative energy, Fig. 4) that is assigned as a 2p–3d multiplet effect present in the absorption final state in the following sections. The L2,3-edge XAS of Fe and Mn are more complex and require a multiplet theory interpretation, also presented in the following sections. However, despite the increasing dominance of 2p → 3d dipole transitions in going from Ni to Mn, all the spectra show strong satellite intensities at energies extending above the L2- and L3-edges resembling the Cu spectrum, Fig. 4b.
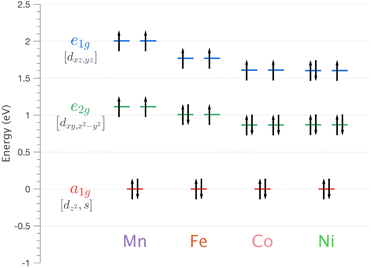 | ||
| Fig. 5 Energy of 3d orbitals for Li2(Li1−xTMx)N (where TM = Mn, Fe, Co and Ni) obtained via SA-CASSCF/NEVPT2 AILFT calculations. | ||
| ψ i | Mn | Fe | Co | Ni | Cu |
|---|---|---|---|---|---|
| |3dn〉 | 86.46 | 84.34 | 82.51 | 76.05 | 75.72 |
| |3dn−14s1〉 | 8.43 | 9.54 | 12.07 | 19.74 | 21.87 |
| |3dn−24s2〉 | 4.97 | 5.19 | 3.62 | 3.53 | 2.04 |
4.2 L2,3-edge XMCD, spin–orbit coupling and magnetism
XMCD measurements are conducted to obtain insight into spin and orbital contributions to magnetism. Normal (H‖c) and grazing (H⊥c) incidence L2,3-edge XMCD measurements in an applied magnetic field of 14 T show a variation in magnetic anisotropy for the transition metal series (Fig. 8 and S8†). The XMCD signal for Mn shows only weak orientation dependence. Large easy-axis anisotropy is observed for Fe and Ni, with a large XMCD signal for H parallel to c and a weak XMCD signal for H at grazing incidence. Easy-plane type magnetic anisotropy is observed for Co, with a small XMCD signal when H is applied parallel to c and a large XMCD signal with H at grazing incidence. These observations are consistent with single-crystal magnetometry measurements.45Analysing the shape of the XMCD spectra provides insight into the origin of the observed magnetic anisotropy, particularly the relative sign and shape of the L2-edge XMCD versus L3-edge XMCD. For Ni the XMCD at both the L2- and L3-edges have the equivalent sign, Fig. 8h. A series of Ni L2,3-edge multiplet simulations show that the XMCD is very sensitive to the angular momentum of the ground state electron configuration, Fig. S4.† From this, it is identified that an XMCD signal with equivalent signs at both L2- and L3-edges is a characteristic fingerprint for a strongly spin–orbit coupled S = 1/2, L = 1 and J = 3/2 (2P3/2) ground term in Ni(I).
It is interesting that despite the Ni and Co L2,3-edge XAS spectra having similar shapes (Section 4.1) the XMCD differ significantly, Fig. 8g and h. Unlike Ni, the L2-edge XMCD of Co is positive, the opposite of the Ni L2-edge XMCD, indicating a partial quenching of orbital angular momentum for Co. The XMCD spectra of Fe and Mn exhibit complex structure due to ligand-field multiplet effects. Implementation of the charge-transfer ligand-field multiplet model developed in Section 4.1.4 is found to accurately reproduce the XMCD spectra of the transition metal series, including angular dependence in XMCD and the extension of the XMCD into the charge-transfer satellite region of the L2,3-edge, Fig. 8 and S8.† The large XMCD signal and easy-axis anisotropy for Fe are consistent with a 4D7/2 ground term as previously assigned by variable temperature L2,3-edge XAS.5
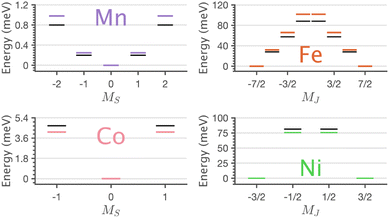
The application of sum-rule analysis through XMCD measurements is frequently utilised to decompose spin and orbital contributions to the total magnetic moment.46,47 However, since single-crystals of Li2(Li1−xTMx)N are electrically insulating, total-electron yield detection is inhibited. Therefore, the experimental results are fluorescence yield detected. Fluorescence yield exhibits state and angular-dependent fluorescence decay channels that deviate significantly from the absorption cross-section; thus limiting the utility of sum rule analysis.48 Instead, the charge-transfer ligand-field multiplet results are analysed to obtain the lowest energy expectation values for mS, mL and mJ for each of the compounds. Table 2 presents the energy and related mS, mL and mJ expectation values for Mn through to Ni. The weak magnetic anisotropy for Mn and easy-plane anisotropy for Co can be understood due to their orbital moment quenched ground states, resulting from a21ge22ge21g and a21ge42ge21g configurations, respectively. A positive axial zero-field splitting of the S = 2 and S = 1 ground-state multiplets for Mn and Co, respectively, are responsible for the easy-plane type magnetisation observed. The more substantial easy-plane anisotropy for Co versus Mn can be explained by the more significant zero-field splitting present (see Zeeman diagrams, Fig. S9†).
| TM | 〈E〉 | 〈mS〉 | 〈mL〉 | 〈mJ〉 |
|---|---|---|---|---|
| Mn | 0.00 | 0.000 | 0.000 | |
| 0.25 | ±1.022 | ±0.002 | ||
| 0.98 | ±2.045 | ±0.002 | ||
| Fe | 0.00 | ±1.505 | ±2.002 | ±3.506 |
| 31.88 | ±0.504 | ±2.001 | ±2.505 | |
| 65.92 | ±0.498 | ∓1.999 | ∓1.501 | |
| 101.67 | ±1.503 | ∓2.000 | ∓0.497 | |
| Co | 0.00 | 0.000 | 0.000 | |
| 4.14 | ±0.910 | ±0.010 | ||
| Ni | 0.00 | ±0.486 | ±0.948 | ±1.471 |
| 75.66 | ±0.501 | ∓0.933 | ±0.432 |
The easy-axis magnetic anisotropy of Fe and Ni derives from an odd electron count in doubly degenerate orbitals. An a21ge32ge21g configuration for Fe and an a21ge42ge11g configuration for Ni. The 4D7/2 ground term for Li2(Li1−xFex)N splits in energy into sub-states mJ = ±7/2, ±5/2, ±3/2, ±1/2 resulting in a large energy barrier to magnetisation reversal, Table 2. Interestingly, the Ni 2P3/2 ground term is calculated to have an extremely large barrier to magnetisation reversal, generated by the splitting of mJ = ±3/2, ±1/2 sub-states, resulting in a predicted energy barrier of Ueff ≈ 75 meV (≈600 cm−1). To our knowledge, this exceeds the energy barrier to magnetisation reversal for any reported transition metal single-ion. Fig. 9 shows the lowest energy eigenstates obtained from charge-transfer multiplet simulations along with ab initio energies extracted from the 5 orbital active space CASSCF via quasi-degenerate perturbation theory (QDPT) with spin–orbit coupling. Good agreement is obtained between the semi-empirical and ab initio results for the transition metal series.
5 Discussion
L2,3-edge XAS 2p → 3d dipole transitions are sensitive to 3d ligand-field splitting, multiplet effects, and the presence of metal–ligand covalency. Metal–ligand covalency gives rise to charge-transfer satellites on the high energy side of the absorption edges that are considered hallmarks for ligand donor and back donor covalency.49 The dipole 2p → 4s contribution to the L2,3-edge XAS is generally neglected since it carries much less intensity and is much broader than the 2p → 3d transitions.42 This study shows that in a linear coordination environment, significant mixing of 3dz2 character into 4s occurs. This gives rise to 3dz2 intensity enhanced 2p → 4s transitions observed as satellites on the high energy side of the L3 and L2-edges. The 3dσ enhanced 4s satellites are most evident in the L2,3-edges of Cu and Ni, which is consistent with ab initio calculations that identify maximum 4s mixing in ground state wave functions for Cu and Ni (∼23% occupied 4s character), with significantly less 4s mixed into the ground states for Co (∼16%), Fe (∼15%) and Mn (∼13%). For Fe and Mn, intense 2p → 3d multiplet features distribute over a large energy range masking direct assignment of 3dz2–4s mixing-induced satellites. However, in principle, this intensity overlap issue could be ameliorated by resonant inelastic X-ray scattering (RIXS). Indeed given the broad interest in d–s mixing, it will be interesting to identify if RIXS can be applied to quantify d–s mixing in other scenarios, including transition metals,50 f-block single-ion magnets,14,15 qubits and actinides12,16 predicted to exhibit fnd/s1 ground-state electron configurations.Using single-crystal angular dependent measurements assists in assigning charge-transfer satellites of diffing symmetry. Metal–ligand charge-transfer satellites of 3dδ and 3dπ symmetry are also identified in addition to 3dσ satellites. Satellites of 3dπ symmetry are resolved for the whole Li2(Li1−xTMx)N series. Charge-transfer multiplet theory (for Mn to Ni) and DFT analysis (for Cu) show that 3dπ symmetry satellites result from covalent interactions between 3dxz,yz and N 2px,y orbitals. Satellites of 3dδ symmetry are found via analysis of Cu DFT to involve virtual orbitals with mixed characters of 3dxy,x2−y2 and Li 2s/Li 2px,y. However, the 3dδ symmetry satellites do not relate to metal–ligand covalency; according to Cu DFT results, the lower energy occupied Cu 3dxy,x2−y2 orbitals are non-bonding.
Ab initio ligand-field multiplet simulations of the L2,3-edge XAS confirm the accuracy of CASSCF calculations for predicting the ligand-field splitting. These calculations show that the total ligand-field energy splitting is ∼1.6 eV for Ni and increases along the series to ∼2.0 eV for Mn. These are exceptionally large ligand-field energy splitting for two-coordinate compounds. For instance, [Fe(C(SiMe3)3)2]− and [Fe(N(SiMePh2)2)2]− have total ligand-field energy splittings of only ∼0.62 eV (ref. 1) and ∼0.68 eV (ref. 51) respectively. Furthermore, a [M(N(SiMe3)2)2]− series where M = Cr, Mn, Fe and Co show the same trend of increasing ligand-field energy splitting in going from Co to Cr; however, the total ligand-field energy splitting does not exceed 1.0 eV for any of the compounds.52 The local coordination of Li2(Li1−xTMx)N differs from these molecular complexes in that the metal–ligand bond lengths are shorter; for instance, the metal–nitrogen bond length for Fe is 1.873(7) Å (ref. 5) and Co is 1.80(1) Å,23 significantly shorter than 1.9213(6) Å for [Fe(N(SiMe3)2)2]− and 1.8979(11) Å for [Co(N(SiMe3)2)2]−. The high point group symmetry and shorter metal–ligand bond lengths for Li2(Li1−xTMx)N, are consistent with strong dπ bonding interactions and 3dz2–4s mixing that drives the exceptionally large ligand-field splitting observed.
XMCD analysis provides a definitive explanation for the magnetism by deconvoluting spin and orbital contributions to magnetisation for the series (Table 2). Mn has an orbital angular momentum quenched S = 2 ground state, and Co has an orbital angular momentum quenched S = 1 ground state, with positive axial zero-field splitting responsible for observed easy-plane magnetisation. The latter agrees with previous EPR measurements.53 The XMCD results show the presence of first-order spin–orbit coupling for both Fe (4D7/2) and Ni (2P3/2). The identification of first-order spin–orbit coupling for Ni differs significantly relative to the linear Ni(I) molecule, [Ni(N(SiMe3)Dipp)2]−, which is reported to have a quenched orbital angular momentum (S = 1/2, L = 0), due to the reduced influence of 3dz2–4s mixing and a e42ge41ga11g ground state configuration.54 Strong spin–orbit coupling for Fe and Ni mean that at low doping concentrations, the dopants are single-ion magnets5 with significant energy barriers to magnetisation reversal (Ueff). The Ueff values are not measured directly by XAS or XMCD. However, the ab initio calculations and multiplet simulations that reproduce the essential features of the measured XAS and XMCD spectra predict Ueff ≈ 28 meV (≈226 cm−1) and Ueff ≈ 75 meV (≈600 cm−1) for Fe and Ni respectively. Interestingly, Fe exhibits a sizeable magnetic hysteresis and the slowest magnetic relaxation of any transition metal SIM, τ ∼ 107 s at low temperatures,8 whereas Ni shows no magnetic hysteresis down to 2 K.45 This implies that Ni exhibits significant quantum tunnelling of magnetisation within the ground state mJ = ±3/2 doublet while for Fe tunnelling within the mJ = ±7/2 ground doublet is forbidden. The XAS and XMCD measurements demonstrate that all dopants exhibit a D6h coordination environment. Therefore, the difference in magnetic relaxation behaviour does not originate from reduced local symmetry. However, from a metal–ligand covalency and spin–orbit coupling perspective Fe and Ni differ. For Fe the ground state electron configuration has odd electron occupation in the non-bonding e2g orbitals, while for Ni, the ground state electron configuration has odd electron occupation in the e1g orbitals which are identified by L2,3-edge XAS to be engaged in significant 3dπ bonding interactions. In the case of Fe, it is proposed that the short Fe–N bond and related strong 3dπ bonding contribute to suppressing vibronic effects, resulting in increased magnetic relaxation times with respect to other linear SIMs. In the case of Ni, it is proposed that the e1g 3dπ bonding interactions could enhance sensitivity to small vibronic distortions resulting in the mixture of lower symmetry character into the ground state that enhances relaxation via quantum tunnelling of magnetisation. Further, detailed magnetic relaxation measurements on Ni are required to investigate its magnetic relaxation dynamics in greater detail.
6 Conclusion
A series of transition metal dopants (Mn, Fe, Co, Ni and Cu) in lithium nitride are studied by angular dependent single-crystal L2,3-edge XAS and XMCD measurements combined with ligand-field multiplet and ab initio calculations. The dopant sites are all found to be monovalent, occupying a D6h symmetry site with linear coordination. L2,3-edge XAS is developed to be a probe 3dz2–4s mixing via the quantification of ligand-field splitting and the presence of 3dz2 intensity enhanced 2p → 4s satellite transitions at the high energy side of both L3- and L2-edges. Analysis of XAS with support from ab inito calculations determines the presence of significant 3dz2–4s mixing across the transition metal series with maximal mixing for Cu and Ni that then decreases along the series to Mn. L2,3-edge XAS and DFT analysis identify strong 3dπ metal–ligand covalency across the series, whereas 3dδ orbitals are non-bonding. The presence of significant 3dπ metal–ligand covalency with substantial 3dz2–4s mixing is determined to be responsible for the exceptionally large ligand-field splitting quantified by XAS and ab inito calculations. L2,3-edge XMCD is applied to decompose spin and orbital contributions to easy-plane (Mn and Co) versus easy-axis (Fe and Ni) magnetic behaviour. The analysis confirms the origin of single-ion magnetism and slow magnetic relaxation in Fe and for Ni. First-order spin–orbit coupling resulting in such large barriers to magnetisation reversal in solid-state crystals is of relevance for the advancement of high-performance magnets free from rare-earth metals.Data availability
Data for this paper, including experimental data and example calculation input files are available on Figshare at https://doi.org/10.48420/24231301.Author contributions
MLB conceptualised and supervised the project. XAS and XMCD measurements were conducted by MLB, TGB, PB and SKC. MSH performed data analysis and conducted calculations under the supervision of MLB. MA conducted periodic DFT calculations. MF and FAB synthesised the crystals under the supervision of AJ. MSH and MLB wrote the manuscript with review and editing from all the authors.Conflicts of interest
There are no conflicts to declare.Acknowledgements
We acknowledge Diamond Light Source for experimental time for the following experiments; SI21117-1 and MM23982-1 at I10-BLADE. This work was supported by computing resources provided by STFC Scientific Computing Department's SCARF cluster. MSH and MLB acknowledge a travel grant from CONEXS (EPSRC, EP/S022058/1). MLB acknowledges the support of the Royal Society of Chemistry (RM1802-4019 and E22-8595674725). We thank Abby Ragazzon-Smith for performing ICP-OES. This work was supported by the Deutsche Forschungsgemeinschaft (DFG, German Research Foundation) – Grant No. JE748/1.Notes and references
- J. M. Zadrozny, D. J. Xiao, M. Atanasov, G. J. Long, F. Grandjean, F. Neese and J. R. Long, Nat. Chem., 2013, 5, 577–581 CrossRef CAS PubMed.
- P. C. Bunting, M. Atanasov, E. Damgaard-Møller, M. Perfetti, I. Crassee, M. Orlita, J. Overgaard, J. Van Slageren, F. Neese and J. R. Long, Science, 2018, 362, 7319 CrossRef PubMed.
- K. Kundu, J. R. White, S. A. Moehring, J. M. Yu, J. W. Ziller, F. Furche, W. J. Evans and S. Hill, Nat. Chem., 2022, 14, 392–397 CrossRef CAS PubMed.
- C. G. Werncke and A. G. Gómez, Encyclopedia of Inorganic and Bioinorganic Chemistry, 2022, pp. 1–30 Search PubMed.
- M. S. Huzan, M. Fix, M. Aramini, P. Bencok, J. F. W. Mosselmans, S. Hayama, F. A. Breitner, L. B. Gee, C. J. Titus, M. A. Arrio, A. Jesche and M. L. Baker, Chem. Sci., 2020, 11, 11801–11810 RSC.
- S. A. Bräuninger, A. Jesche, S. Kamusella, F. Seewald, M. Fix, R. Sarkar, A. A. Zvyagin and H. H. Klauss, Phys. Rev. B, 2020, 102, 1–18 CrossRef.
- A. Jesche, R. W. McCallum, S. Thimmaiah, J. L. Jacobs, V. Taufour, A. Kreyssig, R. S. Houk, S. L. Bud’Ko and P. C. Canfield, Nat. Commun., 2014, 5, 3333 CrossRef CAS PubMed.
- M. Fix, J. H. Atkinson, P. C. Canfield, E. Del Barco and A. Jesche, Phys. Rev. Lett., 2018, 120, 147202 CrossRef CAS PubMed.
- S. G. Wang and W. H. Schwarz, J. Chem. Phys., 1998, 109, 7252–7262 CrossRef CAS.
- M. Vogel, W. Weber and W. Wenzel, J. Chem. Phys., 2006, 125, 7252 Search PubMed.
- R. J. Deeth, Eur. J. Inorg. Chem., 2022, 2022, 1–14 CrossRef.
- F. S. Guo, N. Tsoureas, G. Z. Huang, M. L. Tong, A. Mansikkamäki and R. A. Layfield, Angew. Chem., Int. Ed., 2020, 59, 2299–2303 CrossRef CAS PubMed.
- L. Barluzzi, S. R. Giblin, A. Mansikkamäki and R. A. Layfield, J. Am. Chem. Soc., 2022, 144, 18229–18233 CrossRef CAS PubMed.
- K. R. McClain, C. A. Gould, D. A. Marchiori, H. Kwon, T. T. Nguyen, K. E. Rosenkoetter, D. Kuzmina, F. Tuna, R. D. Britt, J. R. Long and B. G. Harvey, J. Am. Chem. Soc., 2022, 144, 22193–22201 CrossRef CAS PubMed.
- C. A. Gould, K. R. McClain, D. Reta, J. G. Kragskow, D. A. Marchiori, E. Lachman, E. S. Choi, J. G. Analytis, R. D. Britt, N. F. Chilton, B. G. Harvey and J. R. Long, Science, 2022, 375, 198–202 CrossRef CAS PubMed.
- S. G. Minasian, J. M. Keith, E. R. Batista, K. S. Boland, D. L. Clark, S. A. Kozimor, R. L. Martin, D. K. Shuh and T. Tyliszczak, Chem. Sci., 2014, 5, 351–359 RSC.
- S. A. Moehring, M. Miehlich, C. J. Hoerger, K. Meyer, J. W. Ziller and W. J. Evans, Inorg. Chem., 2020, 59, 3207–3214 CrossRef CAS PubMed.
- M. K. Thomsen, A. Nyvang, J. P. Walsh, P. C. Bunting, J. R. Long, F. Neese, M. Atanasov, A. Genoni and J. Overgaard, Inorg. Chem., 2019, 58, 3211–3218 CrossRef CAS PubMed.
- A. Jesche and P. C. Canfield, Philos. Mag., 2014, 94, 2372–2402 CrossRef CAS.
- B. O. Roos, P. R. Taylor and P. E. Sigbahn, Chem. Phys., 1980, 48, 157–173 CrossRef CAS.
- P. Å. Malmqvist and B. O. Roos, Chem. Phys. Lett., 1989, 155, 189–194 CrossRef CAS.
- F. Neese, F. Wennmohs, U. Becker and C. Riplinger, J. Chem. Phys., 2020, 152, 224108 CrossRef CAS PubMed.
- D. Muller-Bouvet, J. P. Pereira-Ramos, S. Bach, P. Willmann and A. Michalowicz, Inorg. Chem., 2014, 53, 6127–6131 CrossRef CAS PubMed.
- F. Weigend and R. Ahlrichs, Phys. Chem. Chem. Phys., 2005, 7, 3297–3305 RSC.
- M. Douglas and N. M. Kroll, Ann. Phys., 1974, 82, 89–155 CAS.
- G. Jansen and B. A. Hess, Phys. Rev. A, 1989, 39, 6016–6017 CrossRef PubMed.
- A. D. Becke, J. Chem. Phys., 1993, 98, 5648–5652 CrossRef CAS.
- C. Angeli, R. Cimiraglia and J. P. Malrieu, Chem. Phys. Lett., 2001, 350, 297–305 CrossRef CAS.
- C. Angeli, R. Cimiraglia, S. Evangelisti, T. Leininger and J. P. Malrieu, J. Chem. Phys., 2001, 114, 10252 CrossRef CAS.
- C. Angeli, R. Cimiraglia and J. P. Malrieu, J. Chem. Phys., 2002, 117, 9138–9153 CrossRef CAS.
- M. Atanasov, D. Ganyushin, K. Sivalingam and F. Neese, Struct. Bonding, 2012, 143, 149–220 CrossRef CAS.
- S. K. Singh, J. Eng, M. Atanasov and F. Neese, Coord. Chem. Rev., 2017, 344, 2–25 CrossRef CAS.
- M. W. Haverkort, M. Zwierzycki and O. K. Andersen, Phys. Rev. B: Condens. Matter Mater. Phys., 2012, 85, 165113 CrossRef.
- M. Retegan, Crispy: v0.7.3, 2019 Search PubMed.
- M. W. Haverkort, Y. Lu, R. Green, S. Macke, M. Retegan, M. Brass and S. Heinze, Quanty v0.7b, 2022, quanty.org Search PubMed.
- E. C. Wasinger, F. M. De Groot, B. Hedman, K. O. Hodgson and E. I. Solomon, J. Am. Chem. Soc., 2003, 125, 12894–12906 CrossRef CAS PubMed.
- F. de Groot and A. Kotani, Core level spectroscopy of solids, CRC Press, 2008, pp. 1–491 Search PubMed.
- M. U. Delgado-Jaime, K. Zhang, J. Vura-Weis and F. M. De Groot, J. Synchrotron Radiat., 2016, 23, 1264–1271 CrossRef CAS PubMed.
- W. Schnelle, R. Niewa and F. R. Wagner, J. Magn. Magn. Mater., 2004, 272–276, 828–829 CrossRef CAS.
- P. Novák and F. R. Wagner, J. Magn. Magn. Mater., 2004, 272–276, 269–270 CrossRef.
- F. M. De Groot, J. C. Fuggle, B. T. Thole and G. A. Sawatzky, Phys. Rev. B: Condens. Matter Mater. Phys., 1990, 42, 5459–5468 CrossRef CAS.
- S. J. George, S. P. Cramer, M. D. Lowery and E. I. Solomon, J. Am. Chem. Soc., 1993, 115, 2968–2969 CrossRef CAS.
- R. Weller, M. Atanasov, S. Demeshko, T. Y. Chen, I. Mohelsky, E. Bill, M. Orlita, F. Meyer, F. Neese and C. G. Werncke, Inorg. Chem., 2023, 62, 3153–3161 CrossRef CAS PubMed.
- R. Sarangi, N. Aboelella, K. Fujisawa, W. B. Tolman, B. Hedman, K. O. Hodgson and E. I. Solomon, J. Am. Chem. Soc., 2006, 128, 8286–8296 CrossRef CAS.
- A. Jesche, L. Ke, J. L. Jacobs, B. Harmon, R. S. Houk and P. C. Canfield, Phys. Rev. B: Condens. Matter Mater. Phys., 2015, 91, 180403 CrossRef.
- C. Piamonteze, P. Miedema and F. M. De Groot, Phys. Rev. B: Condens. Matter Mater. Phys., 2009, 80, 1–12 CrossRef.
- H. Wang, S. Friedrich, L. Li, Z. Mao, P. Ge, M. Balasubramanian and D. S. Patil, Phys. Chem. Chem. Phys., 2018, 20, 8166–8176 RSC.
- B. Liu, C. Piamonteze, M. U. Delgado-Jaime, R. P. Wang, J. Heidler, J. Dreiser, R. Chopdekar, F. Nolting and F. M. De Groot, Phys. Rev. B, 2017, 96, 1–8 Search PubMed.
- R. K. Hocking, E. C. Wasinger, F. M. De Groot, K. O. Hodgson, B. Hedman and E. I. Solomon, J. Am. Chem. Soc., 2006, 128, 10442–10451 CrossRef CAS PubMed.
- J. M. Zadrozny, A. T. Gallagher, T. D. Harris and D. E. Freedman, J. Am. Chem. Soc., 2017, 139, 7089–7094 CrossRef CAS PubMed.
- D. Errulat, K. L. M. Harriman, D. A. Gálico, J. S. Ovens, A. Mansikkamäki and M. Murugesu, Inorg. Chem. Front., 2021, 8, 5076–5085 RSC.
- C. G. Werncke, E. Suturina, P. C. Bunting, L. Vendier, J. R. Long, M. Atanasov, F. Neese, S. Sabo-Etienne and S. Bontemps, Chem.–Eur. J., 2016, 22, 1668–1674 CrossRef CAS PubMed.
- C. Albert, T. J. Ballé, F. A. Breitner, Y. Krupskaya, A. Alfonsov, Z. Zangeneh, S. Avdoshenko, M. S. Eldeeb, L. Hozoi, A. Vilangottunjalil, E. Haubold, A. Charnukha, B. Büchner, A. Jesche and V. Kataev, Inorg. Chem., 2021, 60, 4497–4507 CrossRef CAS PubMed.
- C. Y. Lin, J. C. Fettinger, F. Grandjean, G. J. Long and P. P. Power, Inorg. Chem., 2014, 53, 9400–9406 CrossRef CAS PubMed.
Footnote |
| † Electronic supplementary information (ESI) available. See DOI: https://doi.org/10.1039/d3sc06308a |
| This journal is © The Royal Society of Chemistry 2024 |

