 Open Access Article
A conductive and sodiophilic Ag coating layer regulating Na deposition behaviors for highly reversible sodium metal batteries†
Xiaomin
Chen‡
a,
Xunzhu
Zhou‡
ab,
Zhuo
Yang
a,
Zhiqiang
Hao
 ab,
Jian
Chen
 a,
Wenxi
Kuang
a,
Xiaoyan
Shi
a,
Xingqiao
Wu
a,
Wenxi
Kuang
a,
Xiaoyan
Shi
a,
Xingqiao
Wu
 ab,
Lin
Li
 *ab and
Shu-Lei
Chou
 *ab
*ab
aInstitute for Carbon Neutralization, College of Chemistry and Materials Engineering, Wenzhou University, Wenzhou, Zhejiang 325035, China. E-mail: linli@wzu.edu.cn; chou@wzu.edu.cn
bWenzhou Key Laboratory of Sodium-Ion Batteries, Wenzhou University Technology Innovation Institute for Carbon Neutralization, Wenzhou, Zhejiang 325035, China
First published on 27th January 2024
Abstract
Sodium metal batteries have attracted increasing interest recently, but suffer from severe dendrite growth caused by uneven Na plating/stripping behavior, which may result in the piercing of the membrane, with short circuiting and even cause explosions. Herein, a conductive and sodiophilic Ag coating layer is introduced to regulate Na deposition behaviors for highly reversible sodium metal batteries. Ag coated Zn foil with enhanced sodiophilicity, rapid Na+ transfer kinetics and superior electronic conductivity guarantee the homogenized Na+ ion and electric field distribution. This enables remarkably low overpotentials and uniform Na plating/stripping behavior with ultrahigh Coulombic efficiency of 99.9% during 500 cycles. As expected, the enhanced electrochemical performance of the anode-less battery and anode-free battery coupled with Prussian blue is achieved with the help of Ag coating. This work emphasizes the role of the conductive and sodiophilic coating layer in regulating the Na deposition behaviors for highly reversible sodium metal batteries.
Introduction
The urgent demand for durable rechargeable batteries in industries such as electric transportation, smart grids, and electric vehicles is now widely recognized. Among discovered battery technologies, sodium metal batteries (SMBs) have attracted extensive attention, benefiting from the advantages of affordability, relatively low redox potential (−2.71 V) and high theoretical capacity (1165 mA h g−1) of metallic Na.1–3 However, non-uniform Na deposition behavior induces severe dendrite growth, which may result in the piercing of the membrane, with short circuiting and even cause explosions.4–7 Meanwhile, Na dendrites inevitably increase the area exposed to organic electrolyte, which gives rise to the accumulation of side products and further consumption of active Na, leading to poor stability and reversibility during long-term cycling.8–11 Hence, it is very important to regulate the Na deposition behavior for highly reversible SMBs.In general, the electrochemical deposition behavior is mainly controlled by the diffusion process, which is primarily affected by the Na+ ion distribution and electric field distribution on the current collector.12–17 To date, various effective strategies have been applied to homogenize the Na+ ion distribution, such as the use of an artificial solid electrolyte interface (SEI, organic coating or insulated inorganic porous coating),18,19 high-concentration electrolyte,20–22 positive cation with lower reduction potential (electrostatic shield mechanism)23,24 or sodiophilic coating.25–30 Conversely, some reports demonstrate that the surface electric field distribution can be manipulated by a three-dimensional hierarchical structure31–34 or conductive coating layer.9,29,35–37 Recently, Cheng's group pointed out that the nucleation overpotential on Zn foil is smaller than that on the commonly used Cu/Al foil, exhibiting a huge potential for practical application.38 Therefore, further modification of the Zn collector by the manipulation of the ion/electric distribution to synergistically promote even deposition is worthwhile.
Herein, a conductive and sodiophilic Ag coating sputtered on commercial Zn foil, denoted as Zn@Ag, is employed as the modified substrate for highly reversible sodium metal batteries. Ag coating with enhanced sodiophilicity and rapid Na+ transfer kinetics enables uniform Na+ ion and electric field distribution, guaranteeing highly stable Na deposition. In 1.0 M NaPF6-diglyme electrolyte, a Zn@Ag‖Na asymmetric cell exhibits an ultrastable and ultrahigh Coulombic efficiency (CE) of 99.9% during 500 cycles. With pre-deposited Na on the Zn@Ag collector (denoted as Zn@Ag–Na), the Zn@Ag–Na‖Na cell displays exceptional stability of plating/stripping performance for 1000 hours. Notably, the anode-less Zn@Ag–Na‖Prussian blue (PB) cell retains 89.1% of its capacity after 150 cycles at 50 mA h g−1, much more than that of 53.2% in a Zn foil system. In addition, Ag coating works well for an anode-free Zn@Ag‖PB cell with higher capacity retention and more stable stripping/plating behavior. This work highlights the conductive and sodiophilic surface for uniform Na deposition, reinforcing the durability and safety of sodium metal batteries.
Results and discussion
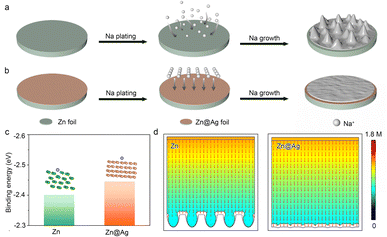
The Na deposition process consists of initial nucleation, two-dimensional Na+ diffusion, and three-dimensional growth.39,40 The Na dendrite formation is mainly attributed to uneven nucleation during the initial stage.41,42 Na+ randomly adsorbs on the electrode surface and aggregates to form the initial crystal nucleus, where as-formed protuberances inevitably accelerate the uneven Na+ ion distribution and aggravate the electric gradient, further promoting the lengthwise growth as Na dendrites (Fig. 1a).43 Notably, the introduction of a conductive and sodiophilic coating layer greatly decreases the nucleation barrier. It also plays a critical role in homogenizing the Na+ flux and electric field distribution, inducing uniform Na nucleation and growth (Fig. 1b). Metal Ag possesses the advantages of high electronic conductivity (6.3 × 10⁷ S m−1, compared with 1.7 × 10⁷ S m−1 of metallic Zn) and superior sodiophilicity, exhibiting huge potential as a coating layer to regulate the Na deposition behavior. Herein, Ag coating is thermally evaporated on commercial Zn foil as the modified substrate (denoted as Zn@Ag) to manipulate the uniform Na deposition. Energy dispersive spectrometry (EDS) mapping displays the uniform distribution of Ag on the Zn surface (Fig. S1, ESI†).The binding energies between Na atoms and different substrates are calculated by density functional theory (DFT) to investigate the Na affinity for Zn and the Zn@Ag substrate (Fig. 1c). The binding energy between the Na atom and Ag (100) lattice plane is −2.44 eV, lower than that of −2.40 eV between the Na atom and Zn (101), demonstrating the enhanced sodiophilicity with low nucleation barrier on the Zn@Ag substrate. In addition, finite element analysis is employed to simulate the Na+ flux concentration distribution on Zn and the Zn@Ag substrate in Fig. 1d. Na+ ions are inclined to aggregate and deposit as protuberances on the Zn surface, inducing the inhomogeneous Na+ flux distribution with tip-growing behavior. Meanwhile, the conductive and sodiophilic Ag coating induces the uniform distribution of the Na+ flux, which alleviates the tip effect and regulates the dendrite-free deposition.
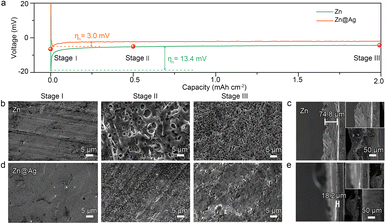
Based on the classical nucleation theory, the initial nucleus size is inversely proportional to the nucleation overpotential (ηn, defined as the voltage gap between the tip overpotential ηt and the plateau overpotential ηp, Fig. S2a, ESI†), and the number density of nuclei is proportional to the cube of ηn, demonstrating the important role of ηn in manipulating the nucleation and growth behavior.17,44,45 The galvanostatic discharge voltage profiles in Fig. 2a reveal that the Zn@Ag substrate exhibits the lowest ηn of 3.0 mV, compared with 13.4 mV for the Zn substrate, 16.0 mV for the Cu substrate and 24.7 mV for the Al substrate (Fig. S2b, ESI†). The ηn is the driving force for creating a new phase, and a smaller ηn on the Zn@Ag substrate indicates its lower nucleation barrier. This is consistent with the theoretical calculation that Zn@Ag exhibits a higher affinity for Na than Zn. Besides, the Ag coating can effectively improve the wettability with a lower contact angle of 6.6° towards organic electrolyte in Fig. S3 (ESI†), much lower than that of 23.8° for pure Zn foil, which is favorable for enhanced interfacial properties.
Subsequently, the Na deposition behavior was investigated by scanning electron microscopy (SEM). As shown in Fig. 2b, the original Zn and Zn@Ag foil exhibit no obvious defects or cracks. Significantly different morphologies of deposited Na are observed during the further plating process. A lichenoid and porous surface is formed on the bare Zn foil, and more pores appear as the deposition capacity is increased, increasing the exposed area between active Na and the organic electrolyte with detrimental side reactions. As the cross-sectional SEM images in Fig. 2c and S4 (ESI†) show, hill-shaped deposited Na with a thickness of 74.8 μm is observed on the Zn surface, which is much larger than the theoretical value of 17.7 μm for 2.0 mA h cm−2 Na, demonstrating the uneven Na deposition on the Zn foil. Benefiting from the greatly decreased nucleation overpotential, uniform, dense and dendrite-free Na deposition is displayed for the Zn@Ag electrode (Fig. 2d). As expected, much more compact deposited Na with a thickness of 18.2 μm is realized for the Zn@Ag substrate (Fig. 2e). That is, a smaller nucleation barrier as a result of the Zn@Ag substrate favors the uniform and dendrite-free Na deposition.
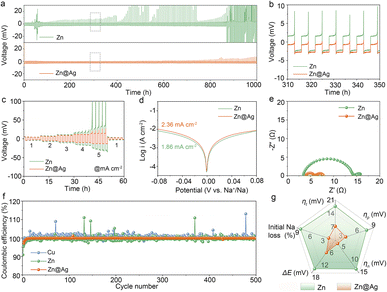
Based on the positive effect of Ag coating on regulating deposition behavior, the stability and reversibility of the Zn@Ag substrate are further tested by assembling coin cells. Since there is no Na source for Zn foil or Zn@Ag foil, Na is pre-deposited on Zn or the Zn@Ag substrate as anode-less electrodes, which are denoted as Zn–Na and Zn@Ag–Na anodes. In Fig. 3a, Zn–Na‖Na and Zn@Ag–Na‖Na cells are assembled for long-term cycling. The much higher overpotential and larger voltage fluctuation with irregular rising and falling are ubiquitous in the pure Zn system, while this is well suppressed in the Zn@Ag–Na‖Na cell with stable cycling over 1000 hours. In the enlarged curve shown in Fig. 3b, a much higher overpotential is observed during the stripping process for the pure Zn foil. In particular, a sharp increase in the late period of Na stripping is observed. This corresponds to the poor deposition behavior. Meanwhile, stable plating/stripping behavior is realized with a smaller overpotential in the Zn@Ag system, which is consistent with the uniform morphology from SEM images. In addition, the rate performance in Fig. 3c demonstrates the superiority of the Zn@Ag–Na electrode on voltage polarization, where stable cycling with a lower overpotential is realized even at 5.0 mA cm−2 for 5.0 mA h cm−2, compared with substantial voltage fluctuations in the Zn–Na‖Na cell. The greatly decreased overpotential in the Zn@Ag system is mainly attributed to the enhanced affinity and conductivity of the Ag coating layer. To further confirm the excellent stability and reversibility of Na on the Zn@Ag substrate, the long-term cycling of a symmetric Zn@Ag–Na cell is tested without Na foil. The pre-deposited capacity of Na is set at 2.0 mA h cm−2, and 75% depth of discharge is employed during the long-term cycling. As shown in Fig. S5 (ESI†), a stable charge–discharge curve with a small overpotential of ca. 2.0 mV is realized in the symmetric Zn@Ag–Na‖Zn@Ag–Na cell. Meanwhile, drastic fluctuations are observed in the Zn–Na‖Zn–Na cell with rather large overpotentials. The interfacial properties are also examined using Tafel plots and electrochemical impedance spectroscopy (EIS) analysis through assembling Zn–Na‖Na and Zn@Ag–Na‖Na cells. The Ag coating increases the exchange current density from 1.86 to 2.36 mA cm−2, indicating that the conductive Ag layer boosts the ion transfer kinetics (Fig. 3d). As illustrated in Fig. 3e and S6 (ESI†), the Zn@Ag system exhibits remarkably low interfacial resistances of 1.9/1.8 Ω at 0/5 cycles, rather lower than those of 10.8 Ω and 4.9 Ω in the pure Zn system, indicating the rapid Na+ transfer kinetics during the plating/stripping process.
The reversibility of the Na source is further explored by assembling Zn‖Na, Zn@Ag‖Na, Cu‖Na, and Al‖Na cells with current densities of 0.5 mA cm−2 for 0.5 mA h cm−2, as shown in Fig. 3f and S7, S8 (ESI†). The initial CE of the Zn@Ag substrate is 97.5%, which is higher than those of bare Zn (90.9%), Cu (96.5%) and Al (82.3%) counterparts. Besides, the Zn@Ag electrode presents an ultrastable and ultrahigh average CE of 99.9% for 500 cycles with a steady voltage profile. In contrast, relatively scattered CE values are presented in pure Zn, Cu and Al systems, exhibiting unstable cycle stability with fluctuating voltage profiles. The ultrahigh and ultra-stable Na reversibility is also achieved with an average CE of 99.9% at 0.5 mA cm−2 for 1.0 mA h cm−2 (Fig. S9, ESI†) and 1.0 mA cm−2 for 1.0 mA h cm−2 (Fig. S10, ESI†). As summarized in the radar map (Fig. 3g and Table S1, ESI†), smaller values of voltage polarization (ΔE), ηt, ηp, and ηn, as well as a lower initial Na loss are realized, demonstrating the enhanced stability and reversibility of deposited Na with the introduction of the Ag coating. The utilization of Zn@Ag results in a low nucleation barrier with homogeneous deposition, enabling highly reversible Na plating/stripping behavior.
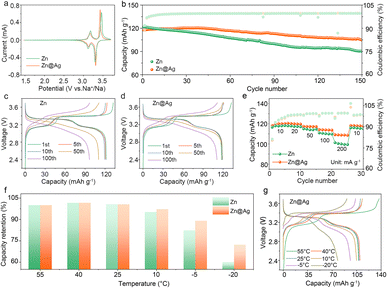
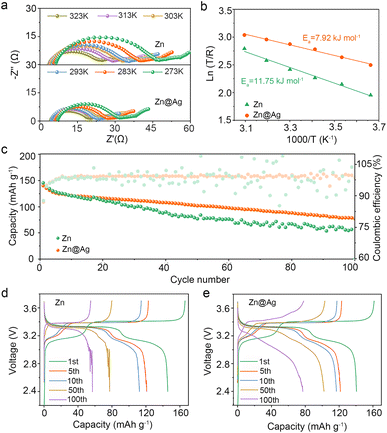
To explore the feasibility of Zn@Ag substrate in practical battery systems, PB is selected as a cathode to assemble the full cell. From the cyclic voltammetry (CV) results depicted in Fig. 4a, two redox couples at 3.43/3.31 V and 3.17/3.12 V correspond to low-spin Fe (C) and high-spin Fe (N) couples in Zn@Ag–Na‖PB cells, while the two peaks are located at 3.46/3.29 V and 3.18/3.12 V in Zn–Na‖PB cells.46 A much lower potential gap between the oxidation peak and reduction peak (115 vs.168 mV for low-spin Fe (C) couples; 38 vs. 63 mV for high-spin Fe (N) couples) and higher peak current are observed in the Zn@Ag system, demonstrating its fast Na+ diffusion kinetics.
The cycling performance of the anode-less cell coupled with the PB cathode is analyzed within the voltage range of 2.4–3.7 V, and 1.0 mA h cm−2 Na was pre-deposited on the Zn substrate and Zn@Ag substrate as the anode-less electrode. As illustrated in Fig. 4b–d and S11 (ESI†), Zn@Ag–Na‖PB cells display a specific capacity of 104.9 mA h g−1 with a capacity retention of 89.1% after 150 cycles, much higher than 90.2 mA h g−1 and 74.2% for Zn–Na‖PB cells, at a current density of 50 mA g−1. Compared with the Na‖PB half cell with excess Na, they deliver a capacity of 123.4 mA h g−1 and capacity retention of 73.4% after 150 cycles (Fig. S12, ESI†), demonstrating the superiority of the Zn@Ag substrate for highly reversible and stable Na plating/stripping behavior. In addition, anode-less Zn@Ag–Na‖PB cells exhibit excellent capacity retention of 97.0% after 100 cycles at 100 mA g−1 (Fig. S13, ESI†), delivering ultrastable and ultrahigh CE values of 99.5%.
The rate performance of anode-less Zn@Ag–Na‖PB cells is also shown in Fig. 4e. At lower current densities of 10 and 20 mA g−1, the two electrodes exhibit comparable discharge capacities. Meanwhile, obvious disparities in capacity and polarization are observed as the current density is increased above 50 mA g−1. In particular, at a high current of 200 mA g−1, the Zn@Ag system delivers a capacity of 109.1 mA h g−1, much higher than 101.3 mA h g−1 in a pure Zn system (Fig. S14, ESI†). Besides, the Zn@Ag–Na‖PB cell also exhibits enhanced capacity retention in a wide temperature range from 55 to −20 °C, as show in Fig. 4f, g and S15 (ESI†). When the temperature is below 25 °C, the Zn–Na‖PB cell exhibits a rapid capacity decay, and this phenomenon is aggravated with a capacity retention of only 61.1% at −20 °C. Meanwhile, the Zn@Ag–Na‖PB cell maintains a retention of 72.7% under the same conditions, demonstrating the excellent temperature tolerance of the Zn@Ag substrate. Long-term cycling at low temperature is also shown in Fig. S16 (ESI†), and stable cycling is realized for the anode-less Zn@Ag–Na‖PB cell at −20 °C after 30 cycles, which is much superior to that with Zn, Cu and Al substrate. That is, the conductive and sodiophilic Ag coating layer induces uniform Na deposition with enhanced interfacial kinetics, dramatically improving the electrochemical performance and temperature tolerance of batteries.
The impact of Ag coating on interfacial kinetics is further assessed through varying-temperature EIS. The Nyquist plots of Zn–Na‖Zn–Na and Zn@Ag–Na‖Zn@Ag–Na symmetric cells from 273 to 323 K are depicted in Fig. 5a, and the activation energy (Ea) is determined from the temperature and as-fitted resistance of Na+ (REIS) through the substrate interface. It can be calculated based on the Arrhenius formula:47,48
 | (1) |
Conclusions
In summary, a conductive and sodiophilic Ag coating layer is introduced on commercial Zn foil to synergistically induce highly stable and reversible Na plating/stripping behavior. The enhanced sodiophilicity and conductivity of the Ag coating layer promote the homogenized distribution of the Na+ ion flux and electric field, guaranteeing uniform deposition with an ultrastable and ultrahigh CE of 99.9% after 500 cycles. As expected, highly stable long-term cycling for 1000 h of the Zn@Ag–Na‖Na cell, greatly enhanced capacity retention of 89.1% of the anode-less Zn@Ag–Na‖PB cell after 150 cycles, and stable cycling with a relatively high capacity of 79.9 mA h g−1 of the anode-free Zn@Ag‖PB cell after 100 cycles are realized. This work highlights the role of the conductive and sodiophilic Ag coating on stabilizing Na metal for highly stable and reversible sodium metal batteries.Data availability
The data that support the findings of this study are available within the article and its ESI,† or from the corresponding author on reasonable request.Author contributions
Xiaomin Chen (co-first author): conceptualization, data curation, methodology, investigation, formal analysis, writing – original draft. Xunzhu Zhou (co-first author): conceptualization, methodology, formal analysis, supervision, validation writing – original draft. Zhuo Yang: validation, investigation. Zhiqiang Hao: visualization, investigation. Jian Chen: resources, supervision. Wenxi Kuang: software, validation. Xiaoyan Shi: data curation, formal analysis. Xingqiao Wu: visualization, resources, writing – review & editing. Lin Li (corresponding author): conceptualization, funding acquisition, resources, supervision, writing – review & editing. Shu-Lei Chou (corresponding author): conceptualization, funding acquisition, resources, supervision.Conflicts of interest
There are no conflicts to declare.Acknowledgements
This work was supported by the National Natural Science Foundation of China (22309002, 52202286, 52250710680, 52171217), Natural Science Foundation of Zhejiang Province (LY24B030006), High-end Foreign Experts Recruitment Plan of China (G2023016009L), Key Research and Development Program of Zhejiang Province (2023C011232), Basic Research Project of Wenzhou City (G20220016), Science and Technology Plan Project of Wenzhou Municipality (ZG2022032).Notes and references
- Y. Zhao, L. V. Goncharova, A. Lushington, Q. Sun, H. Yadegari, B. Wang, W. Xiao, R. Li and X. Sun, Adv. Mater., 2017, 29, 1606663 CrossRef PubMed.
- M. Zhu, S. Li, B. Li, Y. Gong, Z. Du and S. Yang, Sci. Adv., 2019, 5, eaau6264 CrossRef CAS PubMed.
- H. Yadegari, Y. Li, M. N. Banis, X. Li, B. Wang, Q. Sun, R. Li, T.-K. Sham, X. Cui and X. Sun, Energy Environ. Sci., 2014, 7, 3747 RSC.
- L. Fan and X. Li, Nano Energy, 2018, 53, 630 CrossRef CAS.
- J. Xiang, L. Yang, L. Yuan, K. Yuan, Y. Zhang, Y. Huang, J. Lin, F. Pan and Y. Huang, Joule, 2019, 3, 2334 CrossRef CAS.
- R. Cao, K. Mishra, X. Li, J. Qian, M. H. Engelhard, M. E. Bowden, K. S. Han, K. T. Mueller, W. A. Henderson and J.-G. Zhang, Nano Energy, 2016, 30, 825 CrossRef CAS.
- X. Gao, Y.-N. Zhou, D. Han, J. Zhou, D. Zhou, W. Tang and J. B. Goodenough, Joule, 2020, 4, 1864 CrossRef CAS.
- E. Peled, J. Electrochem. Soc., 1979, 126, 2047 CrossRef CAS.
- H. Wang, C. Wang, E. Matios and W. Li, Nano Lett., 2017, 17, 6808 CrossRef CAS PubMed.
- Z. W. Seh, J. Sun, Y. Sun and Y. Cui, ACS Cent. Sci., 2015, 1, 449 CrossRef CAS PubMed.
- J. Chen, X.-Y. Chen, Y. Liu, Y. Qiao, S.-Y. Guan, L. Li and S.-L. Chou, Energy Environ. Sci., 2023, 16, 792 RSC.
- F. Wan, X. Zhou, Y. Lu, Z. Niu and J. Chen, ACS Energy Lett., 2020, 5, 3569 CrossRef CAS.
- Q. Lu, C. Liu, Y. Du, X. Wang, L. Ding, A. Omar and D. Mikhailova, ACS Appl. Mater. Interfaces, 2021, 13, 16869 CrossRef CAS PubMed.
- L. Mo, A.-L. Chen, Y. Ouyang, W. Zong, Y.-E. Miao and T. Liu, ACS Appl. Mater. Interfaces, 2021, 13, 48634 CrossRef CAS PubMed.
- J. Guo, F. Feng, S. Zhao, R. Wang, M. Yang, Z. Shi, Y. Ren, Z. Ma, S. Chen and T. Liu, Small, 2023, 19, 2206740 CrossRef CAS PubMed.
- H. Huang, Y. Wang, M. Li, H. Yang, Z. Chen, Y. Jiang, S. Ye, Y. Yang, S. He, H. Pan, X. Wu, Y. Yao, M. Gu and Y. Yu, Adv. Mater., 2023, 35, 2210826 CrossRef CAS.
- X. Zhou, Q. Zhang, Z. Hao, Y. Ma, O. A. Drozhzhin and F. Li, ACS Appl. Mater. Interfaces, 2021, 13, 53227 CrossRef CAS PubMed.
- P. Shi, S. Zhang, G. Lu, L. Wang, Y. Jiang, F. Liu, Y. Yao, H. Yang, M. Ma, S. Ye, X. Tao, Y. Feng, X. Wu, X. Rui and Y. Yu, Adv. Energy Mater., 2020, 11, 2003381 CrossRef.
- L. Yuan, J. Hao, B. Johannessen, C. Ye, F. Yang, C. Wu, S.-X. Dou, H.-K. Liu and S.-Z. Qiao, eScience, 2023, 3, 100096 CrossRef.
- J. Zheng, S. Chen, W. Zhao, J. Song, M. H. Engelhard and J.-G. Zhang, ACS Energy Lett., 2018, 3, 315 CrossRef CAS.
- X. Liu, X. Zheng, Y. Dai, W. Wu, Y. Huang, H. Fu, Y. Huang and W. Luo, Adv. Funct. Mater., 2021, 31, 2103522 CrossRef CAS.
- X. Zhou, Q. Zhang, Z. Zhu, Y. Cai, H. Li and F. Li, Angew. Chem., Int. Ed., 2022, 61, e202205045 CrossRef CAS.
- Q. Shi, Y. Zhong, M. Wu, H. Wang and H. Wang, Angew. Chem., Int. Ed., 2018, 57, 9069 CrossRef CAS PubMed.
- S. Zhao, C. Wang, D. Du, L. Li, S. Chou, F. Li and J. Chen, Angew. Chem., Int. Ed., 2020, 60, 3205 CrossRef PubMed.
- S. Tang, Z. Qiu, X.-Y. Wang, Y. Gu, X.-G. Zhang, W.-W. Wang, J.-W. Yan, M.-S. Zheng, Q.-F. Dong and B.-W. Mao, Nano Energy, 2018, 48, 101 CrossRef CAS.
- S. Tang, Y. Y. Zhang, X. G. Zhang, J. T. Li, X. Y. Wang, J. W. Yan, D. Y. Wu, M. S. Zheng, Q. F. Dong and B. W. Mao, Adv. Mater., 2019, 31, e1807495 CrossRef PubMed.
- Q. Chen, B. Liu, L. Zhang, Q. Xie, Y. Zhang, J. Lin, B. Qu, L. Wang, B. Sa and D.-L. Peng, Chem. Eng. J., 2021, 404, 126469 CrossRef CAS.
- J. Wu, P. Zou, M. Ihsan-Ul-Haq, N. Mubarak, A. Susca, B. Li, F. Ciucci and J. K. Kim, Small, 2020, 16, 2003815 CrossRef CAS.
- X. Wu, W. Zhang, N. Wu, S. S. Pang, Y. Ding and G. He, Adv. Energy Mater., 2021, 11, 2003082 CrossRef CAS.
- Y. Zhang, J. D. Howe, S. Ben-Yoseph, Y. Wu and N. Liu, ACS Energy Lett., 2021, 6, 404 CrossRef CAS.
- Y. Lu, Q. Zhang, M. Han and J. Chen, Chem. Commun., 2017, 53, 12910 RSC.
- W. Yang, W. Yang, L. Dong, G. Shao, G. Wang and X. Peng, Nano Energy, 2021, 80, 105563 CrossRef CAS.
- S. Ye, L. Wang, F. Liu, P. Shi and Y. Yu, eScience, 2021, 1, 75 CrossRef.
- S. H. Kim, U. J. Choe, N. Y. Kim and S. Y. Lee, Battery Energy, 2022, 1, 20210012 CrossRef CAS.
- Y. Kim, M. Kunzel, D. Steinle, X. Dong, G.-T. Kim, A. Varzi and S. Passerini, Energy Environ. Sci., 2022, 15, 2610 RSC.
- Z. Wang, X. Zhang, S. Zhou, K. Edstrom, M. Stromme and L. Nyholm, Adv. Funct. Mater., 2018, 28, 1804038 CrossRef.
- X. Lu, H. Zhao, Y. Qin, E. Matios, J. Luo, R. Chen, H. Nan, B. Wen, Y. Zhang, Y. Li, Q. He, X. Deng, J. Lin, K. Zhang, H. Wang, K. Xi, Y. Su, X. Hu, S. Ding and W. Li, ACS Nano, 2023, 17, 10665 CrossRef CAS PubMed.
- O. J. Dahunsi, S. Gao, J. Kaelin, B. Li, I. B. Abdul Razak, B. An and Y. Cheng, Nanoscale, 2023, 15, 3255 RSC.
- X. Xia, C. F. Du, S. Zhong, Y. Jiang, H. Yu, W. Sun, H. Pan, X. Rui and Y. Yu, Adv. Funct. Mater., 2021, 32, 2110280 CrossRef.
- H. Wang, E. Matios, J. Luo and W. Li, Chem. Soc. Rev., 2020, 49, 3783 RSC.
- B. Lee, E. Paek, D. Mitlin and S. W. Lee, Chem. Rev., 2019, 119, 5416 CrossRef CAS.
- K. Yan, Z. Lu, H.-W. Lee, F. Xiong, P.-C. Hsu, Y. Li, J. Zhao, S. Chu and Y. Cui, Nat. Energy, 2016, 1, 16010 CrossRef CAS.
- W. Luo, Y. Zhang, S. Xu, J. Dai, E. M. Hitz, Y. Li, C. Yang, C. Chen, B. Liu and L. Hu, Nano Lett., 2017, 17, 3792 CrossRef CAS PubMed.
- W. Plieth, Electrochemistry for Materials Science, Elsevier, Amsterdam, 2008, pp. 195–203 Search PubMed.
- A. Pei, G. Zheng, F. Shi, Y. Li and Y. Cui, Nano Lett., 2017, 17, 1132 CrossRef CAS PubMed.
- L. Wang, J. Song, R. Qiao, L. A. Wray, M. A. Hossain, Y. D. Chuang, W. Yang, Y. Lu, D. Evans, J. J. Lee, S. Vail, X. Zhao, M. Nishijima, S. Kakimoto and J. B. Goodenough, J. Am. Chem. Soc., 2015, 137, 2548 CrossRef CAS PubMed.
- H. Qiu, X. Du, J. Zhao, Y. Wang, J. Ju, Z. Chen, Z. Hu, D. Yan, X. Zhou and G. Cui, Nat. Commun., 2019, 10, 5374 CrossRef PubMed.
- X. Zhou, X. Chen, Z. Yang, X. Liu, Z. Hao, S. Jin, L. Zhang, R. Wang, C. Zhang, L. Li, X. Tan and S. L. Chou, Adv. Funct. Mater., 2023, 202302281 Search PubMed.
Footnotes |
| † Electronic supplementary information (ESI) available. See DOI: https://doi.org/10.1039/d3sc06468a |
| ‡ These authors contributed equally to this work. |
| This journal is © The Royal Society of Chemistry 2024 |

