 Open Access Article
Achievement of a giant electromechanical conversion coefficient in a molecule-based ferroelectric†
Bin
Wang‡
,
Zhirui
Li‡
,
Zhengxiao
Tang
,
Haixia
Zhao
 *,
Lasheng
Long
 * and
Lansun
Zheng
Collaborative Innovation Center of Chemistry for Energy Materials, State Key Laboratory of Physical Chemistry of Solid Surfaces and Department of Chemistry, College of Chemistry and Chemical Engineering, Xiamen University, Xiamen, 361005, Fujian, China. E-mail: hxzhao@xmu.edu.cn; lslong@xmu.edu.cn
First published on 28th August 2024
Abstract
Molecule-based ferroelectrics are promising candidates for flexible self-powered power supplies (i.e., piezoelectric generators (PEGs)). Although the large electromechanical conversion coefficients (d33 × g33) of piezoelectrics are key to enhancing the performance of PEGs in their nonresonant states, it remains a great challenge to obtain molecule-based piezoelectrics with large d33 × g33. Here, we report a molecule-based ferroelectric [(CH3)3NCH2CH2Cl][GaBr4] (1) that exhibits the largest piezoelectric coefficient (∼454 pC N−1) and electromechanical conversion coefficient (4953.1 × 10−12 m2 N−1) among all known free-standing polycrystalline pellets. Notably, the PEG comprising 15 wt% 1 and polydimethylsiloxane (PDMS) achieves a power density of up to 120 μW cm−2, marking the highest reported power density for ferroelectric@PDMS PEGs to date.
Introduction
Flexible wearable devices are an inevitable trend in the intelligent era.1–4 However, the low power densities of flexible self-powered power supplies have restricted their development.5 Because piezoelectric generators (PEGs) can directly convert mechanical energy into electrical energy and vice versa,6–8 they are considered promising self-powered power suppliers.9 According to eqn (1),10–12 | (1) |
With the use of both organic and inorganic units in the same molecule, molecule-based ferroelectrics are expected to combine the light weight and flexibility of organic piezoelectric materials with the mechanical strength and toughness of inorganic piezoelectric materials and exhibit large d33 × g33 and mechanical flexibility.14 Although recent studies have shown that there are indeed very few molecule-based ferroelectrics that exhibit large d33 × g33 and mechanical flexibility,2,15,16 their d33 × g33 values were recorded specifically along certain axial directions of single crystals. In contrast, the d33 × g33 values of molecule-based ferroelectrics obtained from free-standing polycrystalline pellets are relatively small, despite that the large d33 × g33 value for free-standing polycrystalline pellets of molecule-based ferroelectrics is of key importance for their practical application, especially in flexible wearable devices. Here, we report the molecule-based ferroelectric [(CH3)3NCH2CH2Cl][GaBr4] (1), which exhibits the largest d33 × g33 (4953.1 × 10−12 m2 N−1) among known free-standing polycrystalline pellets, and this demonstrates that the key to obtaining molecule-based ferroelectrics with large d33 × g33 values lies in using more flexible organic cations with larger dipole moments to construct ferroelectric materials with multiaxial characteristics.
Results and discussion
Crystal structure of 1
Compound 1 was prepared through a reaction of gallium(III) oxide and (2-chloroethyl)trimethylammonium chloride in HBr. Single crystal structural analysis revealed that 1 crystallized in the orthomorphic polar space group Pca21 at room temperature, and the cell parameters are a = 14.0655(8) Å, b = 7.6705(5) Å, c = 13.2164(7) Å, and Z = 4 (Table S1†). The asymmetric unit of 1 consists of one [(CH3)3NCH2CH2Cl]+ cation and one [GaBr4]− anion (Fig. S1†). The experimental powder X-ray diffraction (PXRD) patterns align closely with those simulated from the crystal structure at room temperature (Fig. S2†), confirming the purity of 1. Each [(CH3)3NCH2CH2Cl]+ cation is encircled by four [GaBr4]− anions, and vice versa, interconnected through Coulomb and van der Waals forces to form the three-dimensional structure of 1, as illustrated in Fig. 1. Because the distances between the Br atoms of [GaBr4]− anions and the surrounding non-hydrogen atoms are more than 3.50 Å (Table S2†), the intermolecular forces in 1 are mainly due to Coulomb force and van der Waals force among the ions. Consequently, the [(CH3)3NCH2CH2Cl]+ cation exhibits significant conformational flexibility, with the two carbon atoms in the side chain of the cation displaying orientational disorder across two positions (Fig. S1†). Thermogravimetric (TG) analysis and differential scanning calorimetry (DSC) (Fig. S3 and S4a†) reveal that 1 is stable up to 550 K, with no phase transition before melting at 485 K (Fig. S4b†). This behavior is due to the presence of a long side chain and a heavy Cl atom in the [(CH3)3NCH2CH2Cl]+ cation, which collectively contributes to a high tumbling energy barrier for the [(CH3)3NCH2CH2Cl]+ cation.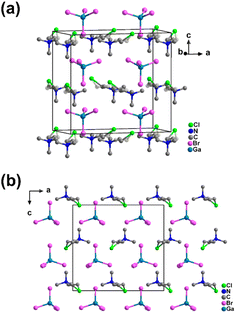 | ||
| Fig. 1 Crystal structure of 1. (a) Unit cell of 1 at room temperature. (b) Stacked structure of 1 viewed along the b axis at room temperature. | ||
Piezoelectric properties of 1
Because 1 crystallizes in the polar space group Pca21, second harmonic generation (SHG) was measured with a polycrystalline sample. As shown in Fig. S5a,† the SHG intensity was approximately ∼1.52 times that of potassium dihydrogen phosphate (KDP) with the same particle sizes. And the SHG-temperature dependence (Fig. S5b†) reveals that the SHG intensity remains stable until it melts. Due to the high SHG activity of 1, the d33 of a free-standing polycrystalline pellet was determined by a quasi-static method. The d33 of 454 pC N−1 with forward and reverse connections (Fig. S6†) determined for 1 is comparable to those of high-piezoelectric performance PZT (300–510 pC N−1).6 Although some molecule-based ferroelectrics reported previously exhibit the highest d33 along specific directions in single crystal samples, such as (TMFM)x(TMCM)1−xCdCl3 solid solutions,1 to the best of our knowledge, 1 is the largest d33 obtained to date for a free-standing polycrystalline pellet of a molecule-based ferroelectric material (Table S3†). To further confirm the piezoelectric properties of 1, its strain–electric field curve was measured. As shown in Fig. 2a, the typical butterfly shaped S–E curve for a free-standing polycrystalline pellet exhibit both positive and negative strains, and the strain signs were independent of the direction and magnitude of the applied field in the S–E curve of 1, indicating the presence of domain wall motion and/or domain reversal.17–19 Based on ,20 the piezoelectric coefficient
  of 1 was approximately 505 pm V−1. The
  greater than d33 can be attributed to the combined piezoelectric effect and pure electrostrictive effect.17–20 The large
  further confirms that 1 possesses excellent piezoelectric properties. According to the frequency-dependent relative permittivity at room temperature (Fig. S7†), the g33 for 1 is approximately 10
![[thin space (1/6-em)]](https://www.rsc.org/images/entities/char_2009.gif) 910 × 10−3 V m N−1 based on g33 = d33/ε33, where the ε33 value is chosen at the 10 kHz frequency rather than at extremely low frequencies (below 100 Hz) to avoid the contribution of space charge polarization at the electrode interface.21 It is worth mentioning that the g33 value of 1 is significantly larger than that of PVDF (286.7 × 10⁻³ V m N−1)22 and represents the largest g33 reported to date (Table S3†). Fig. 2b lists the d33 × g33 values of excellent piezoelectric materials reported to date and commercial piezoelectric materials. The calculated d33 × g33 for 1 is as high as 4953.1 × 10−12 m2 N−1. This value is significantly larger than those observed for commercial piezoelectric materials and also larger than those observed for the molecule-based piezoelectric materials TMCMGaCl4,16 TMCM2SnCl6,2 and (PTMA)CdBr2Cl1−xIx (TMCM = (CH3)3NCH2Cl+; PTMA = C6H5N(CH3)3+).21 In fact, the d33 × g33 for a free-standing polycrystalline pellet 1 is second only to that of single crystalline (TMFM)x(TMCM)1−xCdCl3 (x = 0.26, d33 = 1540 pC N−1) (Table S4†). Hence, the d33 × g33 in 1 is the largest reported to date for a free-standing polycrystalline pellet piezoelectric material.
910 × 10−3 V m N−1 based on g33 = d33/ε33, where the ε33 value is chosen at the 10 kHz frequency rather than at extremely low frequencies (below 100 Hz) to avoid the contribution of space charge polarization at the electrode interface.21 It is worth mentioning that the g33 value of 1 is significantly larger than that of PVDF (286.7 × 10⁻³ V m N−1)22 and represents the largest g33 reported to date (Table S3†). Fig. 2b lists the d33 × g33 values of excellent piezoelectric materials reported to date and commercial piezoelectric materials. The calculated d33 × g33 for 1 is as high as 4953.1 × 10−12 m2 N−1. This value is significantly larger than those observed for commercial piezoelectric materials and also larger than those observed for the molecule-based piezoelectric materials TMCMGaCl4,16 TMCM2SnCl6,2 and (PTMA)CdBr2Cl1−xIx (TMCM = (CH3)3NCH2Cl+; PTMA = C6H5N(CH3)3+).21 In fact, the d33 × g33 for a free-standing polycrystalline pellet 1 is second only to that of single crystalline (TMFM)x(TMCM)1−xCdCl3 (x = 0.26, d33 = 1540 pC N−1) (Table S4†). Hence, the d33 × g33 in 1 is the largest reported to date for a free-standing polycrystalline pellet piezoelectric material.
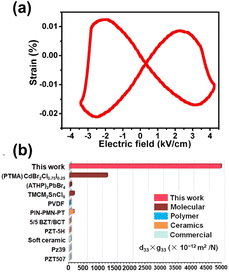 | ||
| Fig. 2 Piezoelectric properties of 1. (a) S–E curves of 1. (b) d33 × g33 of 1 compared with those of other reported piezoelectric materials. | ||
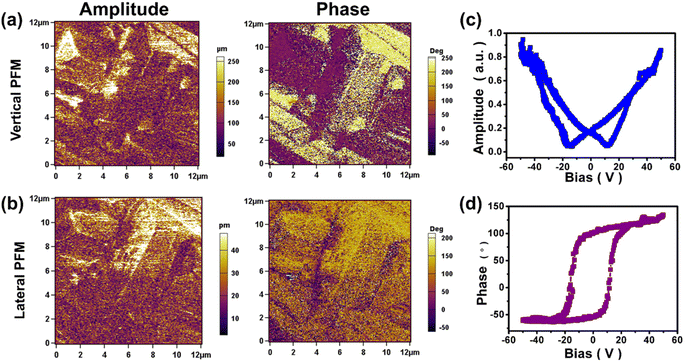
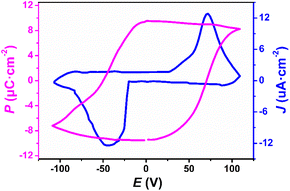
To reveal the intrinsic nature of the piezoelectric properties of 1, a polycrystalline film of 1 was examined with piezoelectric response force microscopy (PFM) in different areas at room temperature. As shown in Fig. 3a, b and S8,† the static ferroelectric domain structure and walls of 1 were observed in both the longitudinal and transverse PFM modes, and there is no crosstalk between the domain distributions and the corresponding morphologies in the longitudinal and transverse PFM modes (Fig. S9†). These results indicate that 1 has multiaxial characteristics. Consistently, the characteristic butterfly amplitude-voltage loops and square phase-voltage loops observed in Fig. 3c and d through switching spectroscopy PFM (SS-PFM) confirm the reversal of ferroelectric polarization in 1. Fig. S10a and b† demonstrate reversible polarization switching in response to the electric field. And the topography image in Fig. S10c† shows no signs of ablation in the area where reversible polarization switching occurs. Moreover, as depicted in the amplitude images and phase images overlaid on the 3D topography (Fig. S10d and e†), the reversible polarization switching is controlled by the electric field without any modification of the sample topography, further demonstrating the ferroelectricity of 1. Furthermore, the polarization–electric field (P–E) hysteresis loop measurements are carried out on a polycrystalline film of 1, and the positive up negative down (PUND) method is employed to eliminate leakage currents (Fig. S11†). As shown in Fig. 4, the P–E hysteresis loop and current density electric field (J–E) curve all confirm that 1 is a molecule-based ferroelectric. The saturated polarization (Ps) is 9.5 μC cm−2, close to the theoretical value (11.3 μC cm−2) which is determined by Gaussian09 software at the B3LYP/def2TZVP level of theory.
| d33 = 2ε33Q33Ps | (2) |
| g33 = d33/ε33 = 2Q33Ps | (3) |
Performance of the 1@PDMS PEG
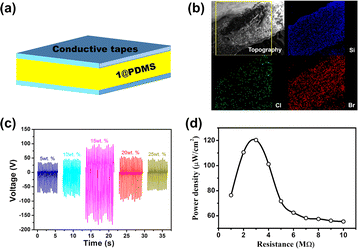
Because 1 exhibited very large d33 × g33, the PEG was fabricated with a polymer composite film comprising particles of 1 and polydimethylsiloxane (PDMS) (1@PDMS) as the piezoelectric layer and conductive tape as the electrode (Fig. 5a). The particles of 1 were synthesized using the reversed-phase microemulsion method. The lengths and widths of the rods in 1 were in the ranges 7000–9000 nm and 1000–2000 nm, respectively (Fig. S12†). Polymer composite films (1@PDMS) with 5, 10, 15, 20, and 25 wt% contents for the particles of 1 were prepared by dispersing the corresponding quantities into PDMS with mechanical stirring. The morphology and cross-sectional scanning electron microscopy (SEM) and mapping images of chlorine (Cl), bromine (Br), and gallium (Ga) of compound 1 and silicon (Si) of PDMS revealed that the thickness of 15 wt% 1@PDMS is ∼300 μm and that the particles of 1 are uniformly dispersed within the PDMS matrix (Fig. 5b and S13†).The PEG consisting of 3 cm × 3 cm 1@PDMS composite films with an effective working surface area of 2 × 2 cm2 is fabricated to measure the open circuit voltage (Voc), the short-circuit current (Isc) and the power density by applying a constant force of less than 20 N to the surfaces of the PEGs (Fig. S14†) with thumb pressure. As shown in Fig. 5c, the open circuit voltage (Voc) increased with increasing concentration of 1 and reached saturation when the concentration of 1 was 15 wt%. Then, it decreased with increasing concentration of 1 owing to the presence of Maxwell–Wagner–Sillars polarization in the heterogeneous materials.28–30 The short-circuit current (Isc) showed the same trend as the open circuit voltage with an increase in the concentration of 1 (Fig. S15†). The maximum values for Voc and Isc were 179 V and 6.4 μA, respectively. These values are significantly larger than 42 V and 1.2 μA observed in the ground sample 1@PDMS (Fig. S16†). Considering the morphological differences between particles 1 synthesized by the reversed-phase microemulsion method and the ground sample (Fig. S17†), the enhancement in outputs is mainly due to the morphological changes of the sample caused by high surface stress.31 The peak values of Voc for the forward and backward connections were completely reversed, confirming that the signal was generated by the piezoelectric effect (Fig. S18†). To further exclude the effect of PDMS, pure PDMS film samples were prepared and tested for Voc and Isc. Under identical conditions, the Voc and Isc values for these pure PDMS samples, matched in size, were 3.7 V and 25 nA, respectively (Fig. S19†). These results clearly indicate that the primary contribution to the output performance of the 1@PDMS composite arises from the piezoelectric effect of 1.
To evaluate the maximum power density of the 15 wt% 1@PDMS composite, the PEG power density was measured across load resistances ranging from 1 to 10 MΩ. As illustrated in Fig. 5d, the maximum instantaneous power density reached 120 μW cm−2 at a load resistance of 3 MΩ. This represents the highest output power density among all known PEGs utilizing the same PDMS matrix (Table S7†). Significantly, the PEG consisting of 10 cm × 10 cm 1@PDMS composite films with an effective working surface area of 8 × 8 cm2 was connected with a full-wave rectifying bridge and light-emitting diodes (LEDs) in the circuit (Fig. S20a†) and successfully powered 100 LEDs connected in series, as shown in Fig. 6a. Additionally, a charge transfer circuit equipped with a full-wave rectifying bridge and a 3.3 μF parallel capacitor was utilized to operate a calculator and an electronic watch (Fig. S20b and c†). Notably, the 15 wt% 1@PDMS PEG substitutes for the solar system to power the calculator, enabling it to perform various calculation tasks (Fig. 6b and Movie S1†). Similarly, it also drove an electronic watch to work continuously (Fig. 6c and Movie S2†). It is worth mentioning that the operating powers for commonly used portable electronic devices, such as watches, RFID tags, pacemakers and hearing aids, range from 3 to 100 μW.32 Therefore, the 1@PDMS PEG could be integrated into self-powered devices or battery chargers.
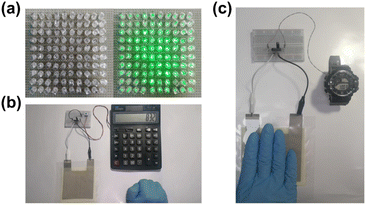 | ||
| Fig. 6 PEG device application demonstration. Lighting LEDs (a), powering a commercial calculator (b) and a wearable electronic watch (c) by pressing 15 wt% 1@PDMS PEGs. | ||
Conclusions
In summary, we have reported a molecule-based ferroelectric 1, characterized by exceptionally high values of d33 (454 pC N−1) and g33 (10![[thin space (1/6-em)]](https://www.rsc.org/images/entities/char_2009.gif) 910 × 10−3 V m N−1) simultaneously and the largest d33 × g33 (4953.1 × 10−12 m2 N−1) among all known free-standing polycrystalline pellets. Investigation on the piezoelectric properties of 1 revealed that employing more flexible organic cations with larger dipole moments to construct multiaxial molecule-based ferroelectrics is an effective way to obtain molecule-based ferroelectrics with large d33 × g33 values. Significantly, the 1@PDMS PEG, composed of 15 wt% compound 1 and PDMS, achieved a power density of up to 120 μW cm−2 under a 20 N pressure applied with thumb pressure, marking the highest power density reported to date for any ferroelectric@PDMS PEG. This work therefore establishes a robust foundation for the practical application of molecule-based materials in flexible, self-powered power supplies.
910 × 10−3 V m N−1) simultaneously and the largest d33 × g33 (4953.1 × 10−12 m2 N−1) among all known free-standing polycrystalline pellets. Investigation on the piezoelectric properties of 1 revealed that employing more flexible organic cations with larger dipole moments to construct multiaxial molecule-based ferroelectrics is an effective way to obtain molecule-based ferroelectrics with large d33 × g33 values. Significantly, the 1@PDMS PEG, composed of 15 wt% compound 1 and PDMS, achieved a power density of up to 120 μW cm−2 under a 20 N pressure applied with thumb pressure, marking the highest power density reported to date for any ferroelectric@PDMS PEG. This work therefore establishes a robust foundation for the practical application of molecule-based materials in flexible, self-powered power supplies.
Experimental
Synthesis of compound 1
All reagents and solvents are commercially available and of reagent grade purity for direct synthesis. Gallium(III) oxide (2 mmol) was first dissolved into HBr (40%) at 100 °C, and then (2-chloroethyl)trimethylammonium chloride (2 mmol) was dissolved in the above solution. The two solutions were mixed to obtain a clear, faint yellow solution. After the solution evaporated for weeks, faint yellow crystals of 1 were obtained (total yield: 85%, based on (2-chloroethyl)trimethylammonium chloride).Preparation of particles of 1
A 330 mg mL−1 aqueous solution of 1 was slowly dripped into 30 mL of isopropyl alcohol with ultrasonic stirring at room temperature. During mixing, the colorless solution turned into an emulsion, indicating particle formation. The particles were purified by centrifugation at 8500 rpm for 2–3 min and then redissolved in 1 mL of toluene to prepare the composite film.Preparation of 1@PDMS composite films
A PDMS solution was composed of primary and secondary liquids with toluene stirred in a ratio of 10![[thin space (1/6-em)]](https://www.rsc.org/images/entities/char_2009.gif) :
:![[thin space (1/6-em)]](https://www.rsc.org/images/entities/char_2009.gif) 1
1![[thin space (1/6-em)]](https://www.rsc.org/images/entities/char_2009.gif) :
:![[thin space (1/6-em)]](https://www.rsc.org/images/entities/char_2009.gif) 11 in a 50 mL beaker. Then, 1 was dispersed in toluene in various proportions (5, 10, 15, 20 and 25 wt%) and mixed with PDMS solutions. The prepared solution was evenly spread in a Teflon evaporator with a diameter of 60 mm and then cured at 373 K for 2 h in an ambient atmosphere.
11 in a 50 mL beaker. Then, 1 was dispersed in toluene in various proportions (5, 10, 15, 20 and 25 wt%) and mixed with PDMS solutions. The prepared solution was evenly spread in a Teflon evaporator with a diameter of 60 mm and then cured at 373 K for 2 h in an ambient atmosphere.
Fabrication of PEGs
First, 6 cm diameter 1@PDMS composite films were sliced into 3 cm × 3 cm squares. Subsequently, the sheared 1@PDMS composite films were inserted between two conductive cloth tape electrodes, each sized 2 cm × 6 cm and coated with a conductive tape electrode (a polyester, metallized with Cu and Ni), to fabricate a sandwich structure device. The effective working area of the PEG device is 2 × 2 cm2. Second, the sandwich structure of the conductive tape electrode–1@PDMS composite films–conductive tape electrode was clamped using laminating pouches. Then, to improve contact between the conductive tape electrode and the films, the laminating pouches were pressed tightly with a commercial thermal laminator to eliminate air gaps. Using the above method, the PEG consisting of 10 cm × 10 cm 1@PDMS composite films with an effective working surface area of 8 × 8 cm2 is fabricated. Finally, the devices of 1@PDMS were poled with 50 kV cm−1 for 30 min at room temperature.PFM measurement
A commercial piezoresponse force microscope (Cypher, Asylum Research) was utilized to perform piezoresponse force microscopy (PFM) measurements with an AC driving voltage applied to the conductive tip. The domain imaging studies were conducted using conductive Pt/Ir-coated silicon probes (EFM-20, Nanoworld) with a nominal spring constant of ∼2.8 N m−1 and a free-air resonance frequency of ∼75 kHz. And a 20 μL aqueous solution of 1 with 20 mg mL−1 was gently evaporated onto freshly cleaned ITO-coated glass to prepare thin films. Then, the prepared sample was loaded and the head was positioned above the sample. The sum and deflection engaging the surface were set. After that, the driving voltage was configured (1.5 V) and the drive frequency was tuned (320 kHz, 670 kHz), as well as scanning parameters were set (2.44 Hz, 12![[thin space (1/6-em)]](https://www.rsc.org/images/entities/char_2009.gif) μm, 5
μm, 5![[thin space (1/6-em)]](https://www.rsc.org/images/entities/char_2009.gif) μm). At last, imaging parameters were set and imaging was started.
μm). At last, imaging parameters were set and imaging was started.
PEG performance measurement
The Voc, Isc and power density of PEGs of 1@PDMS were measured using a Keithley electrometer (6517B). The outputs of the PEGs were measured by applying a constant force of less than 20 N and approximately 2 Hz to the surfaces of the PEGs with thumb pressure. The PEG power density was obtained through measuring the output current of various load resistances ranging from 1 to 10 MΩ under the same applied force conditions.Details of the XRD, TG, SHG, d33, S–E curve, dielectric constant, and P–E curve measurements are provided in the ESI.†
Data availability
The data supporting this article have been included as part of the ESI.†Author contributions
H. X. Z., L. S. L. and L. S. Z. conceived the idea and designed the project. B. W. and Z. R. L. grew the single crystals and prepared the devices, carried out the PFM, ferroelectric, piezoelectric, dielectric, and TG measurements, and analyzed the results with H. X. Z. and L. S. L. Z. R. L performed the powder XRD measurements and conducted the powder XRD analysis. Z. X. T. contributed to sample preparation. B. W., Z. R. L., H. X. Z. and L. S. L. wrote the manuscript with input from all the authors. All authors discussed the results and commented on the manuscript.Conflicts of interest
There are no conflicts to declare.Acknowledgements
The authors thank Prof. Ren-Gen Xiong, Wei-Qiang Liao and Xian-jiang Song (Nanchang University) for their assistance and suggestions. This work was supported by the National Natural Science Foundation of China (grant no. 22371235, 92161203, and 92361301).Notes and references
- W. Q. Liao, D. Zhao, Y. Y. Tang, Y. Zhang, P. F. Li, P. P. Shi, X. G. Chen, Y. M. You and R. G. Xiong, Science, 2019, 363, 1206–1210 CrossRef.
- G. G. Huang, A. A. Khan, M. M. Rana, C. Xu, S. Xu, R. Saritas, S. Zhang, E. Abdel-Rahmand, P. Turban, S. Ababou-Girard, C. Wang and D. Y. Ban, ACS Energy Lett., 2020, 6, 16–23 CrossRef.
- K. Dong, X. Peng and Z. L. Wang, Adv. Mater., 2020, 32, 1902549 CrossRef CAS.
- Y. Jiang, K. Dong, J. An, F. Liang, J. Yi, X. Peng, C. Ning, C. Ye and Z. L. Wang, ACS Appl. Mater. Interfaces, 2021, 13, 11205–11214 CrossRef CAS PubMed.
- Z. Lou, L. Li, L. Wang and G. Shen, Small, 2017, 13, 1701791 CrossRef.
- Z. Li, H. C. Thong, Y. F. Zhang, Z. Xu, Z. Zhou, Y. X. Liu, Y. Y. S. Cheng, S. H. Wang, C. Zhao, F. Chen, K. Bi, B. Han and K. Wang, Adv. Funct. Mater., 2020, 31, 2005012 CrossRef.
- Y. Saito, H. Takao, T. Tani, T. Nonoyama, K. Taktori, T. Homma, T. Nagaya and M. Nakamura, Nature, 2004, 432, 81–84 CrossRef.
- K. Uchino, Piezoelectric Actuators and Ultrasonic Motors, Springer, New York, 1996 Search PubMed.
- Z. Z. Liu, S. S. Li, J. Z. Zhu, L. W. Mi and G. Q. Zheng, ACS Appl. Mater. Interfaces, 2022, 14, 11854–11863 CrossRef CAS PubMed.
- M. P. Zheng, Y. D. Hou, M. K. Zhu and H. Yan, J. Chin. Ceram. Soc., 2016, 44, 359–366 CAS.
- V. Bijalwan, J. Erhart, Z. Spotz, D. Sobola, V. Prajzler, P. Tofel and K. Maca, J. Am. Ceram. Soc., 2020, 104, 1088–1101 CrossRef.
- I. T. Seo, C. H. Choi, D. Song, M. S. Jang, B. Y. Kim, S. Nahm, Y. S. Kim, T. H. Sung, H. C. Song and S. Zhang, J. Am. Ceram. Soc., 2013, 96, 1024–1028 CrossRef CAS.
- Y. X. Gao, C. R. Qiu, G. Li, M. Ma, S. Yang, Z. Xu and F. Li, Appl. Energy, 2020, 271, 115193 CrossRef.
- T. Vijayakanth, D. J. Liptrot, E. Gazit, R. Boomishankar and C. R. Bowen, Adv. Funct. Mater., 2022, 32, 2109492 CrossRef CAS.
- X. G. Chen, X. J. Song, Z. X. Zhang, P. F. Li, J. Z. Ge, Y. Y. Tang, J. X. Gao, W. Y. Zhang, D. W. Fu, Y. M. You and R. G. Xiong, J. Am. Chem. Soc., 2020, 142, 1077–1082 CrossRef CAS.
- B. Wang, J. F. Hong, Y. T. Yang, H. X. Zhao, L. S. Long and L. S. Zheng, Matter, 2022, 5, 1296–1304 CrossRef CAS.
- Y. Liu, B. Zhang, W. Xu, A. Haibibu, Z. Han, W. Lu, J. Bernholc and Q. Wang, Nat. Mater., 2020, 19, 1169–1174 CrossRef CAS PubMed.
- Q. M. Zhang, V. Bharti and X. Zhao, Science, 1998, 280, 2101–2104 CrossRef CAS.
- L. Jin, J. Pang, Y. Pu, N. Xu, Y. Tian, R. Jing, H. Du, X. Wei, Z. Xu, D. Guo, J. Xu and F. Gao, Ceram. Int., 2019, 45, 22854–22861 CrossRef.
- C. W. Ahn, G. Choi, I. W. Kim, J. S. Lee, K. Wang, Y. Hwang and W. Jo, NPG Asia Mater., 2017, 9, e346 CrossRef CAS.
- Z. Hu, K. Parida, H. Zhang, X. Wang, Y. Li, X. Zhou, S. A. Morris, W. H. Liew, H. Wang, T. Li, F. Jiang, M. Yang, M. Alexe, Z. Du, C. L. Gan, K. Yao, B. Xu, P. S. Lee and H. J. Fan, Nat. Commun., 2022, 13, 5607 CrossRef.
- M. Y. Li, H. J. Wondergem, M. J. Spijkman, K. Asadi, I. Katsouras, P. W. Blom and D. M. de Leeuw, Nat. Mater., 2013, 12, 433–438 CrossRef CAS.
- J. Harada, N. Yoneyama, S. Yokokura, Y. Takahashi, A. Miura, N. Kitamura and T. Inabe, J. Am. Chem. Soc., 2018, 140, 346–354 CrossRef CAS.
- D. Li, X. M. Zhao, H. X. Zhao, X. W. Dong, L. S. Long and L. S. Zheng, Adv. Mater., 2018, 30, 1803716 CrossRef.
- Y. Z. Hu, L. You, B. Xu, T. Li, S. A. Morris, Y. X. Li, Y. H. Zhang, X. Wang, P. S. Lee, H. J. Fan and J. L. Wang, Nat. Mater., 2021, 20, 612–617 CrossRef CAS PubMed.
- J. Harada, Y. Kawamura, Y. Takahashi, Y. Uemura, T. Hasegawa, H. Taniguchi and K. Maruyama, J. Am. Chem. Soc., 2019, 141, 9349–9357 CrossRef CAS.
- Y. X. Gao, M. H. Wu and P. Jena, Nat. Commun., 2021, 12, 1331 CrossRef CAS PubMed.
- R. Ding, H. Liu, X. L. Zhang, J. X. Xiao, R. Kishor, H. X. Sun, B. W. Zhu, G. Chen, F. Gao, X. H. Feng, J. S. Chen, X. D. Chen, X. W. Sun and Y. J. Zheng, Adv. Funct. Mater., 2016, 26, 7708–7716 CrossRef CAS.
- M. Arous, H. Hammami, M. Lagache and A. Kallel, J. Non-Cryst. Solids, 2007, 353, 4428–4431 CrossRef CAS.
- S. Ippili, V. Jella, J. Kim, S. Hong and S. G. Yoon, ACS Appl. Mater. Interfaces, 2020, 12, 16469–16480 CrossRef CAS.
- A. A. Khan, G. Huang, M. M. Rana, N. Q. Mei, M. Biondi, S. Rassel, N. Tanguy, B. Sun, Z. Leonenko, N. Yan, C. L. Wang, S. H. Xu and D. Y. Ban, Nano Energy, 2021, 86, 106039 CrossRef CAS.
- E. L. Pradeesh, S. Udhayakumar, M. G. Vasundhara and G. K. Kalavathi, Microsyst. Technol., 2022, 28, 1797–1830 CrossRef.
Footnotes |
| † Electronic supplementary information (ESI) available. CCDC 2190250. For ESI and crystallographic data in CIF or other electronic format see DOI: https://doi.org/10.1039/d4sc04185b |
| ‡ These authors contributed equally to this work. |
| This journal is © The Royal Society of Chemistry 2024 |

