 Open Access Article
Unexpected full-color luminescence produced from the aggregation of unconventional chromophores in novel polyborosilazane dendrimers†
Yuang
Li
,
Yingli
Zhu
 *,
Xiangcheng
Li
 * and
Pingan
Chen
The State Key Laboratory of Refractories and Metallurgy, Key Laboratory of High Temperature Electromagnetic Materials and Structure of MOE, Wuhan University of Science and Technology, Wuhan 430081, PR China. E-mail: yinglizhu@wust.edu.cn; lixiangcheng@wust.edu.cn
First published on 5th October 2024
Abstract
Non-conjugated fluorescent polymers (NCPLs) are of interest due to their remarkable biocompatibility, processability and biodegradability. However, the realization of multicolor emitting NCPLs through structure modulation remains a great challenge. In this work, a series of novel yttrium-branched polyborosilazane (PBSZ) structures (PY1–PY3) were prepared. PBSZ exhibits a blue emission peaked at 450 nm, and the introduction of an yttrium-branched-chain generates a new long-wavelength emission center. As the degree of yttrium branching increases, the emerged emission peak shifts from 532 to 646 nm, and its intensity gradually increases to 1.4 times that of the blue emission. CIE chromaticity coordinates indicate that yttrium-branching modulates the emission color from blue (0.19, 0.21) to near white (0.34, 0.40) and red (0.43, 0.36). Particularly, the PY3 sample exhibits an ultra-broad emission spectrum; covering the range of 400–750 nm. Theoretical calculation indicates that the yttrium-branched-chains promote heteroatom delocalization to form “cluster chromophores”, generating new orbitals with lower gaps. In addition, experimental results prove that the yttrium-branched-chains balance the flexibility of the molecular backbone and generate stable fluorescent clusters, which intensifies the non-conjugated linking and through-space-conjugation (TSC) effects, thus generating long-wavelength emission. This work proves that yttrium “end-grafting” is a feasible strategy for equilibrium flexibility and to realize full-color emission in non-conjugated polymers.
Introduction
In recent years, organic luminescent materials (OLMs) have developed rapidly in comparison with other man-made luminescent materials due to their advantages in molecular structural diversity, tunability of emission wavelengths and high quantum yields.1,2 Conventional organic luminescent materials are usually classified into two categories based on their intrinsic emission properties, aggregation-caused quenching (ACQ)3–5 and aggregation-induced emission (AIE).6,7 These luminescent clusters are usually composed of extended π-electron systems or conjugated systems with a wide range of delocalized electrons, such as polycyclic8,9 and heterocyclic aromatic compounds.10,11 At the same time, there is also a class of fluorophores that do not rely on conventional large π-conjugated structures, but are rather cluster fluorophores that achieve luminescence through spatially extended TSC, which we call non-conventional luminescent polymers.12,13 Compared with aromatic conventional luminescent polymers, non-conventional luminescent polymers have many intrinsic advantages required for large-scale production and practical applications, such as short synthetic routes, easy processing and preparation, and biocompatibility.14–16 Besides, non-conventional luminophores contain only lone pair electrons (e.g., O, N, and S) or isolated unsaturated bonds (e.g., –NHCO–, –NHCS–, –COOH–, and –NH–) in electron-rich heteroatoms. So far, a series of NCLPs have been reported, including polyamidoamine (PAMAM), polyester (PE), polyethyleneimine (PEI), poly(maleic anhydride-alt-vinyl acetate) (PMV), hyperbranched polysiloxanes (HPSi), polyetheramides (PES), hyperbranched polyborosiloxane (HBPSi),17–23 and so on. However, the electrons in non-conjugated polymers are localized, which means that the electrons are restricted within the molecule and cannot move freely throughout the molecular backbone, as π-electrons in conjugated polymers. Moreover, NCPLs usually face challenges in extending their emission beyond blue monochromatic light due to the high excitation energy of a single subfluorescent part,24 which limits their further development. Therefore, it is urgently required to rationally design the molecular structure of non-conjugated polymers, to achieve the tunability of the emission wavelength and panchromatic emission in NCPLs.Recent studies have shown that spatial conjugation and conformational solidification induced by strong molecular interactions (e.g., hydrogen and ionic bonding) can redshift the emission wavelength of NCPLs.25,26 For example, a green (504 nm) emission was achieved using polyester clusters obtained by copolymerisation of PO and 3,4,5,6-tetrahydrophthalic anhydride (THPA),27 whereas molecular structure optimisation of non-aromatic hyperbranched poly(boronate),28 poly(vinylpyrrolidone-sodium maleate),29 and poly(maleimide) resulted in red (465–608 nm) fluorophores.30 In addition, an orange-red (625–636 nm) cluster luminescence (CL) can be realized by controlling the length of the alkyl chain in the aliphatic ammonium salts, which involves a synergistic energy transfer that occurs between clusters with different electron leaving domains and clusters.31,32 On the other hand, the construction of hyperbranched structures and the coordination of the soft and rigid composition are other methods for controlling luminescence.33,34 For instance, the introduction of piperazine rigid units and “side-chain engineering” have conferred better rigidity and mobility to polysiloxane, enabling dynamic tuning of the emission wavelength over a wider wavelength range.35–38 The cross-space acceptor–donor charge transfer between the main and side chains can provide a rigid environment, to restrict the intramolecular motion of flexible molecular chain segments, thereby promoting the formation of clusteroluminogens (CLgens) in NCPLs.39,40 The above approaches realize efficiently the red-shift of emission spectra of NCPLs; it is still a huge challenge to achieve full color emission in NCPLs.
In this work, we have developed a feasible strategy to obtain full-color emission (400–750 nm) in Y-branched PBSZ (PBSZY) NCPLs. Photoluminescence studies have shown that the emission wavelength shifts to the red region as the concentration of Y chain segments increases, and the panchromatic emission of sample PY3 is reported for the first time in NCPLs. Notably, the blue-emitting PBSZ possesses nitrogen atoms with lone pair electrons and abundant grafting sites.41 Thus it plays the role of balancing the rigidity and flexibility of the polymer chain by changing the degree of Y-branching,42 which provides an expected platform for large-scale structural and luminescence regulation. Experimental and computational results reveal the balancing effect of Y-branched chains on molecular flexibility, and the electronic reconfiguration that drives the fluorescence emission from blue to red, induced by the binding of Y atoms to PBSZ. This study provides new ideas for designing non-conjugated fluorescent materials with broad wavelength emission.
Experimental section
Materials
The raw materials for this experiment include borane dimethyl sulfide complex (2.0 M tetrahydrofuran solution), dichloromethylvinylsilane (DCMVS), dichloromethylsilane (DCMS), hexamethyldisilaniline (HMDZ), tetrahydrofuran (THF), dimethylformamide (DMF), and anhydrous yttrium chloride (99.95% YCl3). The above drugs were purchased from Shanghai Aladdin Biochemical Technology Co.Synthesis of yttrium-branched polyborosilazanes (PBSZY)
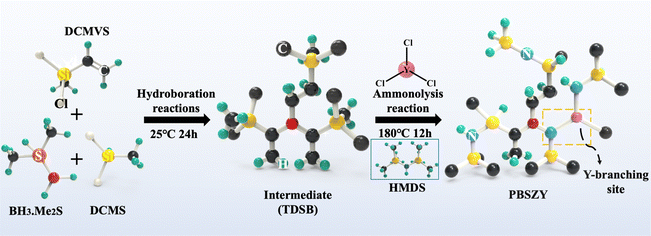
The reaction and condensation apparatuses were constructed using the Schlenk technique; the reaction apparatus was placed in an ice bath, and then a mixture containing 20 mL THF, 0.14 mol DCMVS, and 0.048 mol borane dimethyl sulfide was sequentially injected into a closed three-necked flask under a protective atmosphere. The solution was then stirred at room temperature for 24 h to obtain the intermediate tris(dichloromethylmethylsilyl ethyl)borane (TDSB). A certain amount of YCl3 powder was dissolved in 5 mL of DMF to prepare its solution. Afterwards, a certain amount of YCl3 solution, 0.096 mol DCMS and 0.42 mol HMDZ were injected sequentially into the TDSB intermediate solution. The mixed solution was stirred at room temperature for 12 h, and then warmed up to 110 °C and 180 °C at a warming rate of 5 °C min−1 and held for 3 h. The reaction product was then distilled under reduced pressure at 180 °C for 1 h to remove the by-products and solvent to obtain the yttrium-branched PBSZY polymer, named PYx, where x represents the percentage content of Y, and x = 0, 1, 2, 3 represents the Y content of 0 wt%, 1.0 wt%, 2.0 wt%, and 3.0 wt%, respectively, and CPY1 was obtained by holding the PY1 sample at 280 °C under a N2 atmosphere for 2 h. The synthesis process of PBSZY is shown schematically in Scheme 1.Characterization instruments and methods
The elemental composition and atomic bonding states of the polymers were analyzed by X-ray photoelectron spectroscopy (XPS, Esca Lab Xi+, USA), in which the Al Kα-ray (hv = 1486.6 eV) excitation source was operated with a voltage and filament current of 12.5 kV and 16 mA, respectively, and the charge correction was performed using the C 1s = 284.80 eV binding energy as the energy standard. The NMR hydrogen (1H-NMR), carbon (13C-NMR), and boron (11B-NMR) spectra of the polymers were determined at room temperature using a Bruker Avance 600 MHz NMR instrument with deuterated chloroform (CDCl3) and deuterated methanol (CD4O) as the solvents, and tetramethylsilane (TMS) as the internal standard. A small amount of polymer block was taken and ground together with potassium bromide, after which the powder was made into transparent wafers, and then the samples were scanned and tested using a NICOLET 5700 infrared spectrometer from the United States of America in the wave number range of 4000 to 400 cm−1 and the infrared spectra were obtained. The excitation (Ex) and emission (Em) spectra of different concentrations of polymers were obtained using a fluorescence spectrophotometer model RF-5301 from Shimadzu, Japan. The light source of the instrument was a xenon lamp, the width of the Ex and Em slits was 5 mm, the scanning range was 220–900 nm with a sampling interval of 1 nm, and the container for the polymer solution was a quartz cell of 10 mm × 10 mm × 5 mm. The number-averaged molecular weight (Mn) and polydispersity index (PDI) were obtained using a PL-GPC 220 chromatograph, using chromatographic purity DMF as an eluent. Differential scanning calorimetry (DSC) tests were conducted on a TA-Q2000 instrument with a heating rate of 2 °C min−1 under a N2 atmosphere. The time-resolved PL (TRPL) spectrum was obtained using a fluorescence spectrometer (FLS1000, Edinburgh Instruments) using a 375 nm laser as the excitation source; quantum yields were obtained by using an additional integrating sphere.Computational details
All the calculations were performed by the TD-DFT method at the B3LYP/6-31 (d,p) level using the Gaussian 09 program. The polymer-related calculations (refers to quantum chemical calculations of the molecular conformation and electronic structure of polymers) were replaced by oligomers. Calculations for small molecules were performed using a repeating unit.Results and discussion
The structures of PY0, PY1, PY2 and PY3 polymers were characterized by 1H, 13C, 11B and 29Si-NMR, respectively, and the results are shown in Fig. 1. It can be seen in Fig. 1a that the hydrogen signal peaks at 4.9–4.6, 1.90, 1.29, 0.98 and 0.18–0.06 ppm are attributed to Si–H, CH3–CH, C–H, N–H and Si–CH3, respectively, which is in accordance with the structure of PBSZ in our early work.43 Among them, the hydrogen signal peak of PY0 located at 6.2–5.6 is attributed to Si–CH![[double bond, length as m-dash]](https://www.rsc.org/images/entities/char_e001.gif) CH2, which is an incompletely reacted feedstock. Combined with the signal peak of tertiary carbon (Si–CH
CH2, which is an incompletely reacted feedstock. Combined with the signal peak of tertiary carbon (Si–CH![[double bond, length as m-dash]](https://www.rsc.org/images/entities/char_e001.gif) CH2) at 136.7 ppm in Fig. 1b, it can be shown that the vinyl groups have been generated in PY3. The 11B-NMR spectra of polyborosilazane and Y-branched structures are shown in Fig. 1c. One of the boron signal peaks at 47.8 ppm in PY0 clearly indicates that the boron atom is attached to a nitrogen atom and two methyl groups, and thus the dendritic unit of PBSZ is amine dialkylboron. As the Y branching degree increases, the boron signal peaks and the TDSB dendritic unit peak at 80.91 ppm of PY1–PY3 keep on weakening. And a new peak appearing at −5.1 ppm for PY2 and PY3 is assigned to organoborane (BR3) where a boron atom attaches to three R groups and partially coordinates to the lone pair electrons of nitrogen. The PBSZ dendritic unit is a boron atom attached to a nitrogen atom and two methyl groups, so it is an amine dialkyl boron. Except for the main peak at −5.1 ppm, two smaller peaks appearing at 31.3 and 28.2 ppm are attributed to dialkyl borate and alkyl borate, respectively, produced by hydrolysis or oxidation of the sample during storage or testing. In addition, we calculated the branching degree by measuring the peak area variation of the N–H directly linked through the substituted amino group, and the branching degrees for PY1–PY3 were calculated to be 46.5% and 53.7%, respectively, which are higher than that of PY0.
CH2) at 136.7 ppm in Fig. 1b, it can be shown that the vinyl groups have been generated in PY3. The 11B-NMR spectra of polyborosilazane and Y-branched structures are shown in Fig. 1c. One of the boron signal peaks at 47.8 ppm in PY0 clearly indicates that the boron atom is attached to a nitrogen atom and two methyl groups, and thus the dendritic unit of PBSZ is amine dialkylboron. As the Y branching degree increases, the boron signal peaks and the TDSB dendritic unit peak at 80.91 ppm of PY1–PY3 keep on weakening. And a new peak appearing at −5.1 ppm for PY2 and PY3 is assigned to organoborane (BR3) where a boron atom attaches to three R groups and partially coordinates to the lone pair electrons of nitrogen. The PBSZ dendritic unit is a boron atom attached to a nitrogen atom and two methyl groups, so it is an amine dialkyl boron. Except for the main peak at −5.1 ppm, two smaller peaks appearing at 31.3 and 28.2 ppm are attributed to dialkyl borate and alkyl borate, respectively, produced by hydrolysis or oxidation of the sample during storage or testing. In addition, we calculated the branching degree by measuring the peak area variation of the N–H directly linked through the substituted amino group, and the branching degrees for PY1–PY3 were calculated to be 46.5% and 53.7%, respectively, which are higher than that of PY0.
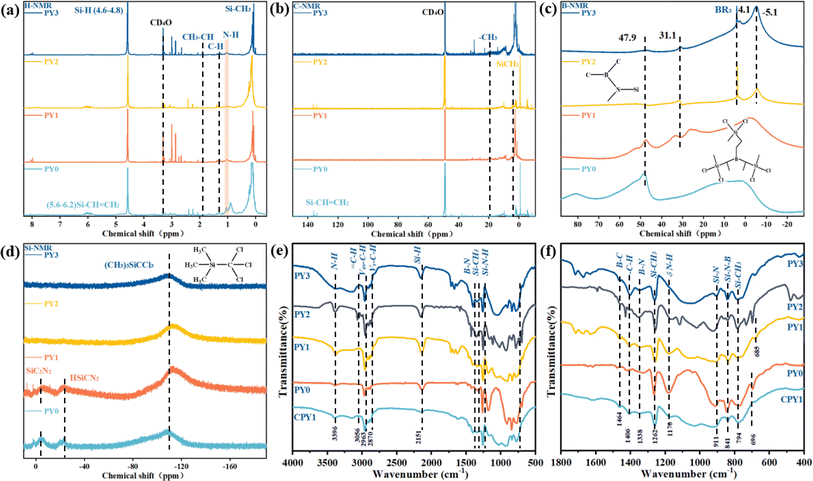 | ||
| Fig. 1 The (a) 1H NMR spectrum, (b) 13C NMR spectrum, (c) 11B NMR spectrum, (d) 29Si NMR spectrum. (e and f) FT-IR spectra of PY0–PY3. | ||
The FT-IR spectra of PY0, PY1, PY2, PY3 and CPY1 are shown in Fig. 1e and f. The stretching vibration peaks of –C–H appeared in the range of 3300–2700 cm−1 for all four samples, with unsaturated C–H (ν = C–H) bonding at 3056 cm−1, saturated –C–H bonding at 2963 and 2870 cm−1, and the methylene (–CH2–) structure at 2906 cm−1 with a continuous low-absorption peak. The peaks at 1406 cm−1, 1338 cm−1, 1262 cm−1 are attributed to the B–N stretching vibration, the C–N stretching vibration, and the Si–CH3 bending deformation vibration, respectively.
The N–H stretching vibration peak is at 3396 cm−1, while the absorption peak located at 1170 cm−1 is generated by the interaction between the N–H bending vibration and the C–N stretching vibration. Additionally, the B–C absorption peak is located at 1464 cm−1 and the Si–N stretching vibration peak at 911 cm−1. In addition, the Si–H bonds located at 2151 cm−1 of the Y-branched PBSZ samples are all enhanced compared to that of PBSZ. Comparing the infrared absorption spectra of the polymers and products, it can be seen that the Y element enters into the main chain of the polymer through the amination reaction and generates N–Y bonding. The doping of Y into the main chain greatly promotes the polymerization of the polymer, and the N–H bonding absorption band in the range of 3500–3100 cm−1 is formed by the linkage of Y to form an obvious N–H at 3396 cm−1, and both the saturated and unsaturated C–H absorption peaks are enhanced in the range of 3300–2700 cm−1. The saturated and unsaturated C–H absorption peaks in the range of 3300–2700 cm−1 increase, and the absorption peaks of various –Si and –N in the range of 1400–800 cm−1 also increase, indicating that Y enters into the polymer backbone and has a positive effect on polymerization. In the CPY1 sample, the crosslinking and curing significantly weaken the intensity of N–H (3396 cm−1 and 1170 cm−1) and Si–H (2151 cm−1) absorption peaks, and dehydrocoupling and transamination processes have occurred, during which the molecules are cross-linked and formed a network structure, resulting in a more compact molecular configuration.
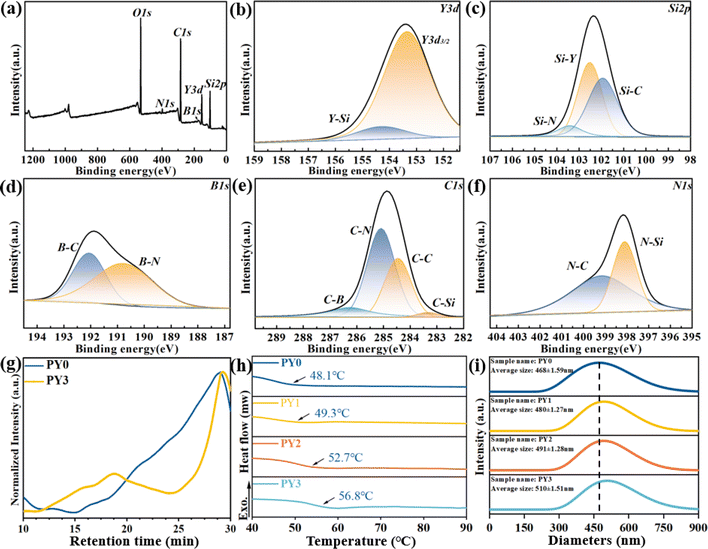
Fig. 2 shows the XPS spectra of PY3. Fig. 2a shows the full-spectrum curves of XPS, including the Y 3d, Si 2p, B 1s, C 1s and N 1s peaks. The Y 3d spectrum is fitted in Fig. 2b. It can be divided into the Y–Si peak at 154.30 eV and Y 3d3/2 at 153.4 eV. Similarly, Si 2p can be spilt into Si–C at 103.94 eV, Si–Y at 102.52 eV and Si–N at 103.42 eV as shown in Fig. 2c. The B 1s spectrum can be divided into B.E. = 190.75 eV for B–N bonds and 192.05 eV for B–C bonds as shown in Fig. 2d. The spectrum in Fig. 2e can be deconvoluted into four peaks with B.E. = 283.33 eV for C–Si bonds, 284.46 eV for C–C bonds, 285.09 eV for C–N bonds, and 286.26 eV for C–B bonds. The N 1s spectrum in Fig. 2f fitted with B.E. = 398.13 eV for the N–Si bond and 399.17 eV for the N–C bond. The orbital peaks of the five elements, Si, B, C, N, and Y, can be clearly observed in the XPS results, and due to the low content of the B element, the noise is more obvious in the maps. Compared with the PBSZ sample, the intensity of the N peak in the PBSZY sample is obviously decreased. The structural analysis further verifies that PBSZ can be stably bonded with a Y branched chain to form PBSZY.
The GPC data of PY0 and PY3 are shown in Fig. 2g, the number average molecular weights (Mn) of PY0 and PY3 are 18![[thin space (1/6-em)]](https://www.rsc.org/images/entities/char_2009.gif) 320 and 25
320 and 25![[thin space (1/6-em)]](https://www.rsc.org/images/entities/char_2009.gif) 797, and the PDI (Mw/Mn) of PY0 and PY3 is 1.01 and 7.10. It can be seen from Fig. 2h that as the Y-branching degree increases, the glass transition temperature (Tg) increased from 48.1 °C (PY0) to 56.8 °C (PY3), indicating that the mobility of the molecular chain segments from PY0 to PY3 decreases continuously at room temperature. This suggests that the PY3 molecular chain is more rigid at room temperature due to the effects of enhanced intramolecular hydrogen bonding interactions by branched chains. Fig. 2i shows that the particle size distribution of the PY0–PY3 samples ranged from 330 to 650 nm, and the average particle sizes of the PY0–PY3 samples were 468, 480, 491, and 510 nm, respectively, which suggests that PY3 is capable of forming a more stable cluster structure with a larger particle size.
797, and the PDI (Mw/Mn) of PY0 and PY3 is 1.01 and 7.10. It can be seen from Fig. 2h that as the Y-branching degree increases, the glass transition temperature (Tg) increased from 48.1 °C (PY0) to 56.8 °C (PY3), indicating that the mobility of the molecular chain segments from PY0 to PY3 decreases continuously at room temperature. This suggests that the PY3 molecular chain is more rigid at room temperature due to the effects of enhanced intramolecular hydrogen bonding interactions by branched chains. Fig. 2i shows that the particle size distribution of the PY0–PY3 samples ranged from 330 to 650 nm, and the average particle sizes of the PY0–PY3 samples were 468, 480, 491, and 510 nm, respectively, which suggests that PY3 is capable of forming a more stable cluster structure with a larger particle size.
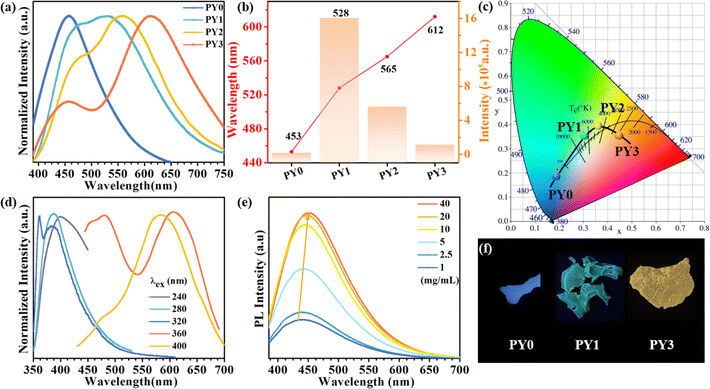
Fig. 3a exhibits the luminescence properties of polymers PY0, PY1, PY2 and PY3 with different Y contents. Under 365 nm excitation, PY0 show a blue emission centered at 450 nm. Significantly, new long wavelength emission bands emerged when introducing Y-branch chains. As the Y-branching degree increases, the emerged emission peak gradually shifts from 528 nm to 565 nm and 612 nm. Moreover, it is also found that the relative intensity of blue emission at around 450 nm compared to that of long wavelength emission gradually decreases with the increase in branching degree. In order to visualize the change in fluorescence color, the CIE coordinates of PY0, PY1, PY2, and PY3 samples were calculated (Fig. 3c), and the practical sample photos are shown in Fig. 3b. Obviously, the luminescence intensity of samples gradually changes from dark blue (0.19, 0.21) to near white (0.30, 0.37) and (0.34, 0.40) to orange (0.43, 0.36) as the degree of Y branching increases. The PL spectra of sample PY3 at different excitation wavelengths (λex) are shown in Fig. 3d. The emission wavelength (λem) of the sample shows a significant red shift with increasing λex, exhibiting excitation-dependent emission (EDE) behavior and multicolor emission properties. This EDE behavior indicates that multiple luminescent centers may exist in the polymer structure, and the long-wavelength emission peaks located at around 523–610 nm come from certain structures other than a single amino level, which are likely to be different size fluorescent clusters formed by molecular chain aggregation. Subsequently, we investigated the emission spectra of PY3 in DMF solutions with different concentrations. As shown in Fig. 3e, as the concentration of PY3 increases, the fluorescence intensity increases and the emission peak shifts from 432 nm to 452 nm, which is similar to the AIE effect. Afterwards, the CL intensity versus concentration change curve is shown in Fig. S1.† With the increase in PY3 concentration, the PL intensity curve displays three phases, in which the first inflection point corresponds to the imminent attainment of the critical concentration for saturated cluster formation (the slopes of the two curves before and after, K1 and K2, were 3.27 and 0.26, respectively), after which the resistance to further cluster aggregation increased until the critical concentration for saturated cluster formation was reached, at which time there is no significant change in luminescence intensity with increasing concentration. So in PY1–3 samples, the flexible carbon chains contribute to aggregation, and the rigid skeleton facilitates the restriction of intramolecular rotations and vibrations, all of which inhibit the nonradiative leaps of PBSZ and enhance its fluorescence properties. Intriguingly, the emission wavelength of the polymers is positively correlated with the cluster size. The PY3 solid shows a remarkable yellow-orange (612 nm) CL, the highest among the current non-conjugated dendritic polymer luminescent materials.
The above results demonstrate that the PBSZ NCPLs are able to achieve long-wavelength emission through branching modulation. In order to investigate the relationship between the luminescence center and the corresponding emission wavelength, the dynamics of the radiative excursion spectra of PY3 with respect to time using TRPL were tested. Fig. 4a presents the transient fluorescence decay curves of PY3 at different emission wavelengths, which are fitted by using the equation  where B1, B2 and B3 are the fractional contributions to the time-resolved lifetimes of τ1, τ2 and τ3, respectively. It is found that the fluorescence decay curve exhibits multi-exponential decay. The average fluorescence lifetimes (τavg) of PY3 at different emission wavelengths were calculated by using the following equation:
  The average values of τ for PY3 at 450, 580, and 700 nm are 4.23, 5.79, and 5.47 ns, respectively. Based on the excitation-dependent and multiexponential decay properties, it can be inferred that there are multiple luminescent centers in sample PY3. In addition, the dominant emission peaks of its TPRL spectrum can be clearly seen from Fig. 4b, which are located near 460 and 600 nm, respectively. And it is evident that the dominant emission peak of the TRPL spectrum of PY3 is consistent with the PL spectral lines as the irradiation time increases, which suggests that the emission of PY3 originates from the joint action of different-sized fluorescent clusters. In order to reveal the luminescence mechanism of PBSZY with multiple luminescent centers, Gaussian fitting peak splitting was performed on the emission spectral curves of PY0, PY1, PY2 and PY3, and they are shown in Fig. 4c.
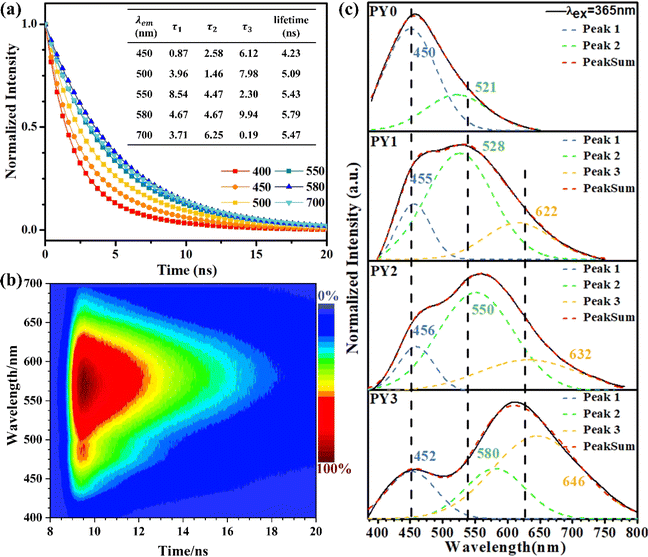 | ||
| Fig. 4 (a) Fluorescence decay curve of PY3 at an excitation wavelength of 375 nm. (b) TRPL of PY3. (c) Gaussian fitted peak curves of the emission spectra of PYx (x = 0, 1, 2 and 3). | ||
As shown in Fig. 4c, the fluorescence spectra of PY0–PY3 samples were each fitted with a Gaussian. The results show that PY0 exhibits blue (peak 1) and green (peak 2) emission peaks at 450 and 521 nm, respectively. Interestingly, after the introduction of the Y element, red (peak 3) emission peaks located at around 632 nm appeared in the PY1–PY3 samples, and these three fitted peaks can be found to correspond to the three luminescent centers of PBSZY in combination with Fig. 4a. The relative intensity ratio of peak 1 to 2 decreases from 2.94 to 0.46 in PY0–PY2, and the intensity ratio of peak 3 to 2 increases from 0 to 1.67 in PY0–PY3 with increasing Y content. This suggests that the increase in branching degree leads to the accumulation of these clusters and restricts the molecular motions and non-radiative leaping pathways, resulting in the increasing intensity of the corresponding long-wavelength emission peaks. It is noteworthy that, except for peak 1, the other two fitted peaks are accompanied by a certain redshift phenomenon, which verifies our observation that the emission wavelengths of polymers are positively correlated with the cluster sizes. Combined with the fact that PY3 also shows an EDE effect, we conclude that this long-wavelength emission originates from a structure other than the PBSZ monomer, which is most likely an aggregate of Y-branched PBSZ, i.e., the PBSZY unit cluster. From Fig. 2g, it can be found that PY0 and PY3 have an identical molecular peak, while PY3 also contains a type of PBSZY whose molecular weight is much larger than that of PBSZ. The above results suggest that too flexible or rigid chains are not favorable for cluster formation in the polymer system. Therefore, the key to promoting CL is to regulate the flexibility and rigidity of molecular chains, since flexibility provides structural mobility for cluster formation, while rigidity helps to stabilize the formed clusters. Compared with PY0, which is too rigid to have EDE and CL effects, PY3 contains Y-branched PBSZ macromolecules with larger molecular weights due to terminal grafting, which can effectively enhance the contact sites between molecular chains and facilitate cluster formation.
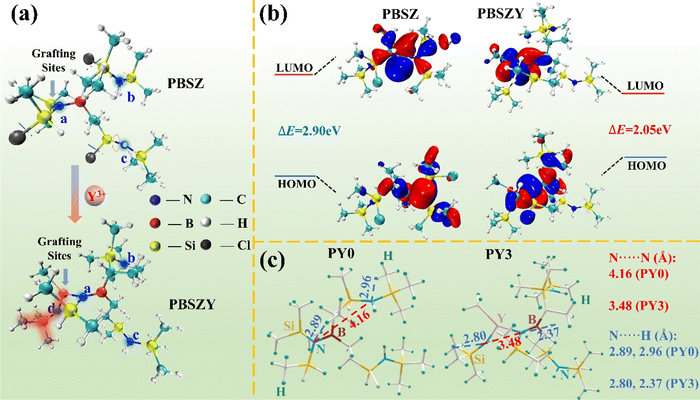
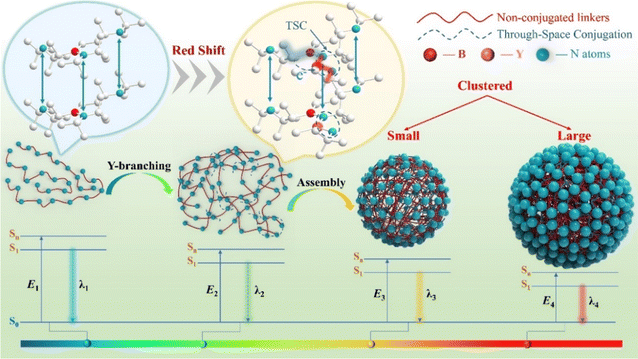
In order to elucidate the unusual ultra-long emission wavelength fluorescence mechanism of PYx, the electron cloud distribution and intramolecular electronic communication in polyborosilazane and its branching structure were calculated based on DFT using the Gaussian 09 program package. Fig. 5a shows the molecular conformation of PBSZ before and after Y-branching; from the top side of the diagram, we can see that a, b, and c are nitrogen atoms, where the nitrogen atoms on the B–N bond line provide grafting sites for the addition of Y atoms, and the red halo part of the bottom side of the diagram is the newly accessed Y-branching chain. At the same time, the side chains to c and b have some rotation. The calculated HOMO and LUMO energy levels of PY0 and PY3 are shown in Fig. 5b. The results show that the HOMO energy levels of PY0 are mainly distributed in the center of the B–N bond and the connecting lines of the adjacent N–Si–C branched chains, while the LUMO energy levels are mainly concentrated in the C–B–N central unit of each polymer molecule. The energy gap between the HOMO and LUMO of PY0 is 2.90 eV. For PY3, the distribution of the HOMO and LUMO energy levels is significantly different from those in PY0. The HOMO energy level extends to the adjacent groups centered on the B–N bond, whereas the LUMO energy level is distributed on the Y atom, its adjacent N atom and the methyl group. Apparently, the binding of a Y atom to polyborosilazane forces a redistribution of electron density, shifting electrons from the C–B–N backbone to the Y branched chain, leaving the B–N central unit as an electron deficient region (i.e., LUMO). The excited state of the single heavy state of individual polymer molecules has been optimized based on TD-DFT in the software. The calculation in Table 1 shows that the LUMO and HOMO energy levels of PY3 increase from −1.46 and −4.31 eV to −1.19 and −3.24 eV, respectively, compared to PY0, and the corresponding energy gap (Egap) decreases from 2.90 to 2.05 eV. As shown in Fig. 4c, the short-wavelength emission peaks of PY0 to PY3 are located at 521, 528, 550, and 580 nm, respectively, which are in good agreement with the calculated Egap trends. Based on the results, it is further confirmed that the long-wave emission (646 nm) of PY3 originates from a more stable cluster structure; formed by PBSZ with a branched structure. On the other hand, these results also support that the emission peaks located at 420–460 nm originate from the electron leaps of the monomer (Fig. 7a and b).
| Molecule number | E LUMO (eV) | E HOMO (eV) | E gap (eV) |
|---|---|---|---|
| PY0 | −1.41 | −4.31 | 2.90 |
| PY3 | −1.19 | −3.24 | 2.05 |
Fig. 5c diaplays the optimized conformation of PY0 and PY3 at the B3LYP/6-311G(d,p) level for single-chain polymers. The conventional light-emitting chromophore and conjugation unit do not exist in the molecular structure of PY0, and although the presence of nitrogen atoms leads to (n–σ*) electron leaps, the leap energies are too high to emit visible light. Meanwhile, there are short N⋯H distances in PY0 and PY3, the shortest of which is below 2.37 Å, suggesting hydrogen bonding interactions. Correspondingly, influenced by hydrogen bonding, intramolecular nitrogen atoms aggregate to form heteroatomic off-domains, with a distance of 4.16 Å between nitrogen atoms in PY0, whereas in PY3 most of the nitrogen atoms are separated by a distance of about 3.48 Å, which is much closer to twice the van der Waals radius (d0) of nitrogen atoms of 3.10 Å (rB: 1.55 Å; rp: 1.50 Å). The calculations show that there are different degrees of spatial conjugation in both PY0 and PY3, and the degree of conjugation in PY3 is much larger than that in PY0. In this case, further overlap of the electron cloud of the nitrogen atom leads to splitting and coupling, generating new molecular orbitals with smaller energy gaps, which can lead to the long wavelength emission of the absorption spectra. This is due to the fact that hyperbranched PBSZ macromolecules have a large number of N atoms containing lone-pair of electrons, which can form a new branching structure with Y atoms, thus obtaining polymers with non-conjugated alkyl groups as main chains and functional groups as side chains. By regulating the electronic structure and aggregation state of the polymer through adjusting the concentration of side chains, the HOMO–LUMO band gap and the degree of electron cloud conjugation can be changed, thus realizing the tunability of the luminescence wavelength of polyborosilazane.
The luminescence mechanism diagram of Y-branched PBSZ clusters is illustrated in Fig. 6. As can be seen from the figure, the Egap from Sn/S1 to S0 gradually decreases from the PBSZ monomer to PBSZY after “end-grafting” and then to the cluster state, and the energy gap further decreases with the increase in cluster size. It is noteworthy that the blue light emission in PBSZ comes from the isolated “n” or “p” electrons in the heteroatoms (e.g., N atoms); when the branched structure is introduced, the distance between the heteroatoms in PBSZY decreases due to the influence of hydrogen bonding and other weak interacting forces, resulting in TSC and decreasing the energy gap. In addition to the entanglement of chain segments caused by the branched structure, temperature and concentration are the secondary driving forces for the formation of emissive aggregates. As a result, PY3 can form more stable clusters and show longer emission λmax in the solid state.
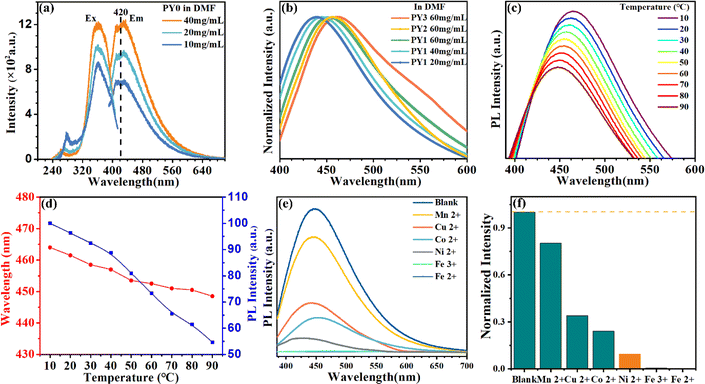
To further confirm that the emerged long-wavelength emission of PY1–PY3 comes from PBSZY clusters, cluster formation using fluorescence analysis based on CL changes was explored. First, the effect of concentration on the emission properties of PY0 without a dendrimer structure can be observed in Fig. 7a. It can be found that as the concentration of PY0 in DMF solution increases, only the emission intensity changes, but no peak position changes (stabilizes at 420 nm), which indicates that it is difficult for PY0 to form a stable cluster emission group to effectively modulate the emission spectra. For this reason, we measured the fluorescence spectra of different concentrations of PY1–PY3 DMF solutions. As shown in Fig. 7b, the emission peaks of PY1–PY3 in DMF solutions are located between 437 and 463 nm. Notably, these peaks exhibit a gradual redshift as the concentration increases from 20 to 60 mg mL−1. PY1 and PY2 in DMF solutions at varying concentrations display a similar trend, as illustrated in Fig. S2,† highlighting the concentration-dependent emission (CDE) characteristics of PBSZY. Aggregation-inducing effects (AIEs) may become significant as polymer chains come into close proximity to each other, especially in dendritic polymers. In addition, at high concentrations, the emission peaks of PY1–PY3 DMF solutions were located at 452, 456 and 463 nm, respectively, suggesting that the degree of polymer branching and the increase in solution concentration lead to the emission redshift phenomenon, which shows that the emission wavelengths in the range of 437–463 nm originated from the electronic leaps of amino groups (or fragments) in the polymer single chain, and this result also supports the fact that the long-wavelength emission of PY1–PY3 (530–646 nm) originates from PBSZY clusters; the emission peaks of PY0 and PY1 at the same concentration are located at 420 nm and 437 nm, respectively. In our experiments, we observed that the emission peaks of different samples (e.g., PY0 and PY1) are gradually red-shifted with increasing branching degree. This is in good agreement with the trends of the energy gaps of PBSZ and PBSZY obtained from calculations (EPBSZ = 2.90 eV and EPBSZY = 2.0 eV). The introduction of a branched chain has a significant effect on the electronic structure of the molecule. The charge distribution in the chain segments of the PBSZ molecule can be altered by branching at the Y-terminal site. The addition of branched chains deviates the charge distribution within the molecule, which affects the orbital energy levels and leads to a decrease in the energy gap, thereby causing the red-shift of the emission spectrum. With the increase in solution concentration, the distance between molecules decreases and the molecular chains can form hydrogen bonds through weak interactions. Since PBSZ molecules are more likely to aggregate and form clusters when the solution concentration increases, this leads to the further overlapping of electron clouds of nitrogen atoms on different chain segments, and creates new molecular orbitals with smaller energy gaps.
In order to further demonstrate the proposed process of fluorescence cluster formation, we have also investigated the temperature dependent PL spectra of PY3. The temperature-dependent liquid PL spectra of PY3 in Fig. 7c show that in the range of 10–90 °C, the emission intensity decreases with increasing temperature and the emission peaks gradually blue shift. Moreover, the process of emission intensity change involves two stages. When the temperature is below 40 °C, the weakening of emission intensity is relatively lower because the dispersed resistance of saturated clusters in solution is high until the large cluster structure disappears. After that, as the temperature continues to increase, the tendency of decreasing the luminous intensity increases. This also corresponds to the cluster formation process we mentioned earlier. The results also imply that the cluster structure is susceptible to the polymer conformation, which affects the arrangement of the ester units and changes the band gap of the ester clusters, especially in concentrated solutions.
It has been reported that the fluorescence of various NCPLs can be attenuated or even quenched by metal ions. In order to test the role that PY3 can play in metal ion detection, the fluorescence properties of PY3 solutions in the presence of different metal ions were investigated. First, DMF solution of metal ions (0.1 mol mL−1) and DMF solution of PY3 (20 mg mL−1) were prepared, then 0.01 mL of each metal ion solution was added to 0.95 mL of PY3 solution, and the emission spectra were measured under 365 nm UV lamp excitation after 8 h standing time. Fig. 7e shows the PL spectrum of PY3 in DMF solution containing 1 mM metal ions. It was observed that the fluorescence intensity decreased after the addition of metal ions (Cu2+, Co2+, Ni2+, Fe3+, and Fe2+), which was particularly evident after the addition of Fe3+ and Fe2+. Therefore, visual identification and detection of metal ions (Fe2+) can be achieved based on the colour change. Among the metal ions mentioned above, Fe3+ has the largest charge/radius ratio and can bind to the abundant N atoms in the molecular structure of PY3, causing the destruction of the clusters associated with TSC in solution and leading to fluorescence burst.
Fig. 8 summarizes the typical NCPLs in terms of emission bandwidths reported in recent literature,17–23,25–40,44–50 including hyperbranched polysiloxane (HPSO), hyperbranched polyborate (HPBO), hyperbranched polyesters (HPE), and hyperbranched polyborosiloxanes (HPBSO). It can be seen that organic resin is widely used as a fluorescent material. Promoting spatial conjugation through enhanced intermolecular interactions is the main way to achieve spectral modulation. Using “side-chain engineering” to realize spatial interactions between main chains and side chains is another way to improve the emission bandwidth. The emission bandwidths in the literature are generally larger than 150 nm, and a few can reach 300 nm, which still makes it difficult to achieve visible coverage. In this study, the emission bands of the obtained PY3 samples cover the visible region from 400 to 750 nm, which is higher than most of the literature values. The excellent broad wavelength tunability of PBSZY demonstrates the key role of the Y branched chains in PBSZ, and the balance of molecular flexibility achieved by the introduction of branched structures can be used to modulate the emission peaks of the polymers to achieve broad wavelength coverage.
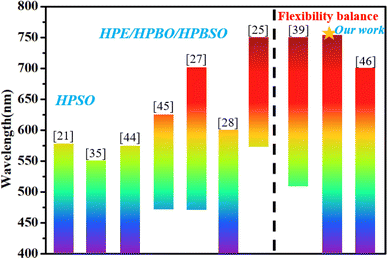 | ||
| Fig. 8 Emission bandwidths of NCPLs reported in recent literature (those marked with an asterisk are our studies). | ||
Conclusion
In summary, we have successfully synthesized novel non-conjugated and non-aromatic fluorescent Y-branched PBSZ with tunable colors via a two-step polymerization method. By balancing the flexibility and rigidity of the polymer chain segments by modulating the degree of Y-branching, PY3 was obtained and exhibits an ultra-broad emission spectrum (400–750 nm). Experimental and computational results show that the balancing effect of Y-branched chains on molecular flexibility, as well as TSC due to stronger intermolecular hydrogen bonding, plays a crucial role in the long-wavelength emission. This also demonstrates the effectiveness of the yttrium “end-grafting” strategy in achieving multicolor luminescence from non-conjugated polymers. Meanwhile, the obtained polymers all exhibit excellent CDE and EDE behavior, making them promising materials for various advanced electronic and optoelectronic devices.Data availability
The data supporting this article have been included as part of the ESI.† The data that support the findings of this study are available from the corresponding author upon reasonable request.Author contributions
Conceptualization: Yingli Zhu. Funding acquisition: Xiangcheng Li. Methodology: Yuang Li and Pingan Chen. Investigation: Yuang Li and Yingli Zhu. Supervision: Yingli Zhu. Writing-original draft: Yuang Li. Writing-review & editing: Yingli Zhu and Xiangcheng Li.Conflicts of interest
The authors declare that they have no known competing financial interests or personal relationships that could have appeared to influence the work reported in this paper.Acknowledgements
This work was supported by the National Natural Science Foundation of China (Grant No. 52304410 and 51972242), the Major Project of Hubei Province (Functional coating and materials, 2023BAA003), the Young Top-notch Talent Cultivation Program of Hubei Province and “the 14th Five Year Plan” Hubei Provincial advantaged characteristic disciplines (groups) project of Wuhan University of Science and Technology (2023A0504).Notes and references
- M. Fang, J. Yang and Z. Li, Procedia Mater. Sci., 2022, 125, 100914 CrossRef.
- X. S. Liu, Z. Tang, Z. Li, M. Li, L. Xu and L. Liu, Nat. Commun., 2021, 12, 7298 CrossRef CAS PubMed.
- B. Lei, Z. Huang, S. Li, J. Liu, Z. Bin and J. You, Angew. Chem., Int. Ed., 2023, 135, e202218405 CrossRef.
- G. Chen, J. Wang, W. C. Chen, Y. Gong, N. Zhuang, H. Liang, L. Xing, Y. Liu, S. Ji, H. L. Zhang, Z. Zhao, Y. Huo and B. Z. Tang, Adv. Funct. Mater., 2023, 33, 2211893 CrossRef CAS.
- Z. Guo, C. Yan and W. H. Zhu, Angew. Chem., Int. Ed., 2020, 59, 9812–9825 CrossRef CAS.
- J. Li, J. Wang, H. Li, N. Song, D. Wang and B. Z. Tang, Chem. Soc. Rev., 2020, 49, 1144–1172 RSC.
- J. Zhang, B. He, Y. Hu, P. Alam, H. Zhang, J. W. Y. Lam and B. Z. Tang, Adv. Mater., 2021, 33, 2008071 CrossRef CAS.
- K. Wang, J. Liu, P. Liu, D. Wang, T. Han and B. Z. Tang, J. Am. Chem. Soc., 2023, 145, 4208–4220 CrossRef CAS.
- X. Li, Z. Li and Y. W. Yang, Adv. Mater., 2018, 30, 1800177 CrossRef.
- Y. Zhang, G. Li, L. Wang, T. Huang, J. Wei, G. Meng, X. Wang, X. Zeng, D. Zhang and L. Duan, Angew. Chem., Int. Ed., 2022, 61, e202202380 CrossRef CAS.
- H. J. Kim and T. Yasuda, Adv. Opt. Mater., 2022, 10, 2201714 CrossRef CAS.
- R. Hu, N. L. C. Leung and B. Z. Tang, Chem. Soc. Rev., 2014, 43, 4494–4562 RSC.
- H. Zhang, Z. Zhao, P. R. McGonigal, R. Ye, S. Liu, J. W. Y. Lam, R. T. K. Kwok, W. Z. Yuan, J. Xie, A. L. Rogach and B. Z. Tang, Mater. Today, 2020, 32, 275–292 CrossRef CAS.
- Z. Zhao, H. Zhang, J. W. Y. Lam and B. Z. Tang, Angew. Chem., Int. Ed., 2020, 59, 9888–9907 CrossRef CAS PubMed.
- J. Mei, N. L. C. Leung, R. T. K. Kwok, J. W. Y. Lam and B. Z. Tang, Chem. Rev., 2015, 115, 11718–11940 CrossRef CAS.
- W. Zhao, Z. He and B. Z. Tang, Nat. Rev. Mater., 2020, 5, 869–885 CrossRef CAS.
- W. Luo, H. Yu, Z. Liu, R. Ou, C. Guo, l. Tao and J. Zhang, J. Mater. Res. Technol., 2022, 19, 1699–1710 CrossRef CAS.
- Y. Zhao, J. Long, P. Zhuang, Y. Ji, C. He and H. Wang, J. Mater. Chem. C, 2022, 10, 1010–1016 RSC.
- L. Shao, K. Wan, H. Wang, Y. Cui, C. Zhao, J. Lu, X. Li, L. Chen, X. Cui, X. Wang, X. Deng, X. Shi and Y. Wu, Biomater. Sci., 2019, 7, 3016–3024 RSC.
- Z. Zhou, X. Chen, Y. Wang, C. Hu, T. Li, S. Wang, W. Dong and J. Qiao, ACS Macro Lett., 2023, 12, 1523–1529 CrossRef CAS PubMed.
- Y. Feng, T. Bai, H. Yan, F. Ding, L. Bai and W. Feng, Macromolecules, 2019, 52, 3075–3082 CrossRef CAS.
- F. Kausar, Z. Zhao, T. Yang, W. Hou, Y. Li, Y. Zhang and W. Z. Yuan, Macromol. Rapid Commun., 2021, 42, 2100036 CrossRef.
- J. Sun, Y. L. Hong, X. Q. Fang, C. Wang and C. M. Liu, J. Mater. Chem. C, 2023, 11, 1927–1936 RSC.
- Y. Joo, V. Agarkar, S. H. Sung, B. M. Savoie and B. W. Boudouris, Science, 2018, 359, 1391–1395 CrossRef PubMed.
- Y. He, W. Feng, Y. Qiao, Z. Tian, B. Z. Tang and H. Yan, Angew. Chem., Int. Ed., 2023, 62, e202312571 CrossRef.
- L. Gao, Y. Zhang, X. Chen, Y. Zheng, X. Zheng, C. Wang, Z. Wang, J. Hao, Q. Tian, X. Yu, C. Yang, Y. Li and Y. Zhao, Adv. Opt. Mater., 2021, 9, 2101284 CrossRef.
- B. Chu, H. Zhang, L. Hu, B. Liu, C. Zhang, X. Zhang and B. Z. Tang, Angew. Chem., Int. Ed., 2021, 134, e202114117 CrossRef.
- L. Guo, L. Yan, Y. He, W. Feng, Y. Zhao, B. Z. Tang and H. Yan, Angew. Chem., Int. Ed., 2022, 61, e202204383 CrossRef.
- J. Deng, Y. Bai, J. Li, J. Jiang, C. Zhao, W. Xie, Y. Guo, H. Liu, D. Liu, L. Yu and H. Wang, Adv. Opt. Mater., 2023, 2300715 CrossRef.
- X. Ji, W. Tian, K. Jin, H. Diao, X. Huang, G. Song and J. Zhang, Nat. Commun., 2022, 13, 3717 CrossRef.
- Z. Zhang, Z. Xiong, B. Chu, Z. Zhang, Y. Xie, L. Wang, J. Z. Sun, H. Zhang, X. H. Zhang and B. Z. Tang, Aggregate, 2022, 3, e278 CrossRef.
- S. Tang, Z. Zhao, T. Yang, Y. Wang, X. Chen and W. Z. Yuan, Angew. Chem., 2021, 134, e202117368 CrossRef.
- Z. Pan, H. Gao, Y. Yang, Q. Zou, D. Peng, P. Yang, J. Cai, J. Qian, J. Li, C. Yin, N. Wang, R. Li, J. Wang and W. Huang, J. Energy Chem., 2022, 69, 123–131 CrossRef.
- C. L. Chang, W. C. Lin, L. Y. Ting, C. H. Shih, S. Y. Chen, T. F. Huang, H. Tateno, J. Jayakumar, W. Y. Jao, C. W. Tai, C. Y. Chu, C. W. Chen, C. H. Yu, Y. J. Lu, C. C. Hu, A. M. Elewa, T. Mochizuki and H. H. Chou, Nat. Commun., 2022, 13, 5460 CrossRef.
- Y. Du, Y. Liu, J. Li, Y. He, Y. Li and H. Yan, Small, 2023, 2302095 CrossRef.
- Y. Yao, Z. Xu, B. Liu, M. Xiao, J. Yang and W. Liu, Adv. Funct. Mater., 2020, 31, 2006944 CrossRef.
- S. Song, Y. Zhao, M. Kang, Z. Zhang, Q. Wu, S. Fu, Y. Li, H. Wen, D. Wang and B. Z. Tang, Adv. Funct. Mater., 2021, 31, 2107545 CrossRef.
- X. Li, Q. Gao, J. Wang, Y. Chen, Z. H. Chen, H. S. Xu, W. Tang, K. Leng, G. H. Ning, J. Wu, Q. H. Xu, S. Y. Quek, Y. Lu and K. P. Loh, Nat. Commun., 2018, 9, 2335 CrossRef PubMed.
- C. Y. Shi, D. D. He, B. S. Wang, Q. Zhang, H. Tian and D. H. Qu, Angew. Chem., Int. Ed., 2022, 135, e202214422 CrossRef.
- J. Zhang, P. Alam, S. Zhang, H. Shen, L. Hu, H. H. Y. Sung, I. D. Williams, J. Sun, J. W. Y. Lam, H. Zhang and B. Z. Tang, Nat. Commun., 2022, 13, 3492 CrossRef PubMed.
- J. Kong, M. Wang, J. Zou and L. An, ACS Appl. Mater. Interfaces, 2015, 7, 6733–6744 CrossRef.
- B. Liu, H. Zhang, S. Liu, J. Sun, X. Zhang and B. Z. Tang, Mater. Horiz., 2020, 7, 987–998 RSC.
- C. Wang, P. Chen, X. Li, Y. Zhu and B. Zhu, ACS Appl. Mater. Interfaces, 2021, 13, 55440 CrossRef PubMed.
- L. Bai, H. Yan, T. Bai, L. Guo, T. Lu, Y. Zhao and C. Li, Biomacromolecules, 2020, 21, 3724–3735 CrossRef PubMed.
- L. Bai, P. Yang, L. Guo, S. Liu and H. Yan, Biomacromolecules, 2022, 23, 1041–1051 CrossRef.
- S. Zheng, T. Zhu, Y. Wang, T. Yang and W. Z. Yuan, Angew. Chem., Int. Ed., 2020, 59, 10018–10022 CrossRef.
- L. Q. Reyes, J. Zhang, B. Dao and D. L. Nguyen, J. Appl. Polym. Sci., 2020, 137, 48874 CrossRef.
- R. Xie, A. R. Weisen, Y. Lee, M. A. Aplan, A. M. Fenton, A. E. Masucci, F. Kempe, M. Sommer and C. W. Pester, Nat. Commun., 2020, 11, 893 CrossRef.
- W. Humphrey, A. Dalke, K. Schulten and J. Mole, Graphics, 1996, 14, 33–38 CrossRef.
- T. Lu and F. Chen, J. Comput. Chem., 2012, 33, 580–592 CrossRef.
Footnote |
| † Electronic supplementary information (ESI) available. See DOI: https://doi.org/10.1039/d4sc04320k |
| This journal is © The Royal Society of Chemistry 2024 |

