
 Open Access Article
 This Open Access Article is licensed under a Creative Commons Attribution-Non Commercial 3.0 Unported Licence
Insights into the photoinduced anion translocation of donor–π–acceptor+ (ion)− molecules†
Hao-Ting
Qu
 a,
Iida
Partanen
b,
Kai-Hsin
Chang
a,
Yan-Ding
Lin
a,
Igor O.
Koshevoy
*b,
Andrey
Belyaev
*bc and
Pi-Tai
Chou
*a
a,
Iida
Partanen
b,
Kai-Hsin
Chang
a,
Yan-Ding
Lin
a,
Igor O.
Koshevoy
*b,
Andrey
Belyaev
*bc and
Pi-Tai
Chou
*a
aDepartment of Chemistry, National Taiwan University, Taipei, 10617 Taiwan, Republic of China. E-mail: chop@ntu.edu.tw
bDepartment of Chemistry, University of Eastern Finland, Yliopistokatu 7, 80101 Joensuu, Finland. E-mail: igor.koshevoy@uef.fi; andrei.beliaev@uef.fi
cDepartment of Chemistry/Nanoscience Center, University of Jyväskylä, Survontie 9C, 40014 Jyväskylä, Finland. E-mail: andrei.a.beliaev@jyu.fi
First published on 7th November 2024
Abstract
By strategic design and synthesis of a new series of phosphonium salts (compounds 1–7[OTf]), where [OTf]− stands for the trifluoromethanesulfonate anion, we performed comprehensive spectroscopic and dynamic studies on the photoinduced anion migration in toluene. Our aim is to probe if the anion migration is associated with an intrinsic barrier or is barrier-free. After the occurrence of excited-state intramolecular charge transfer (ESICT) in 1–7, the charge redistribution of the cation triggers the translocation of the counter anion [OTf]−, resulting in emission spectral temporal evolution. As a result, we describe the photoinduced anion migration by introducing spectral response function C(t), a concept adopted from the solvent diffusional relaxation. The experimental results indicate that the anion migration lacks an intrinsic barrier, i.e., the relaxation dynamics can be described by a biased Brownian motion along the charge transfer direction. The experimental findings are also qualitatively supported by theoretical calculations including restrained electrostatic potential (RESP) and hole–electron distribution analyses.
Introduction
Rational design of molecular machines that can accomplish sophisticated work in the nano-micro scale is always a challenge. On the one hand, bionic machines that mimic biological systems have been one research direction.1,2 Specific stimulus–response behavior is conferred on them by their unique structural complexity. However, biological machines encounter instability and potential invalidation upon detachment from organisms.3,4 On the other hand, artificial molecular machines provide a solution to these limitations. Over 50 years of development,5 the well-established artificial molecular machines, for example, rotaxanes, have operated under various conditions such as in organic solvents6 and polymer solutions,7 on electrode surfaces,8 or even in the solid state.9 In light of the versatile operation environment, a great deal of applications have emerged.10–14Fundamentally, how the motion of molecular machines is controlled is always of top interest. In solution, the motion of molecules is complicated by the Brownian motion, so the imposition of a bias to change random mobility into a directional motion is a key.3,15,16 In view of chemistry, how to break the equilibrium and make the given elementary reaction step move forward are pivotal. Take the rotaxane molecular shuttle as an example, which comprises a thread with two stoppers on the two sides and an interlocked macrocycle binding to one of the stations along the thread.17,18 To extract effective work, the macrocycle in the stimuli–responsive molecular shuttles travels between two stations in response to external stimuli upon modifying the binding affinity of one of the stations. Aside from this, if the macrocycle originally accumulates at one of the identical stations and a compartment blocks the macrocycle shuttling between these two, once removing the barrier, the statistically unstable state would prompt the macrocycle to redistribute, and the overall reaction basically becomes irreversible.15,16 Both types of molecular shuttles relax from an unbalanced state into a stable one and perform monodirectional motion. After harnessing the direction of molecular shuttles, the following dynamic study on them is necessary. In this regard, steady-state absorption spectra,19 NMR spectra,20 cyclic voltammetry,8,9 transient infrared21 or UV-vis7,22 absorption spectra were adopted to monitor the conformation variation. For example, the hydrogen-bonded (H-bonded) molecular shuttles are a popular paradigm for quantifying the shuttle rate of a macrocycle by the time trace of a characteristic vibrational frequency shift21 or time-resolved transient absorption feature.22
In 2019, our team initiated a seminal study associated with photoinduced anion migration of a series of D–π–A+ (anion)− push–pull systems (see Scheme 1),23–26 where the electron acceptor is originally positively charged. In medium and high polar solvents, the salts exist as isolated ions with solvent shells surrounding the individual ions. In this scenario, excited-state intramolecular charge transfer (ESICT) shifts the electron density from the donor to the acceptor, altering the charge distribution. Fast solvent relaxation then takes place to stabilize the charge transfer state. In weakly polar solvents such as toluene or 1,4-dioxane, however, ion pairs are preferably formed due to poor solvent–solute interaction. Therefore, the role of stabilization switches from the surrounding solvent molecules to the counter anion. After ESICT, the positively charged acceptor receives the negative charge from the donor. The net result is to alleviate the coulombic interaction within the ion pair and allow the anion to translocate toward the donor site that becomes positively charged, in part, after ESICT. In the end, we achieve a directional anion shuttle from the electron acceptor to the donor site. Such an anion migration has been reported to be significantly slower than that of solvent relaxation. Therefore, broad and even multiple emissions can be observed along the time constant of anion migration. Upon relaxation to the ground state, an opposite directional shuttle should take place, achieving a reversible cycle of light induced anion migration (see Scheme 1). Ultimately, effective work in the excited state can only be extracted if the population decay lifetime is longer than the translocation time.27 Tuning the excited state lifetime is thus crucial for future applications of these molecular machines, which is not the focus of this study.
 | ||
| Scheme 1 The proposed photoinduced charge transfer associated with counter anion migration in weakly polar solvents. | ||
Upon establishing the anion migration mechanism, a crucial issue lies in the kinetics of anion migration. It would be of both interest and importance to know whether such an anion translocation is a mass transport process, or a process related to an intrinsic, i.e., a non-viscosity-induced, barrier. Also, if a barrier exists, could it be dependent on molecular structure, incorporating either the electron donor, the acceptor or even the bridge configuration? Aimed at answering these questions, in this study, we designed and synthesized a series of phosphonium triflate salts featuring certain electronic and structural modifications (Scheme 2). In view of chemical structure, we divide them into three groups. Group A involves the variation of the electron-donating properties of the amine fragment, while in group B the effect of the acceptor strength is probed. In group C, we alter the structure of the bridge to tune the dihedral angle within the biphenyl group by introducing a planarity-restricting substituent or ring closure. To simplify the approach, all D–π–A+ compounds are anchored with the same counter anion [OTf]− (trifluoromethanesulfonate),23 yielding compounds 1[OTf] to 7[OTf]. Although we have studied 2[OTf] in 2019,23 to ensure the completeness of the discussion regarding D/A electronic properties of these salts, we also include 2[OTf] in the results for the later discussion. Our previous studies of time-resolved emission spectra (TRES) of 2[OTf] have unveiled the continuous spectral temporal evolution of emission bands, but have not yet quantified the trend of translocation dynamics. Inspired by the similar red-shifted behavior in spectra caused by the solvent relaxation, we employ the spectral response function C(t), which is generally applied in solvatochromism studies, to extract valuable information regarding the dynamics of anion migration. To probe C(t), we perform comprehensive time-resolved analyses, focusing on the anion translocation rate, which is viscosity-dependent and temperature-dependent. The comprehensive experimental work, together with the computational approach on the electrostatic potential, lead us to conclude that the rate of photoinduced anion migration in 1–7 can be described as an ion-mobility dependent mass transport process28 caused by the change of the electric field. Details of results and discussion are elaborated in the following sections.
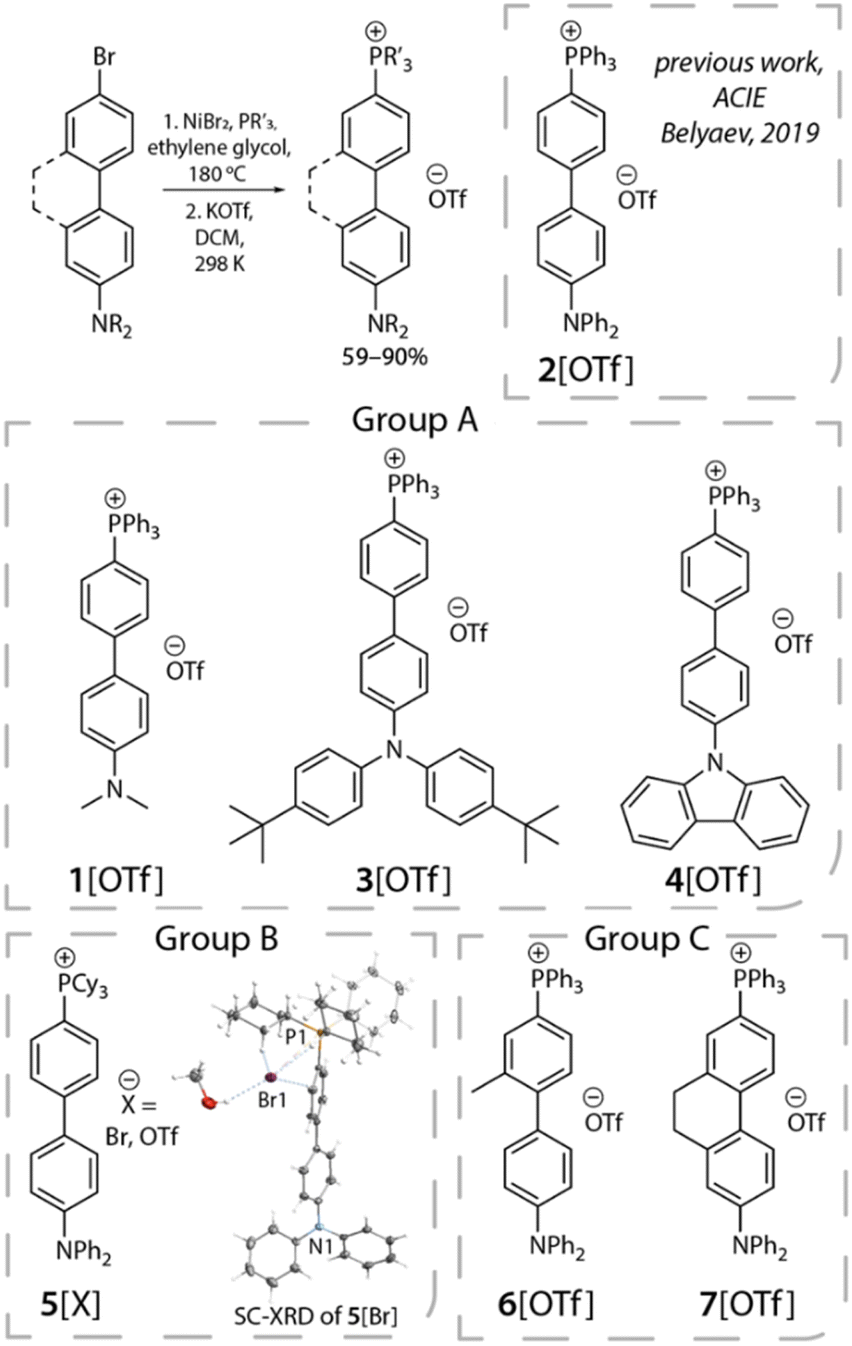 | ||
| Scheme 2 General synthetic approach to phosphonium salts 1–7[OTf] and their structure. Inset of group B shows the molecular view of 5[Br] obtained by SC-XRD. Thermal ellipsoids are shown at the 50% probability level. | ||
Results and discussion
Synthesis and characterization
Phosphonium salts 1–7[OTf] were synthesized via an NiBr2-catalyzed coupling arylation reaction between PPh3 or PCy3 and the corresponding donor-functionalized biphenyl bromide, followed by counterion metathesis with potassium triflate salt in dichloromethane (for more details, see the ESI†).29 All the phosphonium species were isolated in good yields (59–90%). The composition of the products was confirmed by 31P, 13C and 1H NMR spectra, which are compatible with the proposed structures and the presence of single species for each compound. The phosphorus resonances in CD2Cl2 appear in the narrow range of 23.3–23.8 ppm for 1–4, 6–7[OTf], and 29.9 ppm for 5[X] (X = Br, OTf). These chemical shifts are typical for other acyclic phosphonium compounds, which also reflect the accepting power of the cationic fragment.The molecular structure of 5[Br] was elucidated by SC-XRD analysis (Scheme 2 and Table S1†). The organic cation contains a twisted biphenyl fragment (torsion angle equals 21.4°), decorated by the diphenyl amine group and the phosphorus atom with nearly ideal tetrahedral geometry (∠C–P–C angles are between 107.8 and 108.6°, C–P bond lengths are 1.765–1.796 Å). The molecule represents a contact ion pair as a result of electrostatic attraction supported by a network of hydrogen bonds involving cyclohexyl fragments and Br counterions (H⋯Br distances fall in the range of 2.41–3.06 Å).
Photophysical steady-state spectroscopy
Fig. 1 shows the absorption and emission spectra of the studied salts in toluene, while those measured in other solvents are depicted in Fig. S2.† All pertinent steady-state data are listed in Tables 1 and S2.† In polar aprotic solvents (chloroform, dichloromethane, acetonitrile), the lowest lying absorption band undergoes a hypsochromic shift with increasing polarity. This phenomenon has been well-documented in numerous reports30–37 and is due to a larger dipole moment in the ground than that of the Franck–Condon excited state. The ESICT properties of 1–7 are manifested by the structureless and polarity-sensitive emission bands in terms of peak wavelength. This assignment is also supported by the hole–electron analysis,38 where hole and electron distributions are separated and located at the electron donor and acceptor (the phosphonium group), respectively (Fig. S14–S15 and Tables S10–S11†). In medium and strong polar solvents, the emission spectra of 1–7 exhibit a bathochromic shift upon increasing the solvent polarity (see Fig. S2†).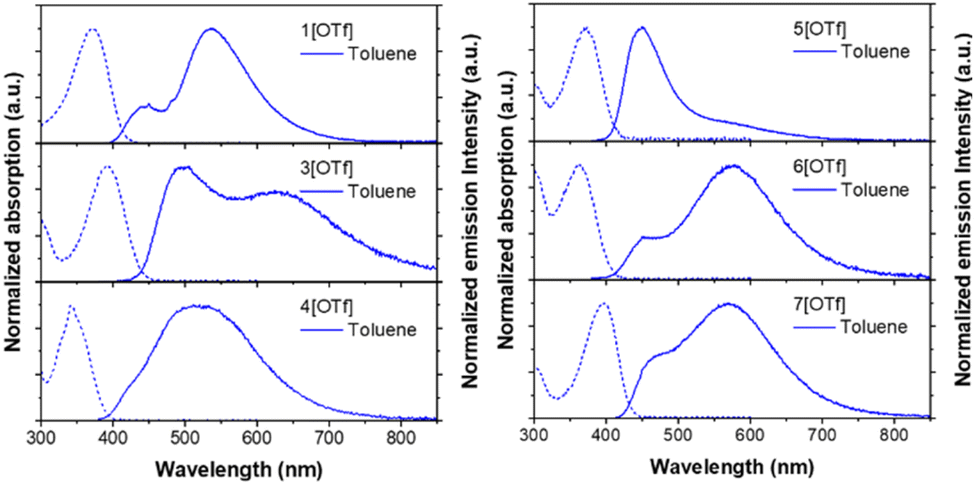 | ||
| Fig. 1 The steady-state spectra of salts 1[OTf], 3–7[OTf] in toluene. Absorption and emission spectra are depicted in dashed and solid lines, respectively. | ||
| Computational | Experimental | ||||||
|---|---|---|---|---|---|---|---|
| λ abs (nm) | λ em (nm) | HOMO/LUMO (eV) | λ abs (nm) | λ em (nm) | Stokes shift (cm−1) | PLQY | |
| a λ abs and λem are absorption and emission peak wavelengths, respectively, accessed by computational calculations and steady-state spectroscopies. The calculations including the HOMO/LUMO level are based on DFT/TDDFT with M06-2x/6-31G+(d,p).39,40 The experimental λem is given by Gaussian function deconvolution (Fig. S3). The Stokes shift is defined by the difference between the absorption and longest emission peak in terms of frequency. PLQY is the photoluminescence quantum yield. For details of derivation of PLQY, please see the ESI. | |||||||
| 1[OTf] | 353 | 399 | −7.28/−2.31 | 371 | 438, 540 | 8436 | 0.14 |
| 2[OTf] | 363 | 435 | −7.12/−2.20 | 383 | 475, 587 | 9074 | 0.17 |
| 3[OTf] | 379 | 456 | −6.96/−2.35 | 391 | 493, 619 | 9420 | 0.16 |
| 4[OTf] | 330 | 403 | −7.45/−2.31 | 341 | 429, 475, 532 | 10![[thin space (1/6-em)]](https://www.rsc.org/images/entities/char_2009.gif) 529 529 |
0.59 |
| 5[OTf] | 359 | 428 | −7.11/−2.02 | 370 | 450, 516 | 7647 | 0.91 |
| 6[OTf] | 348 | 420 | −7.11/−2.15 | 363 | 455, 573 | 10096 |
0.40 |
| 7[OTf] | 380 | 439 | −7.08/−2.35 | 397 | 464, 566 | 7521 | 0.49 |
In weakly polar solvents such as toluene, all studied compounds show broad emission profiles composed of at least two components (see Fig. 1). For the convenience of discussion, as for the dual emission, the short- and long-wavelength emissions are assigned to the F1 and F2 bands, respectively. The high-energy F1 band specifies the emission of the species where the anion stays near the phosphonium acceptor. Meanwhile, low-energy F2 corresponds to the state formed by the anion migration from the phosphonium group to the donor. Later, we will show that this process is driven by the change of electrostatic potential arising from the charge transfer in the excited state, leading to the system stabilization (vide infra).
Time-resolved spectroscopy
We then focus on the dynamics of the anion migration in toluene, where this phenomenon is associated with the temporal spectral evolution from short-(F1) to long-(F2) wavelength. The wavelength-variable fluorescence time trace was measured by the time-correlated single photon counting (TCSPC). Our current setup of TCSPC incorporates a 120 fs Ti-sapphire laser and microchannel plates, giving a time resolution of around 15–20 ps. This response time is short enough to resolve the anion translocation processes, which have been reported to be within a time constant of several hundred picoseconds.23–26 TCSPC, though having a longer response time than that of the fluorescence up-conversion technique currently available in our lab, provides stable spectral measurements due to the weak excitation intensity and low noise level.To obtain meaningful time-resolved emission spectra, we employed the method described in the literature,41 where the spectra at various delay times were plotted with the area of each spectrum normalized to a constant value. Please see the ESI for details.† As shown in Fig. 2(a), upon excitation at the absorption peak, in toluene these compounds initially exhibit prominent emissions maximized at ∼460 (2[OTf]), 485 (3[OTf]) and 430 nm (4[OTf]). As the time evolves, the signals gradually red shift and eventually appear as new bands centered at ∼580, 630 and 525 nm, respectively. Note that the spectra are plotted under the condition that area of entire spectrum is normalized to a constant value. Similar type of plotting methodology has been reported.41 Throughout the whole spectral evolution, the absence of definite iso-emissive point indicates the existence of more than two emitting species. Similar phenomena are observed for 5–7[OTf] (see Fig. S5(a)†). In other words, the results should be described more specifically by the continuous spectral evolution rather than interconversion of two species.23–26 Due to the continuous character of the changes in time, it is therefore not possible to have a single exponential decay in the early dynamics for a given emission wavelength. Nevertheless, in a qualitative manner, upon monitoring the intensity at the peak of the F2 band and fitting the rise component with a single exponential function, we obtain a rise time constant in the order of 1[OTf] < 2[OTf] < 3[OTf] < 4[OTf] for group A, 2[OTf] < 5[OTf] for group B and 6[OTf] < 2[OTf] < 7[OTf] for group C (see Table 2). These trends are consistent with the prediction that increasing electron donor or acceptor strength will enhance the positive charge to localize at the donor site, hence reducing the time constant of the anion migration, i.e., accelerating the anion translocation (vide infra).
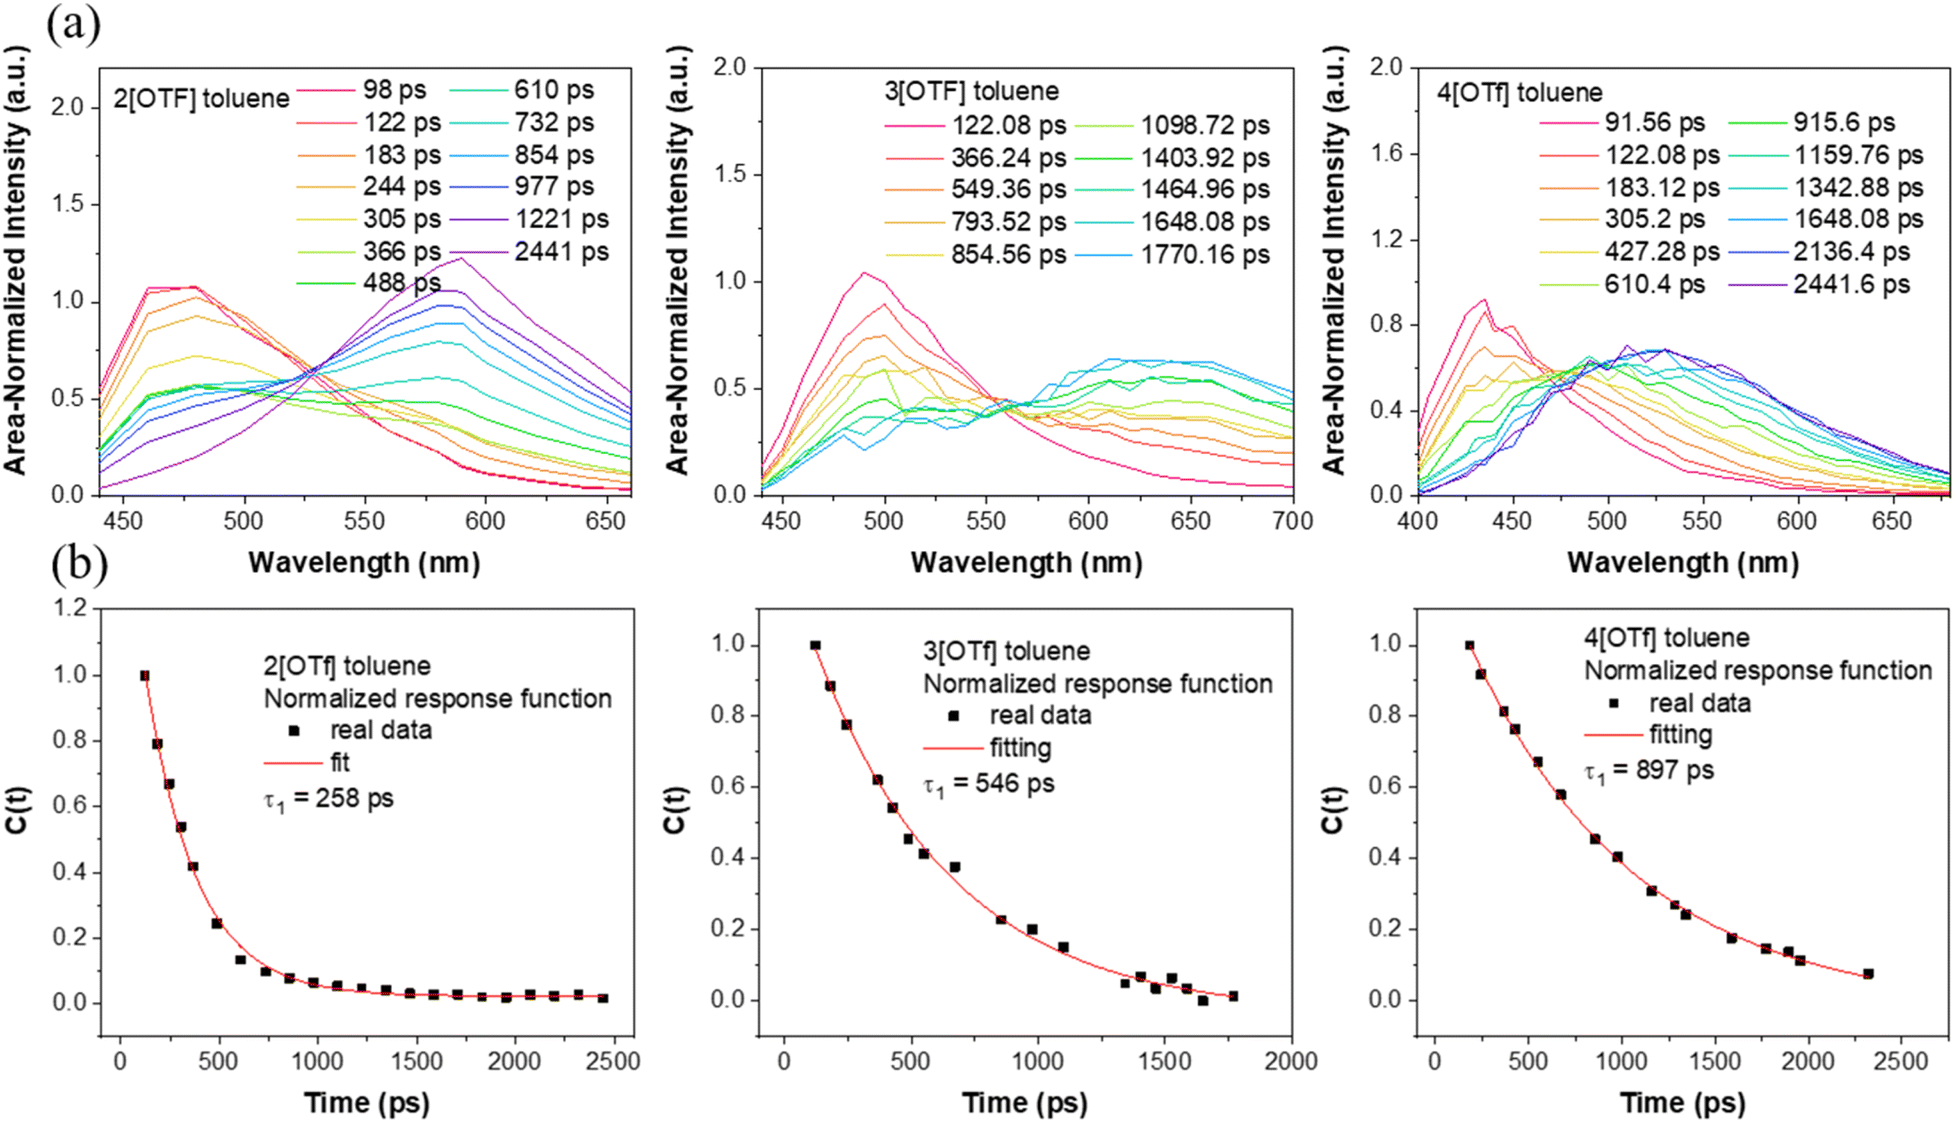 | ||
| Fig. 2 (a) Time-resolved emission spectra of 2[OTf],303[OTf], and 4[OTf]. Note that the spectra are plotted under the condition that the area of the entire spectrum is normalized to a constant value. A similar type of plotting methodology has been reported in ref. 41. (b) Spectral response functions C(t) of 2[OTf], 3[OTf], and 4[OTf] in toluene. | ||
| τ 1 (ps) at F1 | τ 2 (ps) at F2 | τ trans(ps) | |
|---|---|---|---|
| a τ 1 and τ2 are the time constant measured by the TCSPC method. τtrans represents the decay time constant obtained by the spectral response function C(t). The value in parentheses is the pre-exponential factor from the lifetime fitting, and negative values indicate a rise component. | |||
| 1[OTf] | 440 nm: 30 (0.82), 268 (0.18) | 650 nm: 83 (−0.40), 1035 (0.60) | ∼80 (from TCSPC) |
| 2[OTf] | 430 nm: 150 (0.73), 660 (0.27) | 650 nm: 298 (−0.45), 3807 (0.55) | 258 |
| 3[OTf] | 440 nm: 24 (0.85), 583 (0.15) | 660 nm: 378 (−0.45), 1587 (0.55) | 546 |
| 4[OTf] | 430 nm: 59 (0.64), 524 (0.34), 4741 (∼0) | 650 nm: 519 (−0.43), 5906 (0.57) | 897 |
| 5[OTf] | 430 nm: 840 (0.65), 3165 (0.35) | 650 nm: 931 (−0.49), 3415 (0.51) | 1324 |
| 6[OTf] | 430 nm: 51 (0.58), 388 (0.42), 4300 (∼0) | 650 nm: 288 (−0.48), 4266 (0.52) | 172 |
| 7[OTf] | 430 nm: 376 (0.96), 2751 (0.04) | 650 nm: 395 (−0.50), 3874 (0.50) | 467 |
The observation of continuous spectral evolution of anion translocation reflects the general relaxation mechanism of polar solvents in the presence of emitters with charge transfer character. In such systems, electronic excitation changes the dipole moment with respect to the ground state in terms of magnitude and direction. Following this, the surrounding solvent molecules reorient their dipoles, thereby stabilizing the charge-transfer state. This solvent rearrangement also destabilizes the hot ground state formed upon vertical Franck–Condon transition. Therefore, the time-resolved Stokes shifted emission during the solvent relaxation can be described by the spectral response function C(t) expressed in eqn (1) (ref. 42–50)
 | (1) |
Eqn (1) directly relates to the time evolution of the solvation free energy or solvent configuration in the vicinity of the ESICT molecule and is applicable to a variety of conditions.45–49 The simplest model to describe the rotating solvent dipoles is the Debye–Onsager model,42 where the C(t) function becomes a single exponential function with a decay time constant called the solvent longitudinal relaxation time. Alternatively, for a more sophisticated model to approach reality, the C(t) is non-exponential. An average relaxation time can be applied for the discussion, which is the value deduced by the integration of the C(t).51 These two values are used interchangeably, showing the same trend in the data interpretation.
Note that the above treatment requires solvent relaxation as the sole contribution to the entire relaxation process.44,45 Due to the π-linkage between the donor and acceptor, the charge transfer of 1–7 should be ascribed to an adiabatic type, i.e., a type of optical electron transfer. Hence the rate of charge transfer for 1–7 should be ultrafast (fs), which can be decoupled from the solvent relaxation (ps), fulfilling the criterion for eqn (1).50 In a polar solvent (e.g., CH2Cl2), eqn (1) should be applicable to the title compounds 1–7[OTf]. Support of this viewpoint is given by the fluorescence up-conversion measurement of e.g., 3[OTf], where the spectral response function C(t) is depicted in Fig. S12,† with a longitudinal relaxation time fitted to be 1.24 ps, which is consistent with the reported value (1.02 ps).48
Differently, instead of solvent stabilization, here, we are dealing with the anion migration stabilizing cation chromophore after ESICT in the weakly polar solvent. Nevertheless, the resulting C(t) (see Fig. 2) is still a single exponential-like decay. We thus propose that C(t) may be applicable to the [OTf]− translocation. In other words, the time resolved Stokes shift during the anion translocation is similar to that of the solvent relaxation except that the temporal spectral evolution is much slower due to its translational type of motion. In a qualitative manner, we thus fit the resulting C(t) by a single exponential decay function to extract the time constant. Note that a similar approach has been applied in theoretical studies on the solvation of the ion atmosphere (electrolyte solution)52 and time-dependent Stokes shift experiments in ionic liquids.47 For most studied compounds in toluene, we deconvoluted the temporal emission spectra with two Gaussian functions and used the lower energy emission peak as ν(t), and the longest wavelength emission peak in the steady-state emission spectrum was taken as ν(∞). In this approach v(0) is selected when the emergence of a spectral variation from F1 to F2 band is observed. Please see the ESI† for details of the fitting process. As a result, single exponential decay of C(t) is observed for all studied compounds in toluene (see Fig. 2(b) for 2[OTf], 3[OTf] and 4[OTf] and Fig. S5(b)† for the remaining compounds). The fitted decay time constants are listed in Table 2. Clearly, the resulting time constants τtrans are nearly parallel with those for rise components in the early dynamics obtained from the decay of emission monitored at a single wavelength (Table 2) with a single exponential decay fit. However, as mentioned, C(t) is endowed with a more convincing physical meaning. Moreover, the standard deviation of the single exponential decay using C(t) is smaller (cf. the decay at a selected emission wavelength). Hereafter, the time constant extracted from C(t) is used to represent the translocation, denoted as τtrans.
We next performed temperature dependent C(t) measurements to probe if the process of anion translocation was associated with any energy barrier. In this approach, maintaining the viscosity during the measurement is crucial; otherwise, mixing “reaction barriers” and “viscosity mechanics barriers” will make data extraction too complex and unconvincing. To solve this hurdle, we employed a selection of weak polar solvents such as toluene, ethylbenzene, n-propylbenzene, cumene, and sec-butylbenzene at different temperatures. We have found that these weakly polar solvents have a minor effect on the emission peak wavelengths for the studied salts, and only alter the emission intensity ratio of F1/F2 due to different viscosities (Fig. S4†). We can thus achieve time traces of equal viscosity at different temperatures in corresponding solvents.53 For example, at room temperature, we use n-propylbenzene as a solvent, while toluene is used as a solvent for the measurement at 267 K, etc. During the measurement, the viscosity was maintained between 0.84 and 0.86 centipoise (Table S9†). A detailed result of the temperature-dependent study using 3[OTf] as the prototype is shown in Fig. S11.† We then applied the Arrhenius equation (eqn (2)) to extract the “activation energy” Ea.
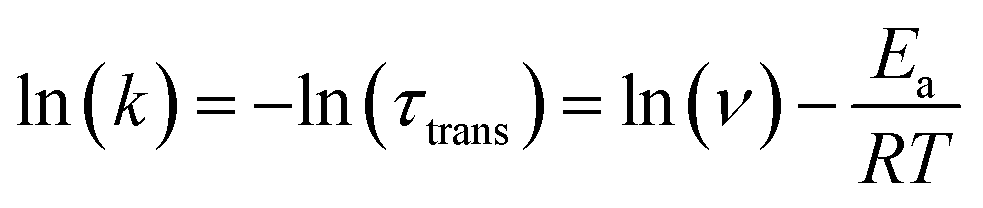 | (2) |
 | ||
| Fig. 3 (a) The plot of lnk, where k is the translocation rate, of 3[OTf] anion migration as a function of 1/T. (b) The plot of lnk of 3[OTf] anion migration as a function of −lnη where η is the viscosity. | ||
Further support of the above viewpoint is given by the study of viscosity–translocation rate relationships for 3–7[OTf] in weakly polar solvents at a constant temperature. This experiment was done by performing C(t) measurement in toluene, ethylbenzene, n-propylbenzene, cumene, and sec-butylbenzene, which have similar polarities but different viscosities at room temperature (vide supra). As a result, the viscosity dependent rates extracted from C(t) are listed in Fig. S6(a)–S10(a).† The obtained translocation rates are then fitted according to an empirical relation expressed in eqn (3) (ref. 7 and 56)
| ln(k) = −aln(η) + b | (3) |
The slow anion translocation rate (τtrans > 100 ps) leads us to conclude that the anion migration mainly involves translational motion,52,59 rather than the rotational diffusion that is dominant in the polar solvents. We then attempt to support the time domain of the anion migration with an anion drift model shown in Fig. 4 (see the explanation below).60 The following equation is used to calculate the traveling time τcalc required for an anion to arrive at the donor site
 | (4) |
 | (5) |
 | ||
Fig. 4 Anion drift model used to calculate the traveling time of the anion to reach the donor. The time τcalc required for the process is calculated by dividing the distance L from the phosphorus (orange) atom to the nitrogen (blue) atom by the product of the mobility u of the anion and the electric field |Ez| along the z-axis between the donor and acceptor. For partial charge transfer cases (e.g., 3[OTf]), |Ez| can be calculated using the restrained electrostatic potential (RESP) method on the  state (see text for details). state (see text for details). | ||
For 3[OTf] and other phosphonium salts, the charge transfer cannot be 100% efficient, and the donor apparently acquires only a partial positive charge. In addition, neither an electron donor nor acceptor moiety is the point source of charge. To extract the effect of charge transfer, we then calculate the coulombic force exerted on the counter anion [OTf]−, where each atom of the donor group has partial positive charge after ESICT, hence the sum of all the forces can be created. The atomic charge of each atom can be obtained by using the method of restrained electrostatic potential (RESP)64,65via the Multiwfn program,66 where the calculation is performed under the geometry optimization of both ground (S0) and relaxed excited states  without the anion using density functional theory (DFT) and time-dependent density functional theory (TDDFT), respectively (see ESI†). Fig. 5 depicts the calculated electrostatic potential (ESP) maps of cationic molecules 1–4 without anions and the results for the remaining studied molecules are shown in Fig. S16–S17.†
 | ||
| Fig. 5 Electrostatic potential (ESP) maps of the cations in group A calculated by the restrained electrostatic potential (RESP) method. The calculations are performed via Multiwfn program. We exhibit the net Coulomb interaction between the anion and donor moiety. The result will serve as an indicator of the degree of positive charge localization at the donor. (See the model in Fig. S18†). | ||
We next make the comparison between the experimentally resolved data τtrans based on C(t) and the theoretically derived τcalc from eqn (4) where |Ez| is obtained from the RESP method on the  state. For the case of 3[OTf], τcalc is derived to be 197 ps, which, in terms of magnitude, is close to the experimental result of τtrans of 546 ps (see Fig. 2). In this theoretical approach, we overlook the overall charge distribution of the cation backbone after ESICT. Also, the Brownian motion cannot be simply described along the distance between the electron donor and acceptor. In other words, the calculated distance of 10.3 Å should be treated as a lower limit for distance, and the actual zigzag migration distance could be longer. Nevertheless, this simplified model provides an adequate magnitude of time scale for the photoinduced anion migration of the studied phosphonium salts.
Relation of donor–acceptor strength
Table 1 lists the calculated absorption and emission wavelengths of the studied compounds in toluene. The calculated values are consistent with the trend of the experimental data, giving us confidence in the use of HOMO/LUMO energy levels in discussing the corresponding donor/acceptor strength to the trend of anion migration rate. In theory, the HOMO with a higher energy level is expected to have stronger electron donating strength, which is calculated to be in the order of 2(NPh2)∼3(N(t-BuPh)2) > 1 (NMe2) > 4(carbazole) for group A (see Table 1). The calculated donor strength of 4 is obviously the weakest one in group A, which is consistent with the longest τtrans (Table 2) experimentally measured. However, the donor strength of 1 should be at the third place, whereas its experimental τtrans is the shortest in group A. This discrepancy can be rationalized by the structure versus electrostatic potential (Fig. 5). We may overlook the π-electron donating strength,67,68 which involves orbital coupling between the electron donor and π-conjugated system. This coupling is weakened by simply increasing the dihedral angle between them. To examine the influence of dihedral angle on the π-electron donor strength, we then optimize both the structure of cations without anions in the S0 state and state. We then define the dihedral angle between the donor plane and biphenyl bridge as θ1, and the dihedral angle of the biphenyl group as θ2 (see Table 3).
|
|
||||
|---|---|---|---|---|
| S0 |
|
|||
| θ 1 (°) | θ 2 (°) | θ 1 (°) | θ 2 (°) | |
| 1 | 0.16 | 33.19 | 0.19 | 15.69 |
| 2 | 31.37 | 34.32 | 39.93 | 11.24 |
| 3 | 29.92 | 33.20 | 41.79 | 12.41 |
| 4 | 51.25 | 38.22 | 46.77 | 0.42 |
| 5 | 30.12 | 33.39 | 40.07 | 11.82 |
| 6 | 31.57 | 48.24 | 39.65 | 29.48 |
| 7 | 30.75 | 20.38 | 38.22 | 14.77 |

As shown in Table 3, after electron excitation, the cation backbone of groups A and B generally exhibits an increase in θ1 from ∼30° to ∼40° and a decrease in θ2 from ∼30° to ∼10°.69–72 However, phosphonium 1 shows a distinct difference. Even after ESICT, 1 maintains θ1 at 0°. This implies that the dimethyl amino group should be a stronger π-electron donor, which would lead to prominent positive charge localization at the donor site in the excited state, giving the fastest anion migration among 1–4. On the other hand, the lower energy of the LUMO points to a stronger electron acceptor strength that is anticipated to produce a more pronounced CT, i.e., depletion of electron density from the donor. Consequently, the acceptor strength is 2(P+Ph3) > 5(P+Cy3) for group B, which is consistent with the significantly longer τtrans of 1324 ps for 5[OTf] than 258 ps for 2[OTf].
Group C that includes 2[OTf], 6[OTf] and 7[OTf] possesses the same electron donor and acceptor moieties, while an appreciable difference in anion migration rate is observed. Therefore, the dihedral angle θ2 of the biphenyl spacer in the excited state might impact the dynamics within the ion pair. Both experimental and theoretical approaches indicate that 6[OTf] exhibits a faster translocation rate of [OTf]−. The θ2 of ∼30° for the charge transfer state of 6 is more than twice larger than that of 2 and 7 (see the θ2 values for the  state in Table 3). Therefore, cation 6 retains the twisted structure after ESICT because of its methyl substituent. Consequently, the degree/efficiency of charge separation is better than that in 2 and 7, which is reminiscent of the operation of twisted intramolecular charge transfer (TICT), facilitating charge separation.72,73 This viewpoint is also verified by the ESP map of group C, where 6 in the
  state has more positive charge than that of 2 and 7 located at the donor site (Fig. S17†). Despite 2 and 7 both adopting a similar
  structure in terms of θ1 and θ2 (see Table 3), the electrostatic potential map of 7 indicates that the positive charge not only concentrates on the D–A sites, but also spreads across the biphenyl bridge due to the strictly locked framework in 7 (Fig. S17†), diminishing the positive charge built on the donor site. As a result, upon ESICT, the positive charge created in the donor site is in the order of 6 > 2 > 7, which is consistent with the (τtrans)−1 of 6[OTf] (172 ps)−1 > 2[OTf] (258 ps)−1> 7[OTf] (467 ps)−1.
Conclusions
In summary, we have designed a family of phosphonium fluorophores to investigate the kinetics of the ion migration processes, which occur upon excited-state charge transfer of ion pairs in weakly polar solvents. As the low polarity medium minimizes solvation of ionic species, the distinct spectral shift observed in the time-dependent emission spectra is mainly associated with the continuous translocation of the anion. Referring to the well-established solvatochromism, we found that anion migration shows similarities to solvent relaxation dynamics, except for the much slower time domain because of the involvement of anion translational motion. Based on this concept, we conducted in-depth studies on the anion migration dynamics of these phosphonium salts and put forward several remarks:(1) We quantified the translocation rate by applying the spectral response function C(t) and found that the spectral temporal evolution induced by anion translocation can be modeled using a mono-exponential decay kinetics. This property resembles the solvent relaxation but differs in the type of motion involved. While the rotational diffusion dominates polar solvent relaxation (Debye–Onsager model), the anion migration is mainly governed by the translational motion through a distance and direction where the electric field is induced.
(2) The photoinduced anion translocation can be illustrated as a “migration” process with a negligible barrier, which is driven by the electric field built by charge transfer, as demonstrated by the viscosity and temperature dependent experiments. Note that the lack of an intrinsic barrier indicates that the friction imposed by the environment serves as a mechanical barrier to the migration.
(3) The velocity of anion translocation is proportional to the external electric field imposed by the positive charge temporarily located at the donor site upon charge transfer. Thus, we conclude that the rate of photoinduced anion migration is primarily governed by electrostatic interactions and charge redistribution.
From a microscopic point of view, the anion undergoes a biased Brownian motion along the pathway where the distance and direction are determined by the location and strength of electron donor and acceptor groups. Compared to the solvent relaxation with low viscosity, this migration process occurs at a much slower time scale, which is sensitive to the electric field created by ESICT.
Data availability
The data supporting this article have been included as part of the ESI.†Author contributions
Hao-Ting Qu conducted the photophysical measurements, theoretical calculations, Gaussian 16 software computations, dynamics measurements, and photophysical analysis, as well as preparing the manuscript. Iida Partanen performed part the organic synthesis. Kai-Hsin Chang contributed to the discussions on photophysics and the computations related to dipole and anion migration structures. Yan-Ding Lin also contributed to the computations for dipole and anion migration structures. Igor O. Koshevoy served as an advisor and prepared the manuscript. Andrey Belyaev was responsible for molecular design, synthesis and characterization, and manuscript preparation. Pi-Tai Chou acted as an advisor, leading the photophysics section and the overall manuscript preparation.Conflicts of interest
There are no conflicts to declare.Acknowledgements
We thank the National Science and Technology Council (grant no. NSTC-113-2639-M-002-001-ASP, P.-T. C.) and the Academy of Finland (decision 351618, I. O. K.; Flagship Programme, Photonics Research and Innovation PREIN, decision 320166) for funding of this project.Notes and references
- X. Mao, M. Liu, Q. Li, C. Fan and X. Zuo, DNA-based molecular machines, JACS Au, 2022, 2, 2381–2399 CrossRef CAS PubMed.
- H. Ramezani and H. Dietz, Building machines with DNA molecules, Nat. Rev. Genet., 2020, 21, 5–26 CrossRef CAS PubMed.
- W. R. Browne and B. L. Feringa, Making molecular machines work, Nat. Nanotechnol., 2006, 1, 25–35 CrossRef CAS PubMed.
- R. Iino, K. Kinbara and Z. Bryant, Introduction: molecular motors, Chem. Rev., 2020, 120, 1–4 CrossRef CAS PubMed.
- M. Xue, Y. Yang, X. Chi, X. Yan and F. Huang, Development of pseudorotaxanes and rotaxanes: from synthesis to stimuli–responsive motions to applications, Chem. Rev., 2015, 115, 7398–7501 CrossRef CAS PubMed.
- J. D. Badjic, C. M. Ronconi, J. F. Stoddart, V. Balzani, S. Silvi and A. Credi, Operating molecular elevators, J. Am. Chem. Soc., 2006, 128, 1489–1499 CrossRef CAS PubMed.
- D. C. Jagesar, S. M. Fazio, J. Taybi, E. Eiser, F. G. Gatti, D. A. Leigh and A. M. Brouwer, Photoinduced shuttling dynamics of rotaxanes in viscous polymer solutions, Adv. Funct. Mater., 2009, 19, 3440–3449 CrossRef CAS.
- I. Willner, V. Pardo-Yissar, E. Katz and K. T. Ranjit, A photoactivated ‘molecular train’for optoelectronic applications: light-stimulated translocation of a β-cyclodextrin receptor within a stoppered azobenzene-alkyl chain supramolecular monolayer assembly on a Au-electrode, J. Electroanal. Chem., 2001, 497, 172–177 CrossRef CAS.
- D. W. Steuerman, H.-R. Tseng, A. J. Peters, A. H. Flood, J. O. Jeppesen, K. A. Nielsen, J. F. Stoddart and J. R. Heath, Molecular-mechanical switch-based solid-state electrochromic devices, Angew. Chem., Int. Ed., 2004, 43, 6486–6491 CrossRef CAS PubMed.
- C. Kwamen and J. Niemeyer, Functional rotaxanes in catalysis, Chem.–Eur. J., 2021, 27, 175–186 CrossRef CAS PubMed.
- M. J. Langton and P. D. Beer, Rotaxane and catenane host structures for sensing charged guest species, Acc. Chem. Res., 2014, 47, 1935–1949 CrossRef CAS PubMed.
- N. Pairault, R. Barat, I. Tranoy-Opalinski, B. Renoux, M. Thomas and S. Papot, Rotaxane-based architectures for biological applications, C. R. Chim., 2016, 19, 103–112 CrossRef CAS.
- B. Yao, H. Sun, L. Yang, S. Wang and X. Liu, Recent progress in light-driven molecular shuttles, Front. Chem., 2022, 9, 832735 CrossRef PubMed.
- P. Wu, B. Dharmadhikari, P. Patra and X. Xiong, Rotaxane nanomachines in future molecular electronics, Nanoscale Adv., 2022, 4, 3418–3461 RSC.
- M. N. Chatterjee, E. R. Kay and D. A. Leigh, Beyond switches: ratcheting a particle energetically uphill with a compartmentalized molecular machine, J. Am. Chem. Soc., 2006, 128, 4058–4073 CrossRef CAS PubMed.
- S. Erbas-Cakmak, D. A. Leigh, C. T. McTernan and A. L. Nussbaumer, Artificial molecular machines, Chem. Rev., 2015, 115, 10081–10206 CrossRef CAS PubMed.
- V. Balzani, A. Credi and M. Venturi, Light powered molecular machines, Chem. Soc. Rev., 2009, 38, 1542–1550 RSC.
- H. Tian and Q.-C. Wang, Recent progress on switchable rotaxanes, Chem. Soc. Rev., 2006, 35, 361–374 RSC.
- S. Garaudée, S. Silvi, M. Venturi, A. Credi, A. H. Flood and J. F. Stoddart, Shuttling Dynamics in an Acid–Base-Switchable [2] Rotaxane, ChemPhysChem, 2005, 6, 2145–2152 CrossRef PubMed.
- A. S. Lane, D. A. Leigh and A. Murphy, Peptide-based molecular shuttles, J. Am. Chem. Soc., 1997, 119, 11092–11093 CrossRef CAS.
- M. R. Panman, P. Bodis, D. J. Shaw, B. H. Bakker, A. C. Newton, E. R. Kay, A. M. Brouwer, W. J. Buma, D. A. Leigh and S. Woutersen, Operation mechanism of a molecular machine revealed using time-resolved vibrational spectroscopy, Science, 2010, 328, 1255–1258 CrossRef CAS PubMed.
- A. M. Brouwer, C. Frochot, F. G. Gatti, D. A. Leigh, L. Mottier, F. Paolucci, S. Roffia and G. W. Wurpel, Photoinduction of fast, reversible translational motion in a hydrogen-bonded molecular shuttle, Science, 2001, 291, 2124–2128 CrossRef CAS PubMed.
- A. Belyaev, Y. H. Cheng, Z. Y. Liu, A. J. Karttunen, P. T. Chou and I. O. Koshevoy, A Facile Molecular Machine: Optically Triggered Counterion Migration by Charge Transfer of Linear Donor-π-Acceptor Phosphonium Fluorophores, Angew. Chem., Int. Ed., 2019, 58, 13456–13465 CrossRef CAS PubMed.
- T.-C. Lin, Z.-Y. Liu, S.-H. Liu, I. O. Koshevoy and P.-T. Chou, Counterion migration driven by light-induced intramolecular charge transfer, JACS Au, 2021, 1, 282–293 CrossRef CAS PubMed.
- A. Belyaev, B. K. Su, Y. H. Cheng, Z. Y. Liu, N. M. Khan, A. J. Karttunen, P. T. Chou and I. O. Koshevoy, Multiple Emission of Phosphonium Fluorophores Harnessed by the Pathways of Photoinduced Counterion Migration, Angew. Chem., 2022, 134, e202115690 CrossRef.
- K. H. Chang, Y. H. Yang, K. H. Su, Y. Chen, T. C. Lin, J. L. Li, Z. Y. Liu, J. H. Shi, T. F. Wang and Y. T. Chang, Light Induced Proton Coupled Charge Transfer Triggers Counterion Directional Translocation, Angew. Chem., Int. Ed., 2024, e202403317 CAS.
- V. Balzani, M. Clemente-Leon, A. Credi, B. Ferrer, M. Venturi, A. H. Flood and J. F. Stoddart, Autonomous artificial nanomotor powered by sunlight, Proc. Natl. Acad. Sci. U. S. A., 2006, 103, 1178–1183 CrossRef CAS PubMed.
- L. Tang, Concentration dependence of diffusion and migration of chloride ions Part 1. Theoretical considerations, Cem. Concr. Res., 1999, 1463–1468 CrossRef CAS.
- D. Marcoux and A. B. Charette, Nickel-Catalyzed Synthesis of Phosphonium Salts from Aryl Halides and Triphenylphosphine, Adv. Synth. Catal., 2008, 350, 2967–2974 CrossRef CAS.
- S. Cha, M. G. Choi, H. R. Jeon and S.-K. Chang, Negative solvatochromism of merocyanine dyes: Application as water content probes for organic solvents, Sens. Actuators, B, 2011, 157, 14–18 CrossRef CAS.
- A. V. Kulinich, E. K. Mikitenko and A. A. Ishchenko, Scope of negative solvatochromism and solvatofluorochromism of merocyanines, Phys. Chem. Chem. Phys., 2016, 18, 3444–3453 RSC.
- P. Fromherz, Monopole-dipole model for symmetrical solvatochromism of hemicyanine dyes, J. Phys. Chem., 1995, 99, 7188–7192 CrossRef CAS.
- D. Laage, W. H. Thompson, M. Blanchard-Desce and J. T. Hynes, Charged push–pull polyenes in solution: anomalous solvatochromism and nonlinear optical properties, J. Phys. Chem. A, 2003, 107, 6032–6046 CrossRef CAS.
- B. Carlotti, G. Consiglio, F. Elisei, C. G. Fortuna, U. Mazzucato and A. Spalletti, Intramolecular charge transfer of push–pull pyridinium salts in the singlet manifold, J. Phys. Chem. A, 2014, 118, 3580–3592 CrossRef CAS PubMed.
- B. Carlotti, A. Cesaretti, C. Fortuna, A. Spalletti and F. Elisei, Experimental evidence of dual emission in a negatively solvatochromic push–pull pyridinium derivative, Phys. Chem. Chem. Phys., 2015, 17, 1877–1882 RSC.
- B. Carlotti, E. Benassi, V. Barone, G. Consiglio, F. Elisei, A. Mazzoli and A. Spalletti, Effect of the π Bridge and Acceptor on Intramolecular Charge Transfer in Push–Pull Cationic Chromophores: An Ultrafast Spectroscopic and TD-DFT Computational Study, ChemPhysChem, 2015, 16, 1440–1450 CrossRef CAS PubMed.
- S. Nigam and S. Rutan, Principles and applications of solvatochromism, Appl. Spectrosc., 2001, 55, 362A–370A CrossRef CAS.
- Z. Liu, T. Lu and Q. Chen, An sp-hybridized all-carboatomic ring, cyclo [18] carbon: electronic structure, electronic spectrum, and optical nonlinearity, Carbon, 2020, 165, 461–467 CrossRef CAS.
- Y. Zhao and D. G. Truhlar, The M06 suite of density functionals for main group thermochemistry, thermochemical kinetics, noncovalent interactions, excited states, and transition elements: two new functionals and systematic testing of four M06-class functionals and 12 other functionals, Theor. Chem. Acc., 2008, 120, 215–241 Search PubMed.
- W. J. Hehre, R. Ditchfield and J. A. Pople, Self—consistent molecular orbital methods. XII. Further extensions of Gaussian—type basis sets for use in molecular orbital studies of organic molecules, J. Chem. Phys., 1972, 56, 2257–2261 CrossRef CAS.
- A. Koti, M. Krishna and N. Periasamy, Time-resolved area-normalized emission spectroscopy (TRANES): a novel method for confirming emission from two excited states, J. Phys. Chem. A, 2001, 105, 1767–1771 CrossRef CAS.
- G. van der Zwan and J. T. Hynes, Time-dependent fluorescence solvent shifts, dielectric friction, and nonequilibrium solvation in polar solvents, J. Phys. Chem., 1985, 89, 4181–4188 CrossRef CAS.
- J. D. Simon, Time-resolved studies of solvation in polar media, Acc. Chem. Res., 1988, 21, 128–134 CrossRef CAS.
- M. Maroncelli, The dynamics of solvation in polar liquids, J. Mol. Liq., 1993, 57, 1–37 CrossRef CAS.
- V. Nagarajan, A. M. Brearley, T. J. Kang and P. F. Barbara, Time-resolved spectroscopic measurements on microscopic solvation dynamics, J. Chem. Phys., 1987, 86, 3183–3196 CrossRef CAS.
- J. D. Simon and S. G. Su, Intramolecular electron transfer and solvation, J. Chem. Phys., 1987, 87, 7016–7023 CrossRef CAS.
- C. F. Chapman and M. Maroncelli, Fluorescence studies of solvation and solvation dynamics in ionic solutions, J. Phys. Chem., 1991, 95, 9095–9114 CrossRef CAS.
- M. Horng, J. Gardecki, A. Papazyan and M. Maroncelli, Subpicosecond measurements of polar solvation dynamics: coumarin 153 revisited, J. Phys. Chem., 1995, 99, 17311–17337 CrossRef CAS.
- A. P. Demchenko, K.-C. Tang and P.-T. Chou, Excited-state proton coupled charge transfer modulated by molecular structure and media polarization, Chem. Soc. Rev., 2013, 42, 1379–1408 RSC.
- T. Kumpulainen, B. Lang, A. Rosspeintner and E. Vauthey, Ultrafast elementary photochemical processes of organic molecules in liquid solution, Chem. Rev., 2017, 117, 10826–10939 CrossRef CAS PubMed.
- S.-G. S. a. J. D. Simon, Importance of Molecular Size on the Dynamics of Solvent Relaxation, J. Phys. Chem., 1989, 93, 753–758 CrossRef.
- G. van der Zwan and J. T. Hynes, Chemical reaction rates and solvation dynamics in electrolyte solutions: ion atmosphere friction, Chem. Phys., 1991, 152, 169–183 CrossRef CAS.
- A. Barlow, J. Lamb and A. Matheson, Viscous behaviour of supercooled liquids, Proc. Roy. Soc. Lond. Math. Phys. Sci., 1966, 292, 322–342 CAS.
- K. R. Harris, Temperature and density dependence of the viscosity of toluene, J. Chem. Eng. Data, 2000, 45, 893–897 CrossRef CAS.
- J. Syage, P. Felker and A. Zewail, Picosecond excitation and selective intramolecular rates in supersonic molecular beams. III. Photochemistry and rates of a charge transfer reaction, J. Chem. Phys., 1984, 81, 2233–2256 CrossRef CAS.
- S. H. Courtney and G. R. Fleming, Search for the kramers theory turnover: photochemical isomerization at very low viscosities, Chem. Phys. Lett., 1984, 103, 443–446 CrossRef CAS.
- R. K. Murarka, S. Bhattacharyya, R. Biswas and B. Bagchi, Isomerization dynamics in viscous liquids: microscopic investigation of the coupling and decoupling of the rate to and from solvent viscosity and dependence on the intermolecular potential, J. Chem. Phys., 1999, 110, 7365–7375 CrossRef CAS.
- H. Sumi, Theory on reaction rates in nonthermalized steady states during conformational fluctuations in viscous solvents, J. Phys. Chem., 1991, 95, 3334–3350 CrossRef CAS.
- G. Ciccotti, M. Ferrario, J. T. Hynes and R. Kapral, Dynamics of ion pair interconversion in a polar solvent, J. Chem. Phys., 1990, 93, 7137–7147 CrossRef CAS.
- V. Gabelica and E. Marklund, Fundamentals of ion mobility spectrometry, Curr. Opin. Chem. Biol., 2018, 42, 51–59 CrossRef CAS PubMed.
- C. Larriba-Andaluz and F. Carbone, The size-mobility relationship of ions, aerosols, and other charged particle matter, J. Aerosol Sci., 2021, 151, 105659 CrossRef CAS.
- J. T. Edward, Molecular volumes and the Stokes–Einstein equation, J. Chem. Educ., 1970, 47, 261 CrossRef CAS.
- P. Banerjee and B. Bagchi, Role of local order in anomalous ion diffusion: Interrogation through tetrahedral entropy of aqueous solvation shells, J. Chem. Phys., 2020, 153, 154505 CrossRef PubMed.
- J. Zhang and T. Lu, Efficient evaluation of electrostatic potential with computerized optimized code, Phys. Chem. Chem. Phys., 2021, 23, 20323–20328 RSC.
- C. I. Bayly, P. Cieplak, W. Cornell and P. A. Kollman, A well-behaved electrostatic potential based method using charge restraints for deriving atomic charges: the RESP model, J. Phys. Chem., 1993, 97, 10269–10280 CrossRef CAS.
- T. Lu and F. Chen, Multiwfn: a multifunctional wavefunction analyzer, J. Comput. Chem., 2012, 33, 580–592 CrossRef CAS.
- O. Kwon, S. Barlow, S. A. Odom, L. Beverina, N. J. Thompson, E. Zojer, J.-L. Brédas and S. R. Marder, Aromatic amines: a comparison of electron-donor strengths, J. Phys. Chem. A, 2005, 109, 9346–9352 CrossRef CAS PubMed.
- P. Hrobarik, I. Sigmundova, P. Zahradnik, P. Kasak, V. Arion, E. Franz and K. Clays, Molecular engineering of benzothiazolium salts with large quadratic hyperpolarizabilities: can auxiliary electron-withdrawing groups enhance nonlinear optical responses?, J. Phys. Chem. C, 2010, 114, 22289–22302 CrossRef CAS.
- M. Maus and W. Rettig, The electronic structure of 4-(N,N-dimethylamino)-4′-cyano-biphenyl and its planar and twisted model compounds, Chem. Phys., 1997, 218, 151–162 CrossRef CAS.
- M. Maus, W. Rettig, G. Jonusauskas, R. Lapouyade and C. Rullière, Subpicosecond transient absorption of donor–acceptor biphenyls. Intramolecular control of the excited state charge transfer processes by a weak electronic coupling, J. Phys. Chem. A, 1998, 102, 7393–7405 CrossRef CAS.
- M. Maus, W. Rettig, D. Bonafoux and R. Lapouyade, Photoinduced intramolecular charge transfer in a series of differently twisted donor–acceptor biphenyls as revealed by fluorescence, J. Phys. Chem. A, 1999, 103, 3388–3401 CrossRef CAS.
- R. Ghosh, A. Nandi and D. K. Palit, Solvent sensitive intramolecular charge transfer dynamics in the excited states of 4-N,N-dimethylamino-4′-nitrobiphenyl, Phys. Chem. Chem. Phys., 2016, 18, 7661–7671 RSC.
- Z. R. Grabowski, K. Rotkiewicz and W. Rettig, Structural changes accompanying intramolecular electron transfer: focus on twisted intramolecular charge-transfer states and structures, Chem. Rev., 2003, 103, 3899–4032 CrossRef PubMed.
Footnote |
| † Electronic supplementary information (ESI) available. CCDC 2366427. For ESI and crystallographic data in CIF or other electronic format see DOI: https://doi.org/10.1039/d4sc04738a |
| This journal is © The Royal Society of Chemistry 2024 |