 Open Access Article
Multiplexed aptasensor for detection of acute myocardial infraction (AMI) biomarkers†
Duygu
Beduk‡
 a,
Tutku
Beduk‡
bc,
Abdellatif
Ait Lahcen
d,
Veerappan
Mani
 c,
Emine
Guler Celik
e,
Gamze
Iskenderoglu
f,
Ferhat
Demirci
g,
Soysal
Turhan
 h,
Oner
Ozdogan
h,
Su
Ozgur
i,
Tuncay
Goksel
ij,
Kutsal
Turhan
k,
Khaled Nabil
Salama
h,
Oner
Ozdogan
h,
Su
Ozgur
i,
Tuncay
Goksel
ij,
Kutsal
Turhan
k,
Khaled Nabil
Salama
 *c and
Suna
Timur
 *al
*al
aCentral Research Test and Analysis Laboratory Application and Research Center, Ege University, 35100 Bornova, Izmir, Turkey
bSilicon Austria Labs (SAL) GmbH, Europastraße 12, 9500, Villach, Austria
cSensors Lab, Advanced Membranes and Porous Materials Center, Computer, Electrical, and Mathematical Science and Engineering Division, King Abdullah University of Science and Technology (KAUST), Thuwal 23955-6900, Saudi Arabia
dWeill Cornell Medicine, Cornell University, New York, NY 10021, USA
eDepartment of Bioengineering, Faculty of Engineering, Ege University, 35100, Bornova, Izmir, Turkey
fDepartment of Cardiovascular Surgery, Health Sciences University Izmir Tepecik Education And Research Hospital, 35180, Konak, Izmir, Turkey
gDepartment of Medical Biochemistry, Health Sciences University Izmir Tepecik Education And Research Hospital, 35180, Konak, Izmir, Turkey
hDepartment of Cardiology, Health Sciences University Izmir Tepecik Education And Research Hospital, 35180, Konak, Izmir, Turkey
iEGESAM-Ege University Translational Pulmonary Research Center, 35100, Bornova, Izmir, Turkey
jDepartment of Pulmonary Medicine, Faculty of Medicine, Ege University, 35100, Bornova, Izmir, Turkey
kDepartment of Thoracic Surgery, Ege University School of Medicine, 35100, Bornova, İzmir, Turkey
lDepartment of Biochemistry, Faculty of Science, Ege University, 35100, Bornova, Izmir, Turkey. E-mail: suna.timur@ege.edu.tr
First published on 27th April 2024
Abstract
Acute myocardial infarction (AMI) is a leading global cause of death. Diagnosis is challenging as cardiac biomarkers are only detectable for a few hours after AMI onset, and current methods are time-consuming and lack selectivity. Therefore, multiple immunological test systems have great importance for rapid and accurate diagnosis. In this context, we developed a rapid immunodiagnostic sensor platform for simultaneous electrochemical detection of cardiac troponin T (cTnT), troponin I (cTnI), and C-reactive protein (CRP) using nanostructured gold-modified laser-scribed graphene (LSG). Aptamer sensors were integrated into the LSG platform for selective AMI biomarkers sensing. Clinical validation was performed on biomarkers from blood samples of 51 AMI patients and 9 healthy controls. Limits of detection were 1.65 ng mL−1 cTnT, 2.58 ng mL−1 cTnI, and 1.84 ng mL−1 CRP. The analytical results determined by the developed platform were compared with the routine standard values of the same patients to prove the accuracy of aptasensors. Sensor results agreed well with standard laboratory assays, highlighting the accuracy of the test platform. The cTnT, cTnI and CRP multiplexed sensor platform demonstrates excellent performance for rapid and sensitive AMI screening.
Introduction
The impact of cardiovascular disease (CVD) disease worldwide is a major public health concern, with cardiac disease accounting for 17.3 million deaths per year across the globe and projected to grow to over 23.6 million by 2030.1 Most CVD fatalities are due to acute myocardial infarction (AMI, commonly known as a heart attack), which occurs due to the sudden occlusion of a coronary artery by thrombus or embolization.2 During AMI, the body releases multiple chemicals into the bloodstream. Key biomarkers among these are known to be troponin-T (cTnT), troponin-I (cTnI), and C-reactive protein (CRP).3 The co-occurrence of these biomarkers in a bloodstream is directly linked to cardiovascular diseases such as myocardial infarction, heart failure, and others. Detecting the presence of these markers leads to rapid diagnoses of AMI. However, when AMI occurs, the body may release one or several cardiac biomarkers depending on complex conditions, proving that performing tests for multiple cardiac biomarkers is crucial for accurate diagnosis of AMI, compared to detecting only a single biomarker.4 Existing methods of AMI diagnosis are based on detection from blood samples taken from patients, to be tested for a single biomarker, cTnT.5–7 The testing process may be quite lengthy, posing problems of accuracy and delays to patient care. When a patient presents for emergency care with symptoms of AMI, the state-of-the-art diagnostic approach is to use multiple methods that include taking vital signs, running blood tests, using X-ray and other imaging, conducting electrocardiograms (ECGs), and/or conducting echocardiograms; this multi-faceted diagnostic process may take several hours.8,9 However, long procedures are impractical, expensive, may lead to inaccuracy, and require advanced training to use. For instance, approximately 70% of CVD patients show normal ECG readings when presenting at the emergency department.10 In addition, some methods of blood analysis require creating a serum from the patient's blood, which adds even more time to the diagnostic process.11 Depending on the combination of diagnostic methods used, hours can elapse. It should be further noted that approximately two-thirds of the patients seeking emergency treatment for AMI arrive later than two hours from the onset of symptoms.12Therefore, developing a practical and accurate method is crucial for AMI diagnosis. Rather than having complex procedures, focusing on the detection of several cardiac biomarkers with the highest efficiency and practicality would increase the survival rate of AMI.1,13 In particular, AMI tests for a single biomarker are associated 3–8% cross-reactivity rate with the current laboratory techniques.14,15 To date, cardiac biomarkers have been detected by conventional laboratory methods such as mass spectrometry, liquid chromatography, fluorescent, luminescence, and enzyme-linked immunosorbent-based techniques.16–19 Although there are a variety of options that imply a range of requirements for facilities, training, and budget, they all cannot test for more than one biomarker in a single assay.20–22
Alternatively, running multiple tests in series with a handheld analyzer, or by running multiple tests in parallel on a benchtop system can improve the accuracy and efficiency, optimizing the cost, inventory, and/or patient comfort.23–26
Aptamers, consisting of peptide molecules or short synthetic oligonucleotides, haven't been explored for AMI diagnosis intensively. Aptamers are designed to be the specific recognition units for cardiac biomarkers while staying stable over a range of temperatures, pH values, and storage conditions.27,28 Aptamers have recently gained interest in the diagnosis of cardiovascular disease.29–31 Laser-scribed graphene (LSG) electrode is an emerging technology that, until now, has not been transferred from labs to commercial applications due to long processing time, expensive material, and specialized instruments.32,33 Graphene is an excellent sensor material due to its high electrical and structural properties, including high electrical and thermal conductivity, excellent mechanical stability, high transparency, and large specific surface area. Also, due to the biodegradable nature of graphene and polymer, it is non-toxic and environmentally friendly. The electrodes are disposable, such devices are ideal for clinical analysis.34,35 Though various techniques have been used in the past for the production of graphene, they often require long processing times, expensive materials, and specialized instruments.36 Through our research, we have discovered that the production of LSG sensors is possible using a CO2 laser tool without the need for a mask to protect the surfaces and in only one step.29,34,37,38 The potential of LSG aptasensors for cardiac biomarkers was demonstrated in our previous study.39
Recently, researchers have started to explore multiplex platforms for the detection of cardiac biomarkers simultaneously. Yang et al. have developed an electrogenerated chemiluminescence biosensor for the simultaneous detection of cTnT, cTnTI, and myoglobin.40 The biosensor utilized a gold electrode and was tested with human serum samples. The reported limit of detections (LODs) for each biomarker were 0.30 ng mL−1 for cTnT, 0.79 pg mL−1 for cTnI, and 31 pg mL−1 for myoglobin. Chen et al. have described the development of a sandwich-type aptasensor for the simultaneous detection of cTnI and myoglobin using commercial screen-printed electrodes.41 Hence, combining simultaneous detection with an aptasensing approach has great potential to detect low concentrations of important cardiac biomarkers for accurate cardiac health monitoring.
In this study, a multiplexed AuLSG aptasensor for the early detection of AMI was successfully developed with validation of clinical study. In total 51 blood samples of AMI patients and 9 healthy blood samples were tested on aptasensors. The results are compared with the laboratory tests performed by the clinic.
The developed aptasensors were in great alignment with the gold standard test results. The LOD values calculated for three types of aptasensors were 1.65 ng mL−1, 2.58 ng mL−1, and 1.84 ng mL−1 for cTnT, cTnI, and CRP, respectively.
Materials and methods
Materials
Thiol modified cTnI aptamer [ThiC6] CGTGCAGTACGCCAACCTTTCTCATGCGCTGCCCCTCTTA, thiol modified cTnT aptamer [ThiC6]ATACGGGAGCCAACACCAGGACTAACATTATAAGAATTGCGAATAATCATTGGAGAGCAGGTGTGACGGAT, thiol modified C-reactive protein aptamer [ThiC6]GGCAGGAAGACAAACATATAATTGAGATCGTTTGATGACTTTGTAAGAGTGTGGAATGGTCTGTGGTGCTGT were purchased from Sigma Aldrich. Gold(III) chloride hydrate (HAuCl4·xH2O), hydrochloric acid (HCl), bovine serum albumin (BSA) (lyophilized powder, ≥96% (agarose gel electrophoresis)), and mercaptohexanol (MCH) were purchased from Sigma Aldrich. cTnI, cTnT, and CRP were purchased from Abcam. Potassium ferricyanide (K3[Fe(CN)6]), potassium ferrocyanide (K4[Fe(CN)6]), and potassium chloride (KCl) were purchased from MP Biomedicals. The phosphate-buffered saline (10× PBS) tablets were purchased from Fisher BioReagents. Polyimide (PI) substrate (Kapton width: 12′′) was purchased from Utech Products, USA, and used as a substrate for the fabrication of LSG electrodes. All electrochemical experiments were performed using a PalmSens electrochemical workstation. All experiments were performed in accordance with the Clinical Investigation of Medical Devices Guidelines, and approved by the ethics committee at Izmir Tepecik Education And Research Hospital with decision number 2023/5/1. Informed consents were obtained from human participants of this study.Sample preparation and storage conditions for clinical application
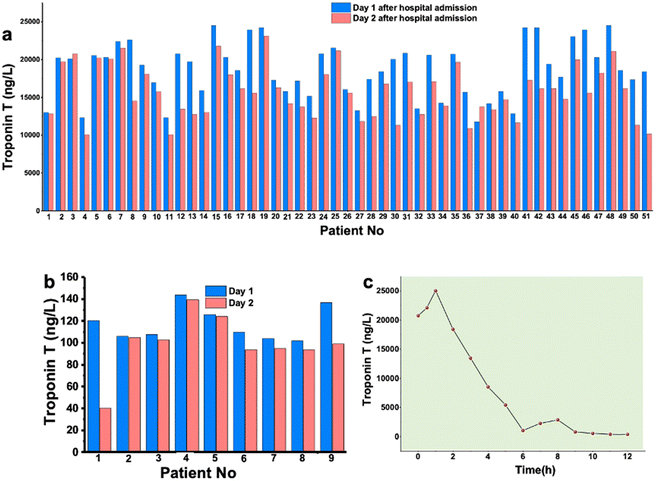
Whole blood samples were collected from AMI patients at the Coronary Emergency Care Unit, Tepecik Hospital, Izmir (Türkiye). A total of 9 healthy samples were collected from volunteers. Routine hospital tests were performed on the blood samples. The AMI patient samples were collected after admission to the hospital for several days to observe the elevation of the biomarker values. Fig. 1a and b summarize the cTnT values of patients recorded on the first day and second day of admission. Fig. 1c shows the decreasing trend of cTnT values over time. The patient samples were taken into yellow capped vacuum blood collection tube (6.0 mL gel and clot activator tube). The gel in the tube creates a physical barrier between the serum and blood cells after centrifugation and accelerates blood coagulation thanks to the silica particles on the tube wall. Gel tubes were filled with 5.0 mL of blood sample to have enough serum samples for sensor testing. Then, the tubes were gently inverted 5–6 times; and avoided being shaken. After blood was stored in tubes coagulated by itself, samples were centrifuged at 1500 RCF by a cooling centrifuge instrument for 15 min. Serum gel tubes were centrifuged within 2 h after collection. Ideally, the samples need to be analyzed within 2 h after collection. In case of delay in analysis, the blood tubes are required to be stored at −20 °C. After centrifugation, serum was successfully separated and portioned carefully into small amounts and stored at −20 °C. All dilutions were performed using 0.1 M PBS containing 0.1 M KCl at pH 7.4. All samples were vortexed for 3 min before use for adding to the sensor surface for the aptamer–biomarker interactions/recognition.Aptasensor preparation
The bare LSG electrodes were modified by electrochemical deposition. The chronoamperometry technique was used at a constant potential of −0.9 V for 240 s in a solution containing 50 mM HAuCl4 prepared in 0.5 M HCl. Lastly, 3D gold-modified LSGs were rinsed with ultrapure water. Stock solutions of aptamers were prepared in 10 mM PBS (pH 7.4) for each biomarker and stored at −20 °C for further use. For the surface modification steps, 20 μM of MCH and 4.0 μM of aptamer solutions prepared in 10 mM PBS at pH 7.4, were placed onto the AuLSG electrodes, respectively. MCH solution was applied prior to biofunctionalization step and approximately 8.0 μL of aptamer solution was dropped on the AuLSG electrodes and incubated for 16 h, then, used immediately for the further steps. Non-reactive aptamers from the AuLSG surfaces were removed by using with 10 mM PBS. For the surface stabilization, BSA solution (10 μL, 0.1 mg mL−1) was applied on the surface for 45 min to block non-specific bonds. After the surface was rinsed with PBS, 8.0 μL of analyte solution was incubated for 1 h. The fabrication process is summarized in Fig. 2. Finally, electrode surfaces were washed before measurements to remove excess BSA. Differential pulse voltammetry (DPV) measurements was performed from −0.4 V to +0.4 V to characterize the electrodes and measure the current signals of aptasensors before and after analyte binding. Resulted difference in current signals (ΔI, μA) before and after addition of analyte solution (biomarkers/sample) are registered as aptasensor response. All electrochemical measurements were performed at ambient conditions in 0.1 M KCl containing 5.0 mM [Fe(CN)6]3−/4− as a redox probe. All electrochemical measurements were repeated 3–5 times.Results and discussion
Characterization
The scanning electron microscopy (SEM) images show a porous structure of graphene and the characteristic morphology of flakey gold nanoparticles of the AuLSG electrodes (Fig. S1 and S2†). The high-resolution spectra of each aptasensor are shown in Fig. S3.† Atomic percentages provide insights into the changing elemental composition during different steps of the sensor fabrication process (Tables S1 and S2†). The presence or absence of specific elements such as Au, C, N, and O at each stage indicates the incorporation of various components, such as biomolecules (aptamers) and modifier (MCH), leading to the development of functional sensors for AMI detection. The atomic percentage representing the presence of Au after the electrodeposition on the graphene surface remains stable at each aptasensor preparation step. After aptamer and MCH incubation, O 1s and N 1s atomic ratios of the surface were increased which proves the successful immobilization of aptamer on a Au surface by using the thiol bonds on one end of aptamers. After applying the samples, bonds between oxygen–carbon, and –nitrogen atoms were formed due the to the presence of biomolecules on the surface.Optimization
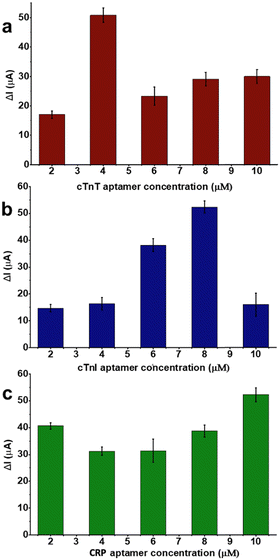
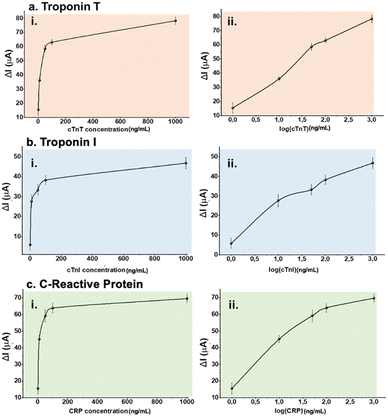
Before any multiplexed sensor performance experiments, aptamer–analyte bindings of each pair were investigated on LSG sensors having one counter, one reference, and one working electrode. Different aptamer concentrations (2.0, 4.0, 6.0, 8.0 and 10 μM) were tested respectively to optimize the sensing performance. For this step, 50 ng mL−1 of analyte (either biomarker or sample) was selected as a fixed concentration and used throughout aptamer optimization tests.Optimum aptamer concentrations were detected as 8.0, 4.0, and 10 μM for cTnT, cTnI, and CRP respectively as shown in Fig. 3. Further experiments were performed at optimum aptamer concentrations. After surface modifications, different concentrations of biomarkers (0, 1.0, 10, 50, 100, and 1000 ng mL−1) were prepared in 10 mM PBS (pH 7.4). The sensitivity of each biomarker was observed by these single-aptamer sensor measurements. Fig. 4 displays the logarithmic correlation between the decrease in current signal response and the concentration of the analyte on each sensor. LOD values for cTnT, cTnI, and CRP were determined as 1.65, 2.58, and 1.84 ng mL−1, respectively, using the formula LOD = 3.3 σ/S. This calculation confirms the compatibility of each aptamer and analyte. Following this validation, further experiments assessing sensor performance were conducted using both standard solutions and real human samples.
Validation with clinical trials
The sensor was prepared by using cardiac aptamers as recognition elements and these are immobilized the electroactive surfaces, respectively for the multiplex detection. Patient samples were then drop-casted on aptamer modified surface and allowed to stand for 1 h at the ambient conditions. Then rinsed and electrochemical sensing responses were monitored via DPV in 0.1 M KCl containing 5.0 mM [Fe(CN)6]3−/4− as a redox probe. Different sample dilution ratios (10, 25, 50, and 75%) were tested to optimize the serum concentration for further clinical experiments, and the highest current difference between the aptamer and patient sample signal was detected in the case of 25% dilution of the patient sample. Further sample dilution ratios (0.1, 1.0, and 2.0%) were tested to optimize the serum concentration for further clinical experiments, and the highest current difference between the aptamer and patient sample signal was detected in the case of 0.1% dilution of the patient sample. All dilutions were performed using 0.1 M PBS containing 0.1 M KCl at pH 7.4. All samples were vortexed for 3 min before use for adding to the sensor surface for the interaction. Finally, DPV was performed from −0.40 V to +0.40 V to characterize the electrodes and measure the response of aptasensors before and after sample incubation. Fig. 5 shows the electrochemical response is inhibited in AMI patient samples due to the binding of cTnI, cTnT, and CRP, leading to a reduction in the current signal. This underscores the importance of the interaction between cTnI, cTnT, and CRP in influencing electrochemical behavior, providing a distinctive signal to differentiate between AMI and control patients.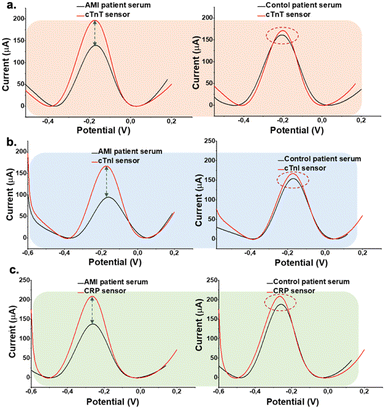 | ||
| Fig. 5 DPV of the aptasensors presenting the change in oxidation current for AMI patient samples and working buffer solution in the presence of the redox probe. (a) cTnT aptasensor (b) cTnI aptasensor (c) CRP aptasensor. Measurements were performed under the same conditions in Fig. 3. | ||
In Fig. 6, the DPV current responses for 60 blood serum samples collected from patients with AMI and negative control subjects were measured by three different sensors. The binding ability of each aptasensors toward blood samples is observed to be different. The oxidation current difference of control patients is measured as 14.5 ± 3.09%, 13.6 ± 2.78%, and 11.6 ± 2.31% by cTnT, cTnI, and CRP sensor respectively. On the other hand, the average values measured by cTnT, cTnI, and CRP sensors are calculated as 75.8 ± 12.2%, 75.15 ± 10.1%, and 41.4 ± 12.5% for AMI patients. The standard deviation of CRP aptasensor response is relatively wider compared to troponin aptasensors which is expected since CRP is not directly correlated with diagnosis of cardiovascular diseases. To assess the possible interference in aptasensor response, cross-reactivity of aptasensor–analytes were tested, shown in Fig. S4.† Though a response is observed from cross-analytes, the aptasensors have selectivity over their own proteins with a response that 3 fold to 6 fold higher than cross-response. Therefore, aptasensors hold a significant potential to be used a multiplexed platform.
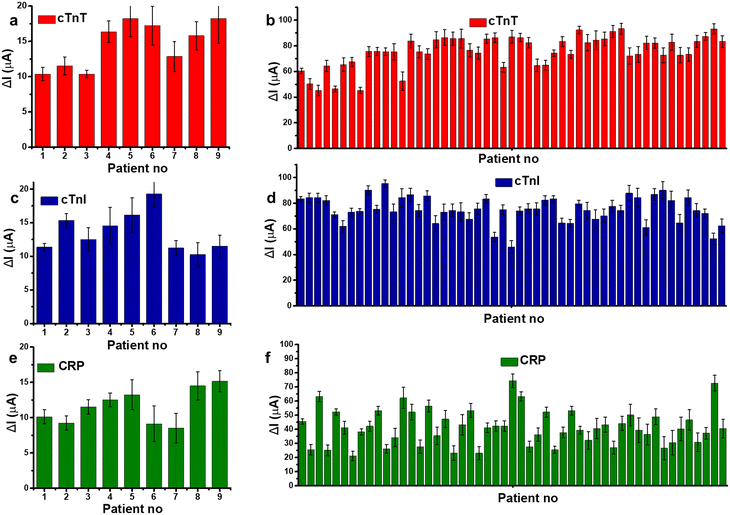 | ||
| Fig. 6 Histograms showing the change in oxidation current values (ΔI) of (a) cTnT, (c) cTnI, and (e) CRP sensors towards blood serum collected from control (negative) patients, (b) cTnT (d) cTnI, and (f) CRP sensors towards blood samples collected from AMI patients. Error bars show ±SD for n = 3–5 for different aptasensors. Measurements were performed under the same conditions as in Fig. 3. | ||
Table S3† provides a summary of electrochemical platforms reported for significant cardiac biomarkers for AMI diagnosis. The majority of the previous studies focused on protein based detection of troponins as seen in Table S3.† Few of the reports are based on aptasensing approach, although aptamers have various advantages compared to antibodies. Indeed, the use of antibodies leads to enhanced sensitivity and, therefore low LOD values. However, these reports include extensive fabrication techniques, the need for complex nanoparticles, and sample processing requirements. The presented work could easily pave the way for an easy and practical diagnosis of cardiovascular diseases which is the most critical cause of global fatality.
Conclusions
Aptasensors for multiplexed detection of cardiac biomarkers were introduced for accurate diagnosis of cardiovascular diseases. The research was focused on developing a rapid diagnostic platform for the early detection of acute myocardial infarction by measuring multiple cardiac biomarkers. cTnT, cTnI, and CRP were selected as target analytes due to their significance in the diagnostics of cardiovascular diseases. Gold-modified LSG electrodes were used for the design of electrochemical aptasensors, optimized through standard solutions, and validated their performance with clinical studies using 60 blood samples from AMI patients (positive and negative). The concentrations of cTnT, cTnI, and CRP determined by the proposed platform were compared with routine standard values, demonstrating the accuracy of the aptasensors. This study has addressed the need for a simultaneous, reliable, and rapid screening test for AMI, potentially improving patient care by providing more accurate diagnostic information than single-marker measurements. A clinical study was performed to demonstrate the sensor performance with 60 human serum samples. The LODs were calculated for each biomarker as 1.65 ng mL−1 for cTnT, 2.58 ng mL−1 for cTnI, and 1.84 ng mL−1 for CRP. The use of aptamers; specific nucleic acid sequences that bind to target molecules, in surface modifications of AuLSG electrodes proves the high selectivity and detection of multiple cardiac biomarkers at clinically relevant concentrations. This research contributes to the development of aptamer-based sensing platforms for comprehensive cardiac health monitoring in serum samples.Author contributions
S. T., K. N. S., K. T., T. G., S. T., conceived and conceptualized the study, provided resources, and acquired funding. D. B. performed the characterization and electrochemical measurements, D. B., T. B., A. A. L., S. O. and E. G. C. wrote the manuscript, under the supervision of S. T. and K. N. S.Conflicts of interest
“There are no conflicts to declare”.Acknowledgements
The authors would like to thank the Ege University Central Research Testing and Analysis Laboratory Application and Research Center (EGE-MATAL) for providing the equipment; Ege University; and King Abdullah University of Science and Technology (KAUST) Saudi Arabia and KAUST Smart-Health Initiative for the financial support.References
- M. Fathil, M. M. Arshad, S. C. Gopinath, U. Hashim, R. Adzhri, R. Ayub, A. Ruslinda, M. Nuzaihan, A. Azman and M. Zaki, Biosens. Bioelectron., 2015, 70, 209–220 CrossRef CAS PubMed
.
-
M. Allahham, M. Singh and H. Jneid, in Biomarkers in Cardiovascular Disease, Elsevier, 2019, pp. 109–114 Search PubMed
.
- X. Han, S. Li, Z. Peng, A. M. Othman and R. Leblanc, ACS Sens., 2016, 1, 106–114 CrossRef CAS
.
- F. A. Van Nieuwenhoven, A. H. Kleine, K. W. H. Wodzig, W. T. Hermens, H. A. Kragten, J. G. Maessen, C. D. Punt, M. P. Van Dieijen, G. J. Van Der Vusse and J. F. Glatz, Circulation, 1995, 92, 2848–2854 CrossRef CAS PubMed
.
- M. Ahmad and N. Sharma, J. Clin. Exp. Cardiol., 2012, 3, 1–8 Search PubMed
.
- A. H. Wu, Am. Heart J., 2015, 169, 674–683 CrossRef CAS PubMed
.
- S. Aydin, K. Ugur, S. Aydin, İ. Sahin and M. Yardim, Vasc. Health Risk Manage., 2019, 1–10 Search PubMed
.
- A. Dolci and M. Panteghini, Clin. Chim. Acta, 2006, 369, 179–187 CrossRef CAS PubMed
.
- S. Y. Kim, J.-P. Lee, W.-R. Shin, I.-H. Oh, J.-Y. Ahn and Y.-H. Kim, Mol. Cell. Toxicol., 2022, 18, 443–455 CrossRef CAS PubMed
.
- S. Szunerits, V. Mishyn, I. Grabowska and R. Boukherroub, Biosens. Bioelectron., 2019, 131, 287–298 CrossRef CAS PubMed
.
-
C. Yucel, in The Detection of Biomarkers, Elsevier, 2022, pp. 113–130 Search PubMed
.
- M. Negahdary, Biosens. Bioelectron., 2020, 152, 112018 CrossRef CAS PubMed
.
- A. G. Cardoso, S. R. Ahmed, Z. Keshavarz-Motamed, S. Srinivasan and A. R. Rajabzadeh, Bioelectrochemistry, 2023, 108440 CrossRef PubMed
.
- I. Tilea, A. Varga and R. C. Serban, Diagnostics, 2021, 11, 881 CrossRef CAS PubMed
.
- M.-I. Mohammed and M. P. Desmulliez, Lab Chip, 2011, 11, 569–595 RSC
.
- Y. Luo, S. Wu, X. Xiang, J. Shu and J. Fei, Biosens. Bioelectron., 2023, 237, 115525 CrossRef CAS PubMed
.
- B. Zhu, L. Yu, S. Beikzadeh, S. Zhang, P. Zhang, L. Wang and J. Travas-Sejdic, Electrochim. Acta, 2021, 378, 138132 CrossRef CAS
.
- Z. Yang and D. Min Zhou, Clin. Biochem., 2006, 39, 771–780 CrossRef PubMed
.
- V. Shumyantseva, T. Bulko, L. Sigolaeva, A. Kuzikov, M. Shatskaya and A. Archakov, Adv. Exp. Med. Biol., 2015, 851, 229–246 CrossRef CAS PubMed
.
- S. Nazir and R. A. Iqbal, Biosens. Bioelectron.: X, 2023, 100388 CAS
.
- S. Zhong, L. Chen, X. Shi, G. Chen, D. Sun and L. Zhang, Microchem. J., 2023, 109063 CrossRef CAS
.
- F. B. Moussa, W. Kutner, T. Beduk, A. Sena-Torralba and E. Mostafavi, Talanta, 2023, 125259 Search PubMed
.
- A. Qureshi, Y. Gurbuz and J. H. Niazi, Sens. Actuators, B, 2012, 171, 62–76 CrossRef
.
- M. Ouyang, D. Tu, L. Tong, M. Sarwar, A. Bhimaraj, C. Li, G. L. Cote and D. Di Carlo, Biosens. Bioelectron., 2021, 171, 112621 CrossRef CAS PubMed
.
-
A. Ramanaviciene, A. Kausaite-Minkstimiene, A. Popov, B. Brasiunas and A. Ramanavicius, in The Detection of Biomarkers, Elsevier, 2022, pp. 303–333 Search PubMed
.
- A. M. Ulloa-Gomez, A. Agredo, A. Lucas, S. B. Somvanshi and L. Stanciu, Biosens. Bioelectron., 2023, 222, 114938 CrossRef CAS PubMed
.
- A. Azzouz, L. Hejji, C. Sonne, K.-H. Kim and V. Kumar, Biosens. Bioelectron., 2021, 193, 113617 CrossRef CAS PubMed
.
- A. Sharma, J. Bhardwaj and J. Jang, ACS Omega, 2020, 5, 3924–3931 CrossRef CAS PubMed
.
- S. Rauf, V. Mani, A. A. Lahcen, S. Yuvaraja, T. Beduk and K. N. Salama, Electrochim. Acta, 2021, 386, 138489 CrossRef CAS
.
- S. G. Surya, S. M. Majhi, D. K. Agarwal, A. A. Lahcen, S. Yuvaraja, K. N. Chappanda and K. N. Salama, J. Mater. Chem. B, 2020, 8, 18–26 RSC
.
- L. Tang, J. Yang, Y. Wang and R. Deng, ACS Sens., 2023, 8, 956–973 CrossRef CAS PubMed
.
- A. Ghanam, A. A. Lahcen, T. Beduk, H. N. Alshareef, A. Amine and K. N. Salama, Biosens. Bioelectron., 2020, 168, 112509 CrossRef CAS PubMed
.
- Y.-K. Yen, G.-W. Huang and R. Shanmugam, Talanta, 2024, 266, 125096 CrossRef CAS PubMed
.
- S. Rauf, A. A. Lahcen, A. Aljedaibi, T. Beduk, J. I. de Oliveira Filho and K. N. Salama, Biosens. Bioelectron., 2021, 180, 113116 CrossRef CAS PubMed
.
- B. Rezaei, M. Ghani, A. M. Shoushtari and M. Rabiee, Biosens. Bioelectron., 2016, 78, 513–523 CrossRef CAS PubMed
.
- A. Pourali, M. R. Rashidi, J. Barar, G. Pavon-Djavid and Y. Omidi, TrAC, Trends Anal. Chem., 2021, 134, 116123 CrossRef CAS
.
- L. Neumaier, L. Rauter, S. K. Lengger, S. Khan, T. Beduk and J. Kosel, IEEE Journal on Flexible Electronics, 2024, 3(2), 65–71 Search PubMed
.
- D. Beduk, T. Beduk, J. I. de Oliveira Filho, A. Ait Lahcen, E. Aldemir, E. Guler Celik, K. N. Salama and S. Timur, ACS Appl. Mater. Interfaces, 2023, 15, 37247–37258 CrossRef CAS PubMed
.
- W. Khushaim, K. Peramaiah, T. Beduk, M. T. Vijjapu, J. I. de Oliveira Filho, K.-W. Huang, V. Mani and K. N. Salama, Biosens. Bioelectron.: X, 2022, 12, 100234 CAS
.
- X. Yang, Y. Zhao, L. Sun, H. Qi, Q. Gao and C. Zhang, Sens. Actuators, B, 2018, 257, 60–67 CrossRef CAS
.
- K. Chen, H. Zhao, Z. Wang, F. Zhou and M. Lan, Sens. Actuators, B, 2023, 134044 CrossRef CAS
.
Footnotes |
| † Electronic supplementary information (ESI) available. See DOI: https://doi.org/10.1039/d4sd00010b |
| ‡ Duygu Beduk and Tutku Beduk contributed equally to this manuscript. |
| This journal is © The Royal Society of Chemistry 2024 |

