 Open Access Article
Creative Commons Attribution 3.0 Unported Licence
Hydrodeoxygenation of isoeugenol in continuous mode using bifunctional Pt-Beta 25-binder catalysts for renewable jet fuel production
Mark E.
Martínez-Klimov
*a,
Olha
Yevdokimova
a,
Päivi
Mäki-Arvela
 a,
Jennifer
Cueto
 b,
Nataliya
Shcherban
 c,
Zuzana
Vajglová
a,
Kari
Eränen
a and
Dmitry Yu.
Murzin
 *a
*a
aJohan Gadolin Process Chemistry Centre, Åbo Akademi University, Henriksgatan 2, Turku/Åbo, 20500, Finland. E-mail: dmurzin@abo.fi
bThermochemical Processes Unit, IMDEA Energy Institute, Avda. Ramón de la Sagra, 3, Móstoles, 28935, Madrid, Spain
cL.V. Pysarzhevsky Institute of Physical Chemistry, NAS of Ukraine, 31 pr. Nauky, Kyiv 03028, Ukraine
First published on 21st November 2023
Abstract
A series of extrudates composed of platinum, zeolite H-Beta-25 and Bindzil as a binder were tested in the hydrodeoxygenation of isoeugenol in a continuous trickle-bed reactor to produce propylcyclohexane, a compound within the hydrocarbon range of jet fuel. All catalytic tests were performed at 30 bar of hydrogen, with a gas flow rate of 40 mL min−1, and a liquid flowrate of 0.5 mL min−1 of a mixture of isoeugenol in dodecane (0.012 M). Screening of the catalysts was performed at 150 °C to determine the effect of the metal location, catalyst acidity and the platinum particle size. A higher conversion (53%) and the propylcyclohexane yield (39%) were obtained when Pt was located on both zeolite and the binder, while platinum located on the binder resulted in a lower activity (49% dihydroeugenol conversion and 30% propylcyclohexane yield). The effect of temperature on activity and catalyst deactivation was determined using the catalyst with platinum supported on both the zeolite and the binder. A range of temperatures between 65 and 200 °C was used with a total time on stream of ca. 30 h showing ca. 10% of deactivation. High dihydroeugenol conversions (ca. 100%) and propylcyclohexane yields (>66%) were obtained at 150 °C.
Introduction
Environmental regulations aimed at reducing pollutants emissions and decrease dependence on the fossil fuels have caused a recent surge in the development of alternative and renewable fuels.1 The transition towards cleaner fuels or technologies is still a major challenge for the aviation industry as battery technologies cannot be implemented due to weight limitations.2 An attainable solution is to derive hydrocarbons from renewable sources, such as biomass, thereby minimizing their environmental impact.3,4Lignocellulosic biomass is a promising option to obtain valuable compounds, such as biofuels, materials, and chemicals through thermochemical or chemical processes.5
Although an attractive, available, and abundant resource, lignocellulosic biomass has yet to make significant commercial progress as a source of chemicals and fuels.
In the recent studies, considerable attention has been given to the valorization of lignin, a complex biopolymer abundant in aromatic and oxygenated moieties. Pyrolysis of lignin produces a mixture of oxygenated compounds known as lignin-derived bio-oil, which needs to be upgraded further as the oxygen moieties limit its use as a fuel directly.6
To overcome the low heating value, high viscosity, and corrosiveness of lignin-derived bio-oil, the oxygen groups must be removed through a process called hydrodeoxygenation (HDO). HDO requires two types of active sites: metal sites to activate hydrogen and acid sites or oxygen vacancies to activate the oxygen moieties found in the bio-oil compounds.7
Phenol, guaiacol, isoeugenol, and vanillin are among the most studied model molecules for HDO, as they can represent the phenolic compounds found in bio-oil.8 Isoeugenol is of particular interest as it has similar functional groups which resemble the phenylpropane units constituting lignin. An additional benefit is that the HDO product of isoeugenol is propylcyclohexane,9 which falls within the hydrocarbon range suitable for jet fuel.
The utilization of the existing infrastructure is key to make renewable jet fuel a viable alternative to fossil-derived fuels. For this reason, it needs to possess similar properties to conventional jet fuel. The main components of fossil-derived jet fuel consist primarily of diverse alkanes, alkenes, cycloalkanes, and aromatics hydrocarbons, ranging from C8 to C16.10,11
Noble metals (Pt, Ru, and Pd) deposited on a variety of supports (zeolites, metal oxides, carbon) have shown to be highly active in the HDO of organic molecules.12 However, recent developments in HDO catalysts have also explored the utilization of more affordable transition metals such as Ni, Co, Mo and even Fe.13,14
Zeolites have garnered significant attention as supports and catalysts for a wide range of applications, mainly due to their inherent acidity, high thermal stability and developed porosity.15 They are mainly employed in petroleum refining processes such as isomerization, alkylation, and cracking reactions.16 Zeolites can be found either in nature or synthesized, allowing for the adjustment of their acid characteristics mainly by varying Si![[thin space (1/6-em)]](https://www.rsc.org/images/entities/char_2009.gif) :
:![[thin space (1/6-em)]](https://www.rsc.org/images/entities/char_2009.gif) Al ratios thus enabling their use for specific applications.17
Al ratios thus enabling their use for specific applications.17
While catalyst forming operations are of immense importance for industry, interest in developing shaped catalysts (granules, extrudates) in academia was very limited. There has been, however, a recent surge also in academia to develop shaped catalysts with the intention of bridging the gap between laboratory-scale research and industrial applications.18,19 Continuous systems applied in industry demand the application of shaped catalysts to reduce the pressure drop.20 For this reason, it is fundamental to understand shaping processes as well as the interactions between components of a catalyst matrix.
Extrudates are composed of a mixture of various materials that not only function as the catalytically active phase, but also facilitate catalyst shaping and provide the mechanical strength. This matrix of materials usually includes a metal, a support, and a binder.19 The latter, typically alumino-silicate clays, aid in catalyst shaping and mechanical strength, yet studies of their effect on catalytic activity or other physical properties remain largely unexplored in academic research as already mentioned.
Several studies focused on hydroconversion reactions have examined the significance of active site proximity in catalysts that incorporate a binder. Results from the previous research strongly indicate that a close proximity between Pt and Beta zeolite resulted in higher conversion and C6 selectivity in hydroisomerization of n-hexane when using Pt supported on H-Beta-25 and bentonite extrudates.21 In contrast, in hydroisomerization of n-heptane using catalysts consisting of zeolite ZSM-22, mordenite, and γ-alumina binder, the proximity between active sites was unfavorable for selectivity, leading to the undesired cracking reactions.18 These findings emphasize the importance of investigating the effects of sites proximity.
A recent study from our group focused on the HDO of isoeugenol in a batch reactor using a catalyst matrix consisting of platinum, zeolites Beta-300 and Beta-25 and Bindzil as a binder was aimed at understanding the effect of acidity, binder addition, and the metal location. The results demonstrated that high isoeugenol conversions and propylcyclohexane yields were obtained for the catalyst where Pt was supported on a more acidic zeolite H-Beta-25 and Bindzil. However, higher selectivity to propylcyclohexane and mass balance in the liquid phase compared to H-Beta-25 were reached for the catalysts that included H-Beta-300.22
In the current work, hydrodeoxygenation of isoeugenol was performed in a trickle-bed reactor over a series of shaped bifunctional catalysts comprising platinum, zeolite H-Beta-25 and Bindzil. Zeolite H-Beta-25 was selected due to its high acidity, commercial availability, and a suitable pore size, while Bindzil was used as a binder to facilitate catalyst shaping.23 The purpose of the current work is to determine the effect that the addition of the binder has on the mechanical and chemical properties of the extrudates. The effect of the proximity between metal and acid sites was conducted by changing the deposition location of platinum; Pt was loaded alternatively on H-Beta-25, on Bindzil or on both. In addition, the effect of temperature and catalyst stability were studied.
Experimental
Reagents
Zeolite NH4-Beta-25 was obtained from Zeolyst International (SiO2/Al2O3 = 25). Binder Bindzil-50/80 (50% colloidal SiO2 in H2O) was supplied by AzkoNobel. The organic binder was methylcellulose (viscosity: 4000 cP, Sigma-Aldrich). Tetraamine platinum nitrate ([Pt(NH3)4](NO3)2, Sigma-Aldrich, ≥50.0% Pt basis) was applied as the platinum precursor. Isoeugenol (Sigma Aldrich, 98%, mixture of cis and trans) and n-dodecane (Acros Organics, 99%) were used for the catalytic reactions.Catalyst preparation
Three types of extrudates were prepared, all containing 2 wt% of Pt, 69 wt% of zeolite H-Beta-25 and 29 wt% of Bindzil. These catalysts are differentiated by the platinum location. The catalyst notation was as follows; Pt/EZB when platinum (Pt) was deposited on both zeolite (Z) and the binder (B), Pt/EZ when platinum was located only on the zeolite, and Pt/EB when platinum was only on the binder. The E indicates that all catalysts were shaped as extrudates, therefore, Pt/E will be used when referring to all catalysts presented in the current work.The general preparation procedure has been thoroughly described in the previous publications.21,22,24,25 First, the zeolite NH4-Beta-25 was transformed into its proton form, H-Beta-25, by two-step calcination in air, heating first at 250 °C for 50 min followed by 400 °C for 4 h, using a heating ramp of 4 °C min−1 for both steps. Deposition of platinum was done using the evaporation-impregnation method with [Pt(NH3)4](NO3)2 as a precursor, considering a nominal metal loading of 2 wt% for all catalysts.
General synthesis steps for the different catalysts before shaping are the following ones:
Pt/EZB – Pt deposited on both H-Beta-25 and Bindzil: a mixture of H-Beta 25 and Bindzil (70![[thin space (1/6-em)]](https://www.rsc.org/images/entities/char_2009.gif) :
:![[thin space (1/6-em)]](https://www.rsc.org/images/entities/char_2009.gif) 30) was stirred in water (80% water to 20% mixture) at room temperature for 24 h, followed by evaporation of water under vacuum, drying at 100 °C for 7 h and calcination at 500 °C. Pt was deposited by evaporation-impregnation, followed by reduction in a U-shaped glass reactor under hydrogen flow (40 mL min−1, Woikoski, 99.999%) at 350 °C for 3 h and a heating rate of 2 °C/min.
30) was stirred in water (80% water to 20% mixture) at room temperature for 24 h, followed by evaporation of water under vacuum, drying at 100 °C for 7 h and calcination at 500 °C. Pt was deposited by evaporation-impregnation, followed by reduction in a U-shaped glass reactor under hydrogen flow (40 mL min−1, Woikoski, 99.999%) at 350 °C for 3 h and a heating rate of 2 °C/min.
Pt/EZ – Pt deposited on H-Beta-25: platinum was first deposited on the zeolite followed by reduction (350 °C for 3 h, heating ramp of 2 °C/min.) under 40 mL min−1 of hydrogen flow (Woikoski, 99.999%). Pt/H-Beta-25 was mixed with Bindzil in water (80% water to 20% mixture) for 24 h. The water was evaporated, and the catalyst was first dried at 100 °C and then calcined at 500 °C.
Pt/EB – Pt deposited on Bindzil: Bindzil was dried prior to deposition of Pt, followed by its reduction under hydrogen flow (40 mL min−1, Woikoski, 99.999%) at 350 °C for 3 h with a heating ramp of 2 °C min−1. Thereafter, it was mixed in water H-Beta-25 (80% water to 20% mixture), followed by drying and calcination of the catalyst at 500 °C.
Shaping of the catalysts was performed in an extrusion device (TBL-2, Tianjin Tianda Beiyang Chemical Co. Ltd., China) after all the components were mixed and dried. For this, a suspension composed of the catalyst mixture, distilled water and methylcellulose was prepared with a wt. ratio of 44.5/54.5/1.0, respectively. The resulting extrudates exhibited a cylindrical shape with a diameter of 1.4 mm and ca. 1 cm of length. After shaping the extrudates were dried at 100 °C and calcined at 400 °C.
Physicochemical characterization
Transmission Electron Microscopy (TEM, JEM-1400Plus, JEOL, Japan) was used to determine the platinum particle sizes. Fresh catalysts were reduced ex-situ in a glass reactor under a hydrogen flow of 40 mL min−1 and heating of 350 °C for 2 h. The spent catalysts were washed with acetone prior to their analysis. The extrudates were crushed, suspended in ethanol, and mounted on a copper grid. The average metal particle sizes were determined by measuring ca. 150 particles using the ImageJ software.Brønsted and Lewis acid sites of the catalysts were quantified using Fourier transform infrared spectroscopy of adsorbed pyridine (Py-FTIR, ATI Mattson FTIR Infinity Series) using the molar extinction coefficients reported in the literature.26 Determination of weak, medium, and strong acid sites was done by desorbing pyridine at 250, 350, and 450 °C, respectively. Measurements, however, were taken at 100 °C. Pellets of ca. 20 mg and 1 cm of diameter were prepared for each material analyzed.
The catalyst metal loading was determined by inductively coupled plasma atomic emission spectrometry (ICP-AES, Goffin Meyvis Spectro Cirusccd) by dissolving ca. 100 mg of the catalysts in aqua regia (9 mL HCl 30% + 3 mL HNO3 65%) under microwave digestion for 1 hour.
Nitrogen physisorption (Micrometrics 3Flex-3500) was used to determine the textural properties of fresh and spent catalysts. The specific surface areas were determined by the BET and Dubinin–Radushkevich methods. Pore size distributions were determined using the non-local density functional theory method (NL-DFT). The samples were degassed twice prior to the analysis. Ex situ outgassing was done in a Micromeritics VacPrep 061 Sample Degas System under vacuum at 200 °C for 20–24 h, followed by in situ degassing for 5 h at 250 °C.
Crush tests (Crush tester SE 048, Lorentzen & Wettre) were performed to measure the mechanical strength of the extrudates in both vertical and horizontal positions. Ca. 10 extrudates were analyzed per position.
Temperature-programmed reduction (TPR, Microtrac Belcat II) was performed to determine the reduction temperature and hydrogen consumption of the fresh catalysts. For each measurement, around 30 mg of the catalyst was loaded in a quartz reactor and pretreated in situ at 200 °C for 2 h under argon flow to remove excess moisture. The analysis was performed under a 5% H2/Ar flow from 35 °C until 800 °C with a temperature ramp of 10 °C min−1.
Temperature-programmed oxidation (TPO, Microtrac Belcat II) of the spent catalysts was used to determine the quantity of carbonaceous deposits. The spent catalysts (ca. 30 mg) were loaded in a quartz reactor and pretreated in situ at 200 °C for 2 h under argon flow. The analysis was performed under a 5% O2/Ar flow from 35 °C until 865 °C with a temperature ramp of 10 °C min−1.
Catalytic tests of hydrodeoxygenation of isoeugenol in trickle-bed reactor
Hydrodeoxygenation of isoeugenol was performed in a trickle-bed reactor equipped with a high-performance liquid chromatography (HPLC) pump (Knauer Smartline Pump 100).The reactor was 12 cm in length with an inner diameter of 1.2 cm and a catalyst zone of 7 cm. The catalysts were mixed with 15 g of fine granular quartz (200–800 μm) to have a uniform distribution throughout the catalytic bed.
The catalysts were reduced in situ before the reaction. The system was flushed with an Ar flow (AGA, 99.999%) of 50 mL min−1 prior to the reduction. The in situ reduction was carried out at 350 °C for 180 min, with a heating ramp of 10 °C min−1, under a continuous hydrogen flow (AGA, 99.999%) of 40 mL min−1.
A mixture of isoeugenol in dodecane (0.012 M) was used for the catalytic tests. Reaction conditions were chosen based on the previous work.22,27
After the catalyst reduction, the system was pressurized to 30 bars with hydrogen and heated to reach the reaction temperature with a ramp of 10 °C min−1.
For the catalyst screening, the reactions were performed at 150 °C, with a heating ramp of 10 °C min−1. The system was pressurized to 30 bar of H2 (AGA, 99.999%) and liquid and gas flow rates were of 0.5 mL min−1 and 40 mL min−1 were applied, respectively. The amount of catalyst for these tests was 0.4 g.
The effect of temperature was tested with catalyst Pt/EA, increasing the catalyst amount to 1 g. These reactions were performed in a temperature range between 65–200 °C while the other conditions were kept the same.
Downflow feeding of the reaction mixture started after the reaction temperature was reached. The samples were analyzed by GC (Agilent Technologies 6890N) and GC/MS (Agilent Technologies 6890) both equipped with a DB-1 capillary column (Agilent 122-103e, 30 m length, 250 μm internal diameter and 0.5 μm film thickness) using helium as a carrier gas. The temperature program employed for both chromatographs was: 60 °C (5 min), 3 °C min−1 to 135 °C, and 15 °C min−1 to 300 °C.
Results and discussion
Catalyst characterization
Results from ICP-AES, pyridine FTIR, nitrogen physisorption and crush tests have been reported in the previous publication21 and will be briefly mentioned here. ICP was also applied for determination of Pt content in the spent catalysts and the reaction samples.A summary of the catalysts used in the current work, as well as the Pt loadings and metal particle sizes is presented in Table 1.
| Catalyst | Platinum deposition location | Nominal Pt loading (wt%) | Real Pt loadinga (wt%) | Fresh catalyst metal particle size (nm) | Dispersion (%) | Spent catalyst metal particle size (nm) |
|---|---|---|---|---|---|---|
| a Values take from ref. 21. | ||||||
| Pt/EZB | On both | 2 | 2.0 | 2.9 | 37 | 4.3 |
| Pt/EZ | On zeolite | 2 | 2.3 | 3.9 | 27 | 4.8 |
| Pt/EB | On binder | 2 | 1.7 | 5.5 | 20 | 9.3 |
From Table 1, it can be observed that the real platinum loadings determined by ICP-AES were near the nominal value of 2% for all catalysts.
Pt content remained the same for the spent catalysts, moreover Pt content in the liquid samples of the reaction was below the detection limit. These results indicate that platinum was not leached from the catalyst into the reaction mixture.
Platinum particle sizes, determined by transmission electron microscopy (Fig. 1), varied in the range of 2.9–5.5 nm for the fresh catalysts. In accordance with the previous work,22 the metal particle sizes were larger (5.5 nm) for the catalyst where Pt was deposited only on Bindzil (Pt/EB), which could be due to weaker interactions between the non-acidic binder and the Pt particles, leading to agglomeration. Platinum particles were smaller for the catalyst Pt/EZB (2.9 nm), where Pt was deposited on both zeolite and binder, resulting in a better distribution of the metal.
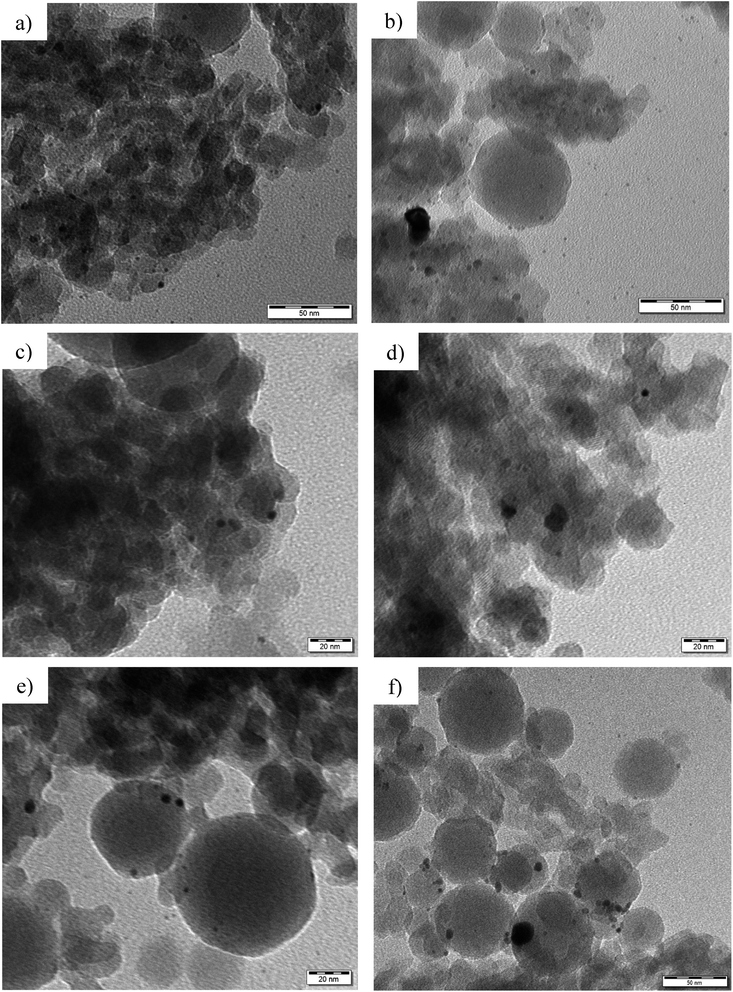 | ||
| Fig. 1 TEM micrographs of (a) fresh and (b) spent Pt/EZB, (c) fresh and (d) spent Pt/EZ, and (e) fresh and (f) spent Pt/EB catalysts. | ||
Dispersion for the fresh catalysts was calculated using the formula dPt = 108/D(%),28 where dPt is dispersion of platinum and D is the diameter of the metallic particles (nm).
Metal dispersion decreased in the following trend Pt/EZB > Pt/EZ > Pt/EB.
TEM micrographs of the spent catalysts are shown in Fig. 1 and the corresponding average metal particle sizes are also presented in Table 1. A slight increase in the metal particle size was observed for spent catalysts, indicating that agglomeration occurred during the catalytic reactions. TEM images could also help to distinguish the binder particles from those of H-Beta-25, as Bindzil displays a characteristic round shape with sizes ranging between 30 and 200 nm.
Specific surface area, the pore size distribution, and the pore volumes of the fresh and spent catalysts, as well as the pure zeolite and binder, were determined by nitrogen physisorption. The results are summarized in Table 2 while the adsorption–desorption isotherms and NL-DFT pore-size distributions for the fresh and spent catalysts are presented in Fig. 2.
| Material | BET SSA (m2 g−1) | Dubinin–Radushkevich SSA (m2 g−1) | V Σ (cm3 g−1) | V MP (cm3 g−1) |
|---|---|---|---|---|
| a values taken from ref. 22. b values taken from ref. 21. | ||||
| H-Beta-25a | 522 | 638 | 0.89 | 0.31 |
| Bindzila | 154 | — | 0.30 | — |
| Pt/EZB (fresh)b | 372 | 460 | 0.64 | 0.19 |
| Pt/EZ (fresh)b | 397 | 488 | 0.67 | 0.19 |
| Pt/EB (fresh)b | 405 | 498 | 0.74 | 0.20 |
| Pt/EZB (spent) | 218 | 317 | 0.44 | 0.11 |
| Pt/EZ (spent) | 184 | 228 | 0.28 | 0.10 |
| Pt/EB (spent) | 257 | 323 | 0.38 | 0.13 |
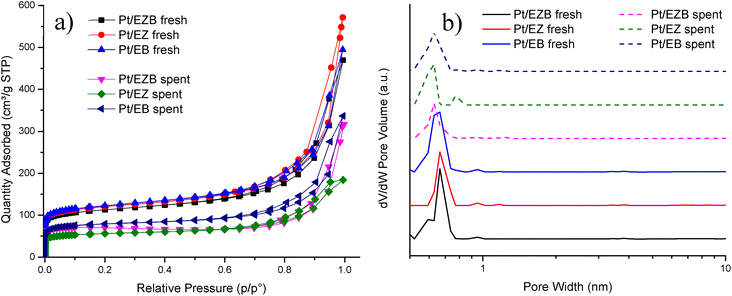 | ||
| Fig. 2 (a) Adsorption–desorption isotherms and (b) pore size distribution of the fresh and spent Pt/E catalysts. | ||
The textural properties of neat H-Beta-25 and Bindzil were also measured to compare with the mixture that comprised the catalysts. The Dubinin–Radushkevich method was used for the comparison due to the microporosity of the zeolitic-based materials which is not considered in the BET method.
It can be initially observed that neat H-Beta-25 has a higher specific surface area (SSA, 638 m2 g−1) compared to the Pt/E catalysts. However, the extrudates contained 69% of the zeolite and 29% Bindzil (SSA = 154 m2 g−1). A theoretical surface area of ca. 490 m2 g−1 for the extrudates calculated as a weight average from the respective surface areas is in line with the values obtained for Pt/E catalysts. Additionally, deposition of Pt could also lead to a decrease in the textural properties by blocking the pores.
The fresh catalysts displayed specific surface areas in the range of 460–498 m2 g−1, as well as the total pore volume (VΣ) of ca. 0.7 cm3 g−1 and a micropore volume (VMP) of ca. 0.2 cm3 g−1. The highest surface area was obtained for Pt/EB catalyst (498 m2 g−1), where Pt was deposited only on the binder while the lowest surface area was recorded for Pt/EZB catalyst (460 m2 g−1), indicating that the introduction of Pt in the zeolite blocks mainly micropores as can be seen from a slight shift in the pore size distribution maxima for catalysts Pt/EZB and Pt/EZ towards smaller pore sizes (Fig. 2b), additionally decreasing the specific surface area and pore volume.
The textural properties of the spent catalysts displayed a noticeable decrease when compared to the fresh catalysts, giving a two-fold decrease, with SSA values in the 228–323 m2 g−1 range. The same trend was observed for the total pore volume (0.3–0.4 cm3 g−1) and the micropore volume (ca. 0.1 cm3 g−1). This could be caused by blocking of zeolite micropores by coke formed during the reaction, as spent Pt/EZ displayed the lowest surface area (228 m2 g−1) among the tested catalysts, correlating with the TPO results, as this catalyst also displayed the highest TPO area (Table 4, Fig. 4).
A comparison of the adsorption–desorption isotherms between the fresh and spent Pt/E catalysts is illustrated in Fig. 3a. All catalysts display type I isotherms which are characteristic of microporous materials and H3 hysteresis.29 A noticeable difference in the isotherms between the fresh and spent catalysts could be observed, which resulted in the decrease of the nitrogen uptake of spent catalysts. This decrease attributed to the formation of carbonaceous deposits after the reaction.
NL-DFT pore size distributions (Fig. 2b) showed a main peak between 0.6 and 0.7 nm, for all catalysts, indicating microporosity. No significant changes were observed for the spent catalysts compared to the fresh ones in terms of the mean pore size.
The type, strength and concentration of acid sites of the catalysts, as well as of the starting H-Beta-25 and Bindzil were determined by pyridine FTIR (Table 3).
| Catalyst | Brønsted acid sitesa (BAS, μmol g−1) | Lewis acid sitesa (LAS, μmol g−1) | Total acid sites (μmol g−1) | BAS/LAS | ||||||
|---|---|---|---|---|---|---|---|---|---|---|
| W | M | S | W | M | S | BAS | LAS | Total | ||
| a Desorption of pyridine was performed at 250, 350, and 450 °C to determine the weak (W), medium (M), and strong (S) acid sites, respectively; measurements were done at 100 °C. b Values taken from ref. 22. c Values taken from ref. 21. | ||||||||||
| H-beta-25b | 67 | 33 | 129 | 26 | 5 | 6 | 229 | 37 | 266 | 6.2 |
| Bindzilb | 12 | 0 | 0 | 3 | 0 | 0 | 12 | 3 | 15 | 4 |
| Pt/EZBc | 62 | 2 | 3 | 1 | 1 | 0 | 67 | 2 | 69 | 33.5 |
| Pt/EZc | 42 | 0 | 1 | 3 | 0 | 0 | 43 | 3 | 46 | 14.3 |
| Pt/EBc | 49 | 5 | 7 | 1 | 1 | 0 | 61 | 2 | 63 | 30.5 |
Neat H-Beta-25 displayed the highest acidity, while Bindzil contained the lowest amount of acid sites. A decrease in acidity for all catalysts was expected after deposition of Pt and addition of Bindzil in the mixture. The catalyst Pt/EZB displayed the most acid sites, followed by Pt/EB. Pt/EZ catalyst where Pt was located only on the zeolite, exhibited the lowest acidity, which could suggest interactions between Pt and the acid sites of the zeolite, as previously reported.22 Additionally, all extrudate catalysts featured low amounts of Lewis acid sites when compared to the initial zeolite, as observed in the increase of the BAS/LAS ratios (Table 3).
Crush tests were performed to determine the mechanical strength of the extrudates. The mechanical strength results, as well as the peak areas for the TPR of the fresh catalysts and TPO of spent ones are given in Table 4.
As presented in Table 4, the catalysts displayed a vertical mechanical strength of 2.9–4.4 MPa and a horizontal mechanical strength of 0.7–1.2 MPa. The catalyst with the highest strength was Pt/EZB (4.4 and 1.2 MPa in the vertical and horizontal position, respectively), where Pt was located on both the zeolite and the binder. The catalyst with lowest mechanical strength was Pt/EB (2.9 MPa for vertical and 0.7 MPa for horizontal position), which as discussed in the previous work, could be caused by a larger intracrystalline void space between the particles.21
The mechanical strength obtained for Pt/E is within the range for similar types of catalysts reported in the literature; TS-1 zeolite and sepiolite extrudates displayed horizontal and vertical strengths of 1.78 and 2.44 MPa, respectively.30 Beta-25 and bentonite extrudates showed slightly higher mechanical strengths, within 3.8–7.8 MPa.25 Similarly, extrudates composed of X13 zeolite and various binders exhibited higher mechanical strengths (2.5 to 7.6 MPa).31 These tests reinforce the importance of the chemical interactions between the different components that constitute the extrudates.
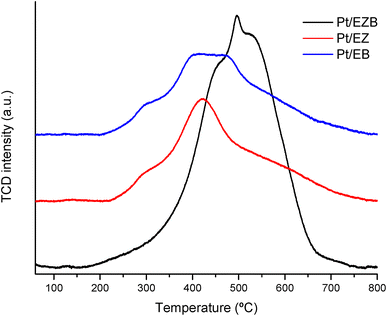
Temperature programmed reduction of the fresh catalysts was performed to determine the effect of the platinum location on its reduction. The reduction profiles for the fresh catalysts are displayed in Fig. 3, while the corresponding integrated areas are presented in Table 4.
TPR reduction profiles for Pt/EZ and Pt/EB catalysts show a small shoulder at ca. 300 °C and main peak ranging from 350–475 °C. The lack of the reduction peaks at low-temperatures (ca. 100 °C) indicate absence of the PtO species for all catalysts, while reduction peaks between 200–425 °C is usually attributed to PtO2 species.32 Additionally, peaks at temperatures higher than 400 °C have been attributed to strong interactions caused by the formation of Pt-silanol species on zeolite-based catalysts. The results, therefore, indicate that most of Pt is present in the 4+ oxidation state after the catalyst calcination.33
Pt/EZB catalyst exhibited a shift in the reduction temperature (towards 500 °C) indicating stronger interactions between the metal particles and the support. This effect has been attributed to a higher coordination between Pt and oxygen species of the zeolite, making the platinum more difficult to reduce.34
A higher intensity peak for Pt/EBZ, resulting in more than double the consumption of hydrogen when compared to the other catalysts, could be due to a larger amount of Pt particles being available either in the surface or in the pores of the catalyst.
High reduction temperatures indicating strong interactions between Pt particles and the support was also observed by the reduction of strong acid sites after the deposition of Pt, as presented in pyridine FTIR acidity measurements (Table 3).
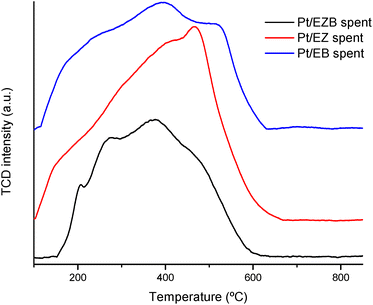
Temperature programmed oxidation was performed to gain an insight on the formation of carbonaceous deposits such as coke on the spent catalysts. The results are presented in Fig. 4 as well as in Table 4.
TPO peak areas presented in Table 4 indicate that Pt/EZB catalyst had the lowest formation of carbonaceous species after the reaction. On the other hand, Pt/EZ exhibited larger amounts of carbon deposits, which could negatively impact its catalytic activity, as seen in Fig. 5 and Table 5. Additionally, these results were also reflected in a noticeable decrease of the textural properties, as determined by nitrogen physisorption, between the fresh and spent Pt/EZ catalysts (Table 2, Fig. 2).
| Catalyst | IE conversiona (%) | DH conversiona (%) | GCLPAa,b (%) | PCH yielda (%) | TOF (h−1) |
|---|---|---|---|---|---|
| a Values determined at steady state. b Gas Chromatography Liquid Phase Analysis (GCLPA) is the mass balance considering only the reactants and products in the liquid phase. | |||||
| Pt/EZB | 100 | 53 | 81 | 39 | 12.6 |
| Pt/EZ | 100 | 51 | 70 | 35 | 16.8 |
| Pt/EB | 100 | 49 | 90 | 30 | 21.6 |
The TPO profiles display wide peaks, which indicate the presence of different types of carbonaceous deposits. As reported in the literature, a first peak at ca. 200 °C is ascribed to reaction intermediates. A second peak in the range of 350–400 °C can be associated to side polymeric compounds or active carbon species,35 while a peak at higher temperatures, closer to 600 °C could be assigned to graphite and/or amorphous carbons.36
Catalytic tests in a trickle-bed reactor
Testing of the catalysts in hydrodeoxygenation (HDO) of isoeugenol (IE) was performed in a trickle-bed reactor at 150 °C at 30 bar of H2 with liquid flow of 0.5 mL min−1 and the gas flow of 40 mL min−1. The amount of catalyst for these tests was 0.4 g.Scheme 1 shows an overall reaction network for this reaction as determined in this and previous studies. First isoeugenol (IE) is converted into dihydroeugenol (DH) through hydrogenation of the double bond of the propene group, which was reported as the fastest reaction. Followed by hydrogenation of the aromatic ring, resulting in 2-methoxy-4-propylcyclohexanol, a hydrogenated intermediate (HYD) with oxygen still in its structure. Subsequent dehydration and demethoxylation give the desired oxygen-free product, propylcyclohexane (PCH).37
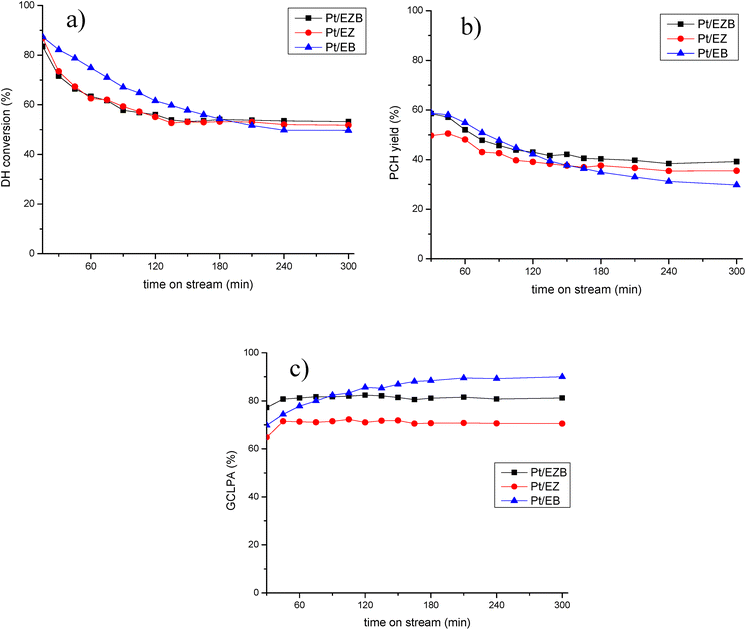
The catalytic results for Pt/E catalysts are presented in Table 5 and in Fig. 5.
All catalysts exhibited 100% conversion of isoeugenol. As reported previously, this transformation occurs rapidly, hence the conversion of dihydroeugenol was monitored.22 Different catalysts displayed a similar behavior regarding DH conversion, ca. 50%. The catalyst with the highest conversion was Pt/EZB (53%), while somewhat lower was recorded for Pt/EB (49%).
GCLPA (Gas Chromatography Liquid Phase Analysis) is an approximation for the mass balance of the compounds in the liquid phase and is determined by adding all the compounds obtained from the GC analysis, as gases and heavy products, such as dimers, trimers, etc. are not quantified. As expected, GCLPA values decrease with an increase in the conversion of dihydroeugenol, which is the result of the formation of products in the gas phase, such as water or methanol, or coke on the surface of the catalyst. The catalyst with the highest GCLPA was Pt/EB (90%), however, this catalyst also displayed the lowest DH conversion (49%). Interestingly, Pt/EZB and Pt/EZ catalysts exhibited different GCLPA values (81% and 70%, respectively) despite having similar DH conversion (ca. 50%). This difference could be attributed to the formation of oligomerization products, which is reflected in the TPO results of spent catalysts (Fig. 4, Table 4).
Additional differences between the catalysts can be seen in the formation of the desired product; namely, the propylcyclohexane yield was the highest for the Pt/EZB catalyst (39%) and the lowest for Pt/EB (30%). Hinting at the importance of the proximity between acid sites and the metal particles.
Time-on-stream behavior for dihydroeugenol (DH) conversion, propylcyclohexane (PCH) yield and GCLPA is displayed in Fig. 5. Less prominent decline in the catalytic performance for Pt/EZB probably connected with both more stable work of small Pt nanoparticles and their proximity with acid sites should be noted.
As reported in our previous publications,21,22 catalytic activity was improved when Pt was located on the zeolite, and not on the non-acidic Bindzil, in other words, closer proximity between the acid sites of the zeolite and the platinum particles was beneficial.
Minimal solvent cracking was observed under the reaction conditions used, as formation of the cracking-related products for n-dodecane was below 0.1%.
Catalyst acidity did not seem to directly influence the yield of propylcyclohexane, as the catalyst with the lowest acidity (Pt/EZ, total acid sites = 46 μmol g−1, Table 3) displayed an intermediate PCH yield (35%), however, acidity influenced the side reactions, as the same spent catalyst (Pt/EZ spent) displayed a larger amount of carbonaceous deposits, as can be seen in TPO (Table 4).
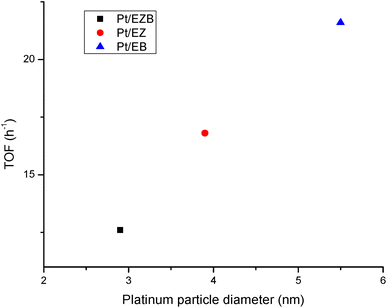
TOF values were calculated considering conversion of dihydroeugenol (Table 5) and platinum dispersion as determined by Pt particle sizes (Table 1). A high TOF obtained for Pt/EB catalyst (21.6 h−1) could be explained by the structure-sensitive nature38 of the hydrogenolysis reaction, where larger Pt clusters result in a higher activity.
This is further illustrated in Fig. 6, where a clear trend between TOF and platinum particle size can be observed. A potential explanation for this effect is related to a larger space available on larger cluster need for accommodation of a bulky reagent. Similar dependences have been reported in the literature for transformations of bulky organic compounds.39,40
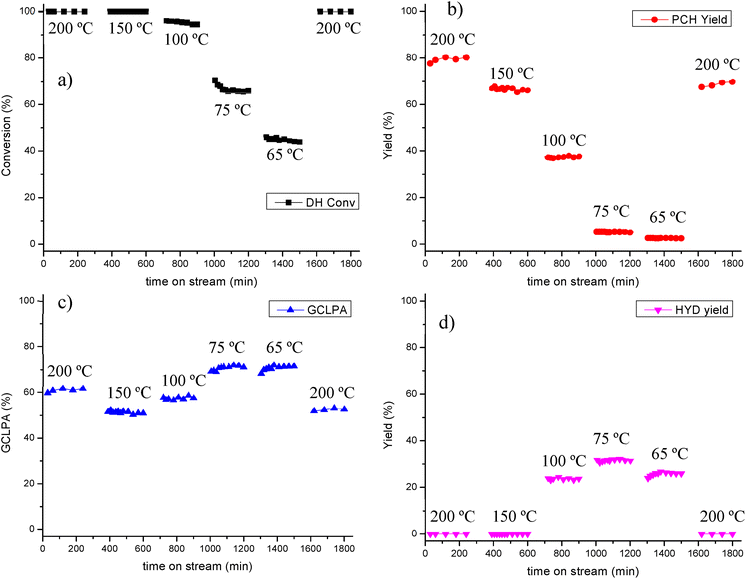
The effect of the reaction temperature on hydrodeoxygenation of isoeugenol was tested using Pt/EZB catalyst, which displayed higher catalytic activity, compared to other materials. The results are illustrated in Table 6 and Fig. 7. These reactions were performed in the same trickle-bed reactor, varying the temperature between 65 and 200 °C. The other conditions were maintained the same as in preliminary catalyst testing.
| Temperature (°C) | DH conversiona (%) | GCLPAa,b (%) | PCH yielda (%) | HYD yielda (%) |
|---|---|---|---|---|
| a Values determined at steady state. b Gas Chromatography Liquid Phase Analysis (GCLPA) is the mass balance for reactants and products in the liquid phase. | ||||
| 200 | 100 | 61 | 80 | 0 |
| 150 | 100 | 51 | 66 | 0 |
| 100 | 95 | 58 | 38 | 24 |
| 75 | 65 | 72 | 5 | 32 |
| 65 | 44 | 71 | 3 | 26 |
| 200 | 100 | 53 | 70 | 0 |
In a comparable manner as in the catalyst screening, 100% conversion of isoeugenol was achieved at all temperatures as double bond hydrogenation is a very fast reaction, while DH conversion decreased accordingly with the reaction temperature.
GCLPA values decreased between 200 and 150 °C (from 61% to 51%), despite the same conversion, which could be a first indication of catalyst deactivation. GCLPA increased after lowering further the temperature from 100 °C (58%) to 75 and 65. °C (ca. 71%).
The yield of propylcyclohexane was the highest at 200 °C (80%) decreasing considerably at lower temperature, being at its lowest (5 and 3%) at 75 and 65 °C, indicating that deoxygenation does not take place at such low temperatures. Instead, hydrogenation of the aromatic ring was predominant, as observed by the formation of 2-methoxy-4-propylcyclohexanol, the HYD product. These findings have also been reported in previous works.27,41
HYD yield increased from 24% at 100 °C to 32% at 75 °C, however, it decreased again to 26% at 65 °C, due to low overall catalytic activity at this temperature (44% DH conversion).
Returning to the initial temperature of 200 °C after testing catalytic activity at lower T (Fig. 7) confirms that deactivation of the catalyst took place during the testing, as both GCLPA and PCH yield decreased ca. 10% each GCLPA from 61 to 53% and PCH yield from 80% to 70%.
The catalyst effectiveness factor was calculated to determine the extent of mass transfer limitations when using extrudates, employing the following equation:28
 | (1) |
Eqn (1) implicitly assumes, that the batch reactor data were obtained in the kinetic regime, which is justified by efficient stirring and small catalyst particle sizes applied in that study.22 The rates were determined at 200 °C using Pt/EZB catalyst. The data in the batch reactor were reported previously.22 The catalyst effectiveness factor calculated from eqn (1) was ηeff = 0.17, indicating that there are significant mass transfer limitations, as expected for shaped catalysts in a trickle bed reactor.
In our previous work the HDO of isoeugenol was carried out using bimetallic platinum-rhenium catalysts supported on mesoporous carbon (1 mm granules, 0.3 g of catalyst, 4 wt% Pt and 4 wt% Re) under similar conditions using the same continuous reactor system.27 The results are summarized in Table 7.
| Temperature (°C) | IE conversiona (%) | DH conversiona (%) | GCLPAa,b (%) | PCH yielda (%) | HYD yielda (%) |
|---|---|---|---|---|---|
| a Values determined at steady state. b Gas Chromatography Liquid Phase Analysis (GCLPA) is the mass balance considering reactants and products in the liquid phase. | |||||
| 200 | 100 | 100 | 76 | 90 | 7 |
| 170 | 100 | 100 | 80 | 46 | 44 |
| 150 | 100 | 100 | 85 | 10 | 78 |
| 75 | 100 | 70 | 94 | 0 | 61 |
Comparing the results obtained with Pt/EA used in the current work and previous studies with PtRe/Sibunit it can be concluded that dihydroeugenol conversion is similar at the corresponding temperatures (e.g. 65% for Pt/EZB and 70% for PtRe/Sibunit at 75 °C). However, several differences are evident, especially in GCLPA values as well as PCH and HYD yields.
GCLPA values were higher when using the carbon-supported catalyst, which could be due to its low acidity, resulting in less prominent side by-product formation compared to zeolite-based catalysts. In addition, propylcyclohexane yield was higher for PtRe/Sibunit than for Pt/EZB at 200 °C (90% vs. 80%), however, at 150 °C, Pt/EZB exhibits over six times higher PCH yield (10% vs. 66%). Formation of the hydrogenated intermediate is also higher for the bimetallic PtRe catalyst throughout the whole temperature range (7–61%), indicating that deoxygenation was not as prevalent at temperatures lower than 200 °C. Even though Pt/EZB displayed a similar propylcyclohexane yield at 100 °C (ca. 40%) as PtRe/Sibunit at 170 °C (46%), the bimetallic carbon-supported catalyst is three-fold more active at higher temperatures, which can be related to mass transfer limitations with extrudates applied in this work.
An apparent activation energy was calculated for hydrodeoxygenation of isoeugenol at 65–100 °C performed in the continuous reactor using Pt/EZB catalyst with the Arrhenius plot presented in Fig. 8. An apparent activation energy of 24 kJ mol−1 along with visible changes in the slope upon the elevation of temperature indicate the presence of mass-transfer limitations when using extrudates, as confirmed by the catalyst effectiveness factor. This value was very close to the one reported for PtRe/Sibunit (15 kJ mol−1).27
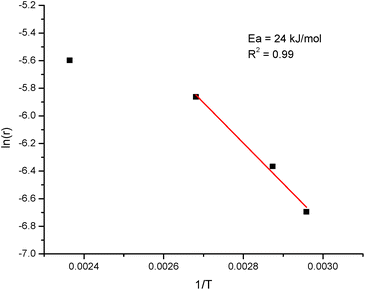 | ||
| Fig. 8 Arrhenius plot for the hydrodeoxygenation of isoeugenol on extrudates comprised of platinum, zeolite H-Beta-25 and Bindzil as the binder. | ||
Conclusions
Extrudates comprising of 69 wt% of zeolite H-Beta-25, 29 wt% of Bindzil as a binder and 2 wt% of platinum were tested in hydrodeoxygenation of isoeugenol in dodecane as a solvent to produce propylcyclohexane in a continuous trickle-bed reactor under 30 bar of hydrogen at 65–200 °C. A screening of catalysts at 150 °C was performed to determine the effect of the platinum location, which was deposited either on the zeolite, on the binder or on both, resulting in changes in the catalytic activity. Although all catalysts displayed similar dihydroeugenol conversion (ca. 50%), a higher propylcyclohexane yield was obtained when Pt was located on both zeolite and binder (39%), while deposition of platinum on the non-acidic binder resulted in lower activity (30%). Furthermore, minimal solvent cracking was observed under these conditions, less than 0.1%.The catalyst with a lower amount of acid sites, where platinum was located only on the zeolite, exhibited a lower mass balance in the liquid phase, which was attributed to a higher formation of carbonaceous species, as confirmed by temperature programmed oxidation of the spent catalysts.
Therefore, a close arrangement between metal and acid sites can be considered a key factor determining catalytic performance of zeolite-supported metal nanoparticles in the hydrodeoxygenation of isoeugenol.
The catalyst where platinum was located on both zeolite and binder was selected to determine the effect of temperature on the reaction in the range of 65–200 °C with the total time on stream of ca. 30 h. It was found that minor deactivation of ca. 10% was obtained when comparing with the initial reaction at 200 °C. At low temperatures (65 and 75 °C) the hydrogenation of the aromatic ring dominated over deoxygenation. However, complete dihydroeugenol conversions achieved at elevated temperatures resulted in high propylcyclohexane yields (80 and 66% at 200 and 150 °C, respectively). Determination of the catalyst effectiveness factor (0.17) and a low value of the apparent activation energy of 24 kJ mol−1 demonstrated significant mass transfer limitations.
Conflicts of interest
There are no conflicts to declare.Acknowledgements
The authors would like to acknowledge the Electron Microscopy Laboratory, Institute of Biomedicine, University of Turku, and Biocenter Finland for access to Transmission Electron Microscopy. This work was supported by the Magnus Ehrnrooth Foundation. N. S. acknowledges the support of the National Research Foundation of Ukraine to the project “New effective zeolite catalysts for environmentally friendly processes of the conversion of renewable raw materials into valuable organic compounds” (project number 2020.02/0335).References
- J. Markard, Nat. Energy, 2018, 3, 628–633 CrossRef.
- J. Kammermann, I. Bolvashenkov, K. Tran, H. G. Herzog and I. Frenkel, Proceedings – ICOECS 2020: 2020 International Conference on Electrotechnical Complexes and Systems, 2020, pp. 1–6 Search PubMed.
- C. B. Field, J. E. Campbell and D. B. Lobell, Trends Ecol. Evol., 2008, 23, 65–72 CrossRef.
- H. Wei, W. Liu, X. Chen, Q. Yang, J. Li and H. Chen, Fuel, 2019, 254 Search PubMed.
- M. S. Singhvi and D. V. Gokhale, Appl. Microbiol. Biotechnol., 2019, 103, 9305–9320 CrossRef CAS PubMed.
- J. Meng, A. Moore, D. Tilotta, S. Kelley and S. Park, ACS Sustain. Chem. Eng., 2014, 2, 2011–2018 CrossRef CAS.
- X. Wang, M. Arai, Q. Wu, C. Zhang and F. Zhao, Green Chem., 2020, 22, 8140–8168 RSC.
- M. Bertero, G. De La Puente and U. Sedran, Fuel, 2012, 95, 263–271 CrossRef CAS.
- G. Lyu, S. Wu and H. Zhang, Front. Energy Res., 2015, 3, 1–11 Search PubMed.
- J. I. Hileman and R. W. Stratton, Transport Policy, 2014, 34, 52–62 CrossRef.
- P. Kallio, A. Pásztor, M. K. Akhtar and P. R. Jones, Curr. Opin. Biotechnol., 2014, 26, 50–55 CrossRef CAS.
- B. Güvenatam, O. Kurşun, E. H. J. Heeres, E. A. Pidko and E. J. M. Hensen, Catal. Today, 2014, 233, 83–91 CrossRef.
- L. Qu, X. Jiang, Z. Zhang, X. G. Zhang, G. Y. Song, H. L. Wang, Y. P. Yuan and Y. L. Chang, Green Chem., 2021, 23, 9348–9376 RSC.
- A. Berenguer, T. M. Sankaranarayanan, G. Gómez, I. Moreno, J. M. Coronado, P. Pizarro and D. P. Serrano, Green Chem., 2016, 18, 1938–1951 RSC.
- X. Fan and Y. Jiao, Porous Materials for Catalysis: toward Sustainable Synthesis and Applications of Zeolites, Elsevier Inc., 2019 Search PubMed.
- N. V. Choudary and B. L. Newalkar, J. Porous Mater., 2011, 18, 685–692 CrossRef.
- E. G. Derouane, J. C. Védrine, R. Ramos Pinto, P. M. Borges, L. Costa, M. A. N. D. A. Lemos, F. Lemos and F. Ramôa Ribeiro, Catal. Rev.: Sci. Eng., 2013, 55, 454–515 CrossRef CAS.
- K. Cheng, L. I. Wal, H. Yoshida, J. Oenema, J. Harmel, Z. Zhang, G. Sunley, J. Zečević and K. P. Jong, Angew. Chem., 2020, 132, 3620–3628 CrossRef.
- K. Yang, D. Zhang, M. Zou, L. Yu and S. Huang, ChemCatChem, 2021, 13, 1414–1423 CrossRef CAS.
- G. T. Whiting, S. H. Chung, D. Stosic, A. D. Chowdhury, L. I. Van Der Wal, D. Fu, J. Zecevic, A. Travert, K. Houben, M. Baldus and B. M. Weckhuysen, ACS Catal., 2019, 9, 4792–4803 CrossRef CAS.
- Z. Vajglová, N. Kumar, M. Peurla, L. Hupa, K. Semikin, D. A. Sladkovskiy and D. Y. Murzin, J. Chem. Technol. Biotechnol., 2021, 96, 1645–1655 CrossRef.
- M. E. Martínez-Klimov, P. Mäki-Arvela, Z. Vajglová, C. Schmidt, O. Yevdokimova, M. Peurla, N. Kumar, K. Eränen and D. Y. Murzin, Top. Catal., 2023, 66, 1296–1309 CrossRef.
- Z. Vajglová, I. L. Simakova, K. Eränen, P. Mäki-Arvela, N. Kumar, M. Peurla, S. Tolvanen, A. Efimov, L. Hupa, J. Peltonen and D. Y. Murzin, Appl. Catal., A, 2022, 629, 1–11 CrossRef.
- Z. Vajglová, N. Kumar, M. Peurla, J. Peltonen, I. Heinmaa and D. Y. Murzin, Catal. Sci. Technol., 2018, 8, 6150–6162 RSC.
- Z. Vajglová, N. Kumar, P. Mäki-Arvela, K. Eränen, M. Peurla, L. Hupa, M. Nurmi, M. Toivakka and D. Y. Murzin, Ind. Eng. Chem. Res., 2019, 58, 18084–18096 CrossRef.
- C. A. Emeis, J. Catal., 1993, 141, 347–354 CrossRef CAS.
- M. E. Martínez-Klimov, P. Mäki-Arvela, Z. Vajglova, M. Alda-Onggar, I. Angervo, N. Kumar, K. Eränen, M. Peurla, M. H. Calimli, J. Muller, A. Shchukarev, I. L. Simakova and D. Y. Murzin, Energy Fuels, 2021, 35, 17755–17768 CrossRef.
- D. Yu. Murzin, Engineering Catalysis, De Gruyter, 2020 Search PubMed.
- G. Leofanti, M. Padovan, G. Tozzola and B. Venturelli, Catal. Today, 1998, 41, 207–219 CrossRef CAS.
- D. P. Serrano, R. Sanz, P. Pizarro, I. Moreno, P. de Frutos and S. Blázquez, Catal. Today, 2009, 143, 151–157 CrossRef CAS.
- A. M. Najafi, S. Soltanali, F. Khorashe and H. Ghassabzadeh, Chemosphere, 2023, 324, 138275 CrossRef CAS.
- B. R. Vieira Dos Santos, M. Montoya Urbina, M. J. B. Souza, A. M. Garrido Pedrosa, A. O. S. Silva, E. V. Sobrinho and R. Velasco Castedo, J. Therm. Anal. Calorim., 2015, 119, 391–399 CrossRef CAS.
- L. W. Ho, C. P. Hwang, J. F. Lee, I. Wang and C. T. Yeh, J. Mol. Catal. A: Chem., 1998, 136, 293–299 CrossRef CAS.
- H. J. Jiang, M. S. Tzou and W. M. H. Sachtler, Appl. Catal., 1988, 39, 255–265 CrossRef CAS.
- Z. Alipour, M. Rezaei and F. Meshkani, J. Ind. Eng. Chem., 2014, 20, 2858–2863 CrossRef CAS.
- S. Wang and G. Q. Lu, J. Chem. Technol. Biotechnol., 2000, 75, 589–595 CrossRef CAS.
- M. Alda-Onggar, P. Mäki-Arvela, K. Eränen, A. Aho, J. Hemming, P. Paturi, M. Peurla, M. Lindblad, I. L. Simakova and D. Y. Murzin, ACS Sustain. Chem. Eng., 2018, 6, 16205–16218 CrossRef CAS PubMed.
- R. A. van Santen, Acc. Chem. Res., 2009, 42, 57–66 CrossRef CAS PubMed.
- U. Sanyal, Y. Song, N. Singh, J. L. Fulton, J. Herranz, A. Jentys, O. Y. Gutiérrez and J. A. Lercher, ChemCatChem, 2019, 11, 575–582 CrossRef CAS.
- R. K. Herz, J. Catal., 1981, 386, 371–386 CrossRef.
- M. Martinez-Klimov, P. Mäki-Arvela, A. Çiftçi, N. Kumar, K. Eränen, M. Peurla, E. J. M. Hensen and D. Yu. Murzin, ACS Eng. Au, 2022, 2, 436–449 CrossRef CAS.
| This journal is © The Royal Society of Chemistry 2024 |

