 Open Access Article
Safe seasonal energy and hydrogen storage in a 1![[thin space (1/6-em)]](https://www.rsc.org/images/entities/h2_char_2009.gif) :
:![[thin space (1/6-em)]](https://www.rsc.org/images/entities/h2_char_2009.gif) 10 single-household-sized pilot reactor based on the steam-iron process†
10 single-household-sized pilot reactor based on the steam-iron process†
Samuel P.
Heiniger‡
 ,
Zhiyuan
Fan‡
 ,
Urs B.
Lustenberger§
 and
Wendelin J.
Stark
 *
*
ETH Zürich, Vladimir-Prelog-Weg 1, 8093 Zürich, Switzerland. E-mail: wendelin.stark@chem.ethz.ch
First published on 29th November 2023
Abstract
Our society is gradually moving from traditional energy sources to renewables. Due to the temporal mismatch between the production and demand of renewables, seasonal energy storage is proposed as a way to bridge the gap and ensure reliable power supply throughout the year. In this article, we demonstrate a seasonal energy storage process based on the redox pair iron/iron oxide, where energy is stored in the form of fine iron powder produced on-site by reducing iron oxide with electrolytic hydrogen, and released by oxidizing iron with steam. We prove its feasibility at a technically relevant scale, in a 1![[thin space (1/6-em)]](https://www.rsc.org/images/entities/char_2009.gif) :
:![[thin space (1/6-em)]](https://www.rsc.org/images/entities/char_2009.gif) 10 scaled-down pilot reactor representing the electricity need of a typical European household. The operating data of the reactor, together with physico-chemical analysis of the iron/iron oxide during this process, and calculated estimation of its investment cost, provide a solid foundation for its future application in the field of energy storage.
10 scaled-down pilot reactor representing the electricity need of a typical European household. The operating data of the reactor, together with physico-chemical analysis of the iron/iron oxide during this process, and calculated estimation of its investment cost, provide a solid foundation for its future application in the field of energy storage.
Introduction
Energy security and self-sufficiency have become a key concern in many countries during the gas shortage and energy crisis caused by the war in Ukraine.1–4 On the other side, the scale of renewable energy sources is growing rapidly, as the principal component of most national strategies to slow down global warming and decarbonize the energy sector.5–9 Globally installed photovoltaic (PV) capacity is expected to grow at a pace of around 9% per year between 2019 and 2050, reaching about 9000 GW by 2050, compared with 480 GW in 2018.10 Unlike traditional energy sources that produce on demand, renewable energy sources (solar, wind) have strong daily and seasonal pattern, depending on their geographic location. In mid- to high-latitude areas, PV production peaks in summer when the solar irradiation is both long and intense, while the energy demand peaks in winter when more heating and lighting is required. If renewables become the major energy source, a large mismatch between demand and production in the course of a year is expected (example using PV data from Switzerland,11Fig. 1a, more countries in Fig. S1†). Without seasonal energy storage, the PV panels would have to be substantially over-built to meet the energy requirements in winter (over 3× the theoretical scale, Fig. 1b) in a hypothetical future energy system powered only by solar PV. As a result, seasonal energy storage has been proposed as a way to connect energy production and demand at a full-year time frame.12–16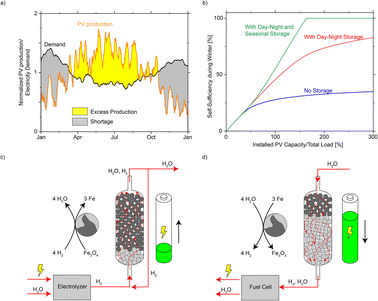 | ||
| Fig. 1 (a) Mismatch between the annual PV production and electricity demand in Switzerland in 2017. The production and demand are both normalized to their annual average values, corresponding to a future situation where production and demand are equal (100% on the horizontal axis in b). (b) Self-sufficiency in winter (defined as the time duration that solar PV and storage could cover the electricity need from Dec to Feb) as a function of installed PV capacity. Three cases are presented: no storage; with day–night storage (e.g. batteries in households); and with both day–night and seasonal storage (detailed calculation in ESI Notes 2–3†). (c and d) Schematic representation of iron-based seasonal energy storage. | ||
There is a rich history of metals used in cyclic redox processes for H2 or energy purposes. As early as 1900, the steam-iron process was commercially used17–19 to produce high-purity H2 from Fe and steam. The resulting iron oxide (FeOx) was regenerated with CO or syngas. The process lost relevance when H2 could be produced more cheaply through steam reforming or water gas shift,20 in the emerging petrochemical industry (1910 onwards). Recently, researchers' interest in this elegant process has been rekindled21–25 due to the rise in the demand for CO-free H2 as needed in fuel cells. Similarly, metal oxides enable efficient chemical looping combustion, which gained research interest due to the ease of CO2 capture:26–30 if a metal oxide is reduced using carbon-based fuel, the off-gas can be directly subjected to CO2 capture without gas separation. The reduced metal can then be re-oxidized using air or steam to close the loop. Among the broad variety of proposed metals, many excel in terms of reactivity if compared with Fe.24,31–37 Steinfeld et al.,16 however, recently provided an in-depth technical analysis confirming Fe as overall the most suitable metal for chemical looping H2 storage and production if compared to Zn, Sn, Ge, W and Mo, in terms of reaction thermodynamics, H2 storage density, resistance to sintering, safety and cost.
Herein, we demonstrate a strategy for seasonal energy storage based on the steam-iron process (Fig. 1c and d).17–19 When electricity is in excess, it is used to produce H2 (typically in an electrolyzer), which is further fed to an electrically heated fixed-bed reactor filled with FeOx and reacts to Fe and H2O. The water is removed to facilitate the reaction until the majority of FeOx has converted to Fe. This process is referred to as “charging” the reactor. When energy is needed, the process runs in reverse, and the reactor is “discharged”: steam is fed to the bed filled with Fe (the loaded reactor) and reacts to FeOx and H2, which is further utilized as an energy source. In this article, we advance the proposal of using Fe as a storage medium using a 1![[thin space (1/6-em)]](https://www.rsc.org/images/entities/char_2009.gif) :
:![[thin space (1/6-em)]](https://www.rsc.org/images/entities/char_2009.gif) 10 scaled-down pilot reactor, representing the electricity need of a typical single-family house in central Europe. We use a 0.21 m3 stainless steel reactor with gas manifolds and electrical shell heating to study its charging and discharging characteristics. The active Fe powder is further compared to wood dust and other metal dusts about their dust explosion risks, and its accidental release was investigated by deliberately exposing kg-scale of active Fe powder to air and monitoring its surface temperature. Finally, this strategy is compared to other existing seasonal storage technologies to assess its techno-economical potential. The comparison highlights the promising potential of this process, thanks to its low cost and mild process conditions.
10 scaled-down pilot reactor, representing the electricity need of a typical single-family house in central Europe. We use a 0.21 m3 stainless steel reactor with gas manifolds and electrical shell heating to study its charging and discharging characteristics. The active Fe powder is further compared to wood dust and other metal dusts about their dust explosion risks, and its accidental release was investigated by deliberately exposing kg-scale of active Fe powder to air and monitoring its surface temperature. Finally, this strategy is compared to other existing seasonal storage technologies to assess its techno-economical potential. The comparison highlights the promising potential of this process, thanks to its low cost and mild process conditions.
Results and discussions
Construction and operation of the 0.21 m3 pilot reactor
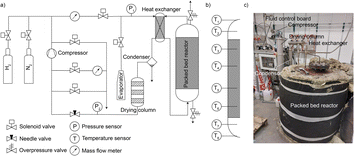
The technical feasibility of seasonal energy storage with iron was tested in a 0.21 m3 fixed bed reactor consisting of a stainless-steel tank, electrical heating on the jacket and bottom, steam generator, water condenser, drying column filled with silica gel, and compressor, as shown in Fig. 2 (details in ESI Note 4†). Prior to start, the reactor was filled with 250 kg synthetic magnetite (Bayferrox® 306, abbreviated as BF306), full reduction of which would permit the storage of 8.71 kg H2. A first reduction run was used to remove starting/ramp up effects of the system. The experimentally measured state of charge (SOC, defined as the percentage of the starting FeOx reduced to metallic Fe) was 88.3% – corresponding to an effective volumetric storage density of 30.1 kg H2 m−3, matching well with the range listed in Table S2,† with the details of the first charging operation available elsewhere.38 The reactor was then discharged and charged again, with all data used in this study from the 1st discharging (i.e. “the first winter”) onwards.The SOC of the reactor during discharging was calculated using both its water consumption and H2 production. As shown in Fig. 3a, the two measurements matched well; the difference in the final SOC calculated in two ways is only 0.8%. In the first 400 h on stream, the SOC steadily decreased, after which the rate of discharge slowed down as discharging approached completion. After 622 h, the SOC dropped to <10%. The discharging was stopped after 762 h at a final SOC of 6.2%. Some reduced form of the Fe remained in the reactor, but over 90% of the previously charged H2 could be effectively removed. Fig. 3b provides the cumulative weight of water fed to the reactor and collected from the condenser, and the conversion of water calculated from them. The water feed rate stayed stable during the discharge, with an average feed rate of 162 g h−1. The instantaneous conversion is highly scattered as it was obtained by manually measuring the weight of water at irregular time points, and the size of the reactor required some time to reach (pseudo) steady state. The high conversion of steam to H2, allowed by thermodynamics, was only achieved at the beginning of discharging. The instantaneous conversion decreased as the SOC dropped, reaching the lowest value of 7.7% at the end. Possible ways to increase the steam conversion include: increasing temperature, decreasing water feed rate, or promoting the iron to make it more reactive.21–23 The material might also become more active in subsequent cycles, as shown later in the manuscript.
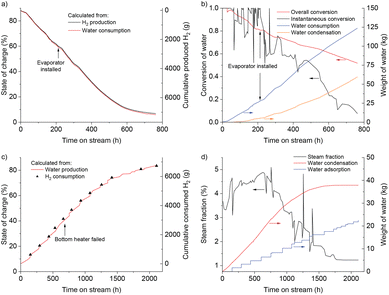 | ||
| Fig. 3 (a and c) Discharging (top) and charging (bottom) of a 250 kg FeOx-containing pilot scale reactor, followed by two independent measurements. Discharging was followed by water consumption and H2 production. Subsequent charging was followed by water production, H2 consumption based on the number of pressurized H2 bottles (200 bar) connected and emptied into the reactor. (b and d) The weight of water consumed or produced during discharging (top) and charging (bottom), and the calculated conversion from steam to H2 or vice versa. Data are shown for the time that the reactor was actually running; full data are available in Fig. S2 and S3.† | ||
During charging, the bottom heater failed at 683 h (time on stream) and the bottom temperature dropped by around 60 °C (Fig. S3,† at a cumulative time of 918 h). The rate of charging, however, stayed mostly constant in the first 1300 h on stream, and the SOC increased steadily, reaching 68.7%. We attribute this to the fact that the inlet of the reactor was at the bottom, and by the time the bottom heater stopped, the majority of FeOx at the bottom had already been converted into Fe. Indeed, the temperatures measured by T1–T5 did not change significantly, meaning the middle and the top of the reactor were unaffected. The cumulative weight of condensed water increased steadily in the first 1000 h, after which it gradually slowed down, and barely increased in the final 500 h, as the steam fraction was too low for condensation. During this last part of charging, the adsorption column removed most of the water from the recycled H2, driving the SOC up to its final value. A separate representation of the steam fraction is given in Fig. 3d, which was calculated from the weight of condensed water and the recycle flow rate. It fluctuated around 4% in the first 1000 h of charging, after which it gradually declined. In contrast to the thermodynamically allowed single pass conversion of 10%, the observed maximum steam fraction was only half of that. A low steam fraction means more recycling and thus increases the pumping and separation costs. A number of experimental factors may have contributed to this difference, in particular an inhomogeneous temperature distribution in the reactor (only 300–350 °C on the top), flow bypass or insufficient contact between the gas and solid phases. Possible measures to increase the steam fraction include: more homogeneous heating of the reactor; promoting the iron oxide; and reduce the recycle flow rate at the end of charging period.
The 1st charging38 and 2nd charging could be compared (Table S3†). Both have similar temperature settings and final SOC. However, the 2nd charging is significantly faster, accompanied by a higher percentage of water removed in the condenser than the drying column, indicating a higher steam fraction in the reactor off-gas. This means that the adsorption column is probably not necessary in beginning of charging, helping to reduce the cost in a future project. The formation of some hydrocarbons in the 1st charging, which is assumed to originate from the carbon impurities (Table S4†), is no longer observed.
Performance of iron oxide during repeated redox cycles
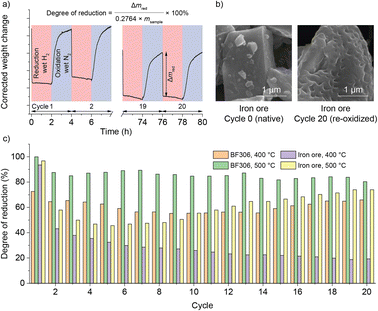
For seasonal energy storage, a system life of at least 20 years is expected. It is thus desired to extend the operation of the reactor to multiple cycles. Due to the inherent slowness of the here-chosen process at a seasonal time scale, a thermogravimetric analyzer (TGA) was used instead. The iron oxides were isothermally reduced in wet H2 and oxidized in wet N2, simulating the conditions in the reactor. The degree of reduction (equivalent to SOC in the previous section) was calculated from the weight loss during each reduction step. Apart from BF306 used in the reactor, an iron ore was also used “as it was” without any chemical treatment (physical properties in Table S2,† chemical compositions in Table S4,† summarized TGA results in Fig. 4, Raw data in Fig. S5–S10†). The best laboratory scale performance was obtained in BF306 at an elevated temperature of 500 °C, which permitted a degree of reduction of 80% in the 20th cycle within the comparatively fast time of 2 hours. The iron ore lost some capacity after the first cycle; however, it could be slowly recovered during cycling at 500 °C. Nevertheless, its lower gravimetric capacity was compensated by its higher bulk density, making its volumetric energy storage capacity on par with or even higher than BF306. Compared with reduction, the oxidation step was generally slower and incomplete, at least at the here used short time frame of 2 hours. Extending the time of oxidation from 2 h to 4 h provided only some minor improvement (Fig. S11–S15†). This was likely caused by the low steam fraction in TGA (limited to around 2%, to prevent condensation in the instrument) compared with pure steam used in the reactor, and we believe that the iron oxide in the reactor, either synthetic or natural, could retain its redox activity for at least 20 cycles, if the correct temperature and feedstock are used.Sintering and morphological changes of Fe or FeOx
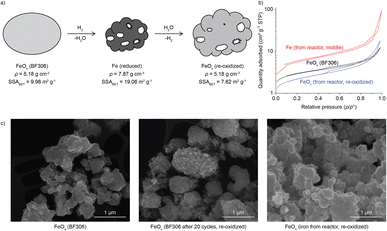
The iron oxide undergoes a relatively low numbers of redox cycles, but very long exposure to elevated temperatures, which may result in sintering and loss of its activity.22,40–42 The specific surface area (SSA) was thus measured using Brunauer–Emmett–Teller (BET) method for the starting BF306, the iron samples taken from the reactor after the 2nd charging, before and after re-oxidation in air, as shown in Fig. 5 (details in Fig. S16 and Table S5†). Together presented are the SEM images of samples from the reactor and TGA (Fig. S17–S23†). After 20 cycles on a thermobalance, the surface of the particles became rougher if compared with the starting FeOx. This may be attributed to the removal of oxygen and densification of the particle during reduction (scheme in Fig. 5a). The volume loss could induce the formation of cracks and pores in the newly-formed iron-rich particle, as was most obvious for the iron ore shown in Fig. 4b and S20–S22,† due to its larger size and fracture surfaces. The much finer synthetic BF306 showed only surface roughness and dimples but not pores (Fig. S17–S19†), as the initial particle size was likely sufficiently small so that pore-formation was not needed for its complete reaction. The N2 sorption curves of Fe from the reactor, before and after exposure to ambient air, exhibited type II isotherms with a type H3 hysteresis,43 similar to the starting BF306, confirming an essentially nonporous structure. The SSA increased from 10.0 to 19.1 m2 g−1 after the 2nd charging, as expected due to the removal of oxygen from the lattice. After re-oxidation in air, the sample still exhibited 7.6 m2 g−1 of SSA, only 24% smaller than BF306. Taken together the time for the two charging and one discharging operations, and the times between them, the iron/iron oxide powders in the reactor has been sitting at elevated temperatures for more than 15![[thin space (1/6-em)]](https://www.rsc.org/images/entities/char_2009.gif) 000 h, which speaks of its excellent stability under the process conditions in our study.
000 h, which speaks of its excellent stability under the process conditions in our study.
Powder explosion hazards of the charged state iron powders
The dust explosion risks of a combustible powder could be assessed by its deflagration index Kst, which represents the maximum rate of pressure rise after a powder is distributed and ignited in a closed container in a standardized way.44 To put into perspective the danger of using iron powder in a seasonal energy storage system, the Kst values and minimum flammable concentrations of some common metallic and organic dusts are listed in Table S6.†![[thin space (1/6-em)]](https://www.rsc.org/images/entities/char_2009.gif) 45 Carbonyl Fe with a diameter less than 10 μm is the finest iron powder commodity product and is a good representative of the Fe powder found in a fully charged reactor. The carbonyl Fe has the same dust hazard class as other common dusts, including sugar, bituminous coal and so on. Among metals, it has a relatively low Kst value, especially compared with aluminum, which has also been proposed as an energy storage medium.31,32
45 Carbonyl Fe with a diameter less than 10 μm is the finest iron powder commodity product and is a good representative of the Fe powder found in a fully charged reactor. The carbonyl Fe has the same dust hazard class as other common dusts, including sugar, bituminous coal and so on. Among metals, it has a relatively low Kst value, especially compared with aluminum, which has also been proposed as an energy storage medium.31,32
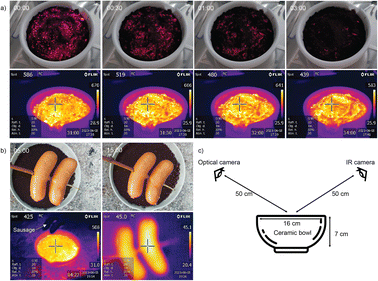
The safety aspect was further demonstrated by deliberately exposing around 0.4 kg of the charged material to air and monitoring its surface temperature (Fig. 6). It glowed with a surface temperature around 650 °C for a few ten seconds, but rapidly cooled to 300–400 °C within minutes. Since the reaction is limited by mass transfer of air to the solid, a spill of active Fe powder self-extinguishes, as the FeOx formed at the surface acts similarly to using sand for fire extinguishing, unless regularly moved and mixed with air.
Comparison with other seasonal storage strategies
As shown in Fig. 7, the here-demonstrated seasonal energy storage are compared to current industrial processes and key alternatives proposed in literature.46–49 The reviewed technologies include: physically stored (compressed or liquefied) H2; chemically stored H2 (i.e. synthetic methane stored as liquefied natural gas (LNG), synthetic ammonia, liquid organic hydrocarbons (LOHC) and hydrogen storage alloys) and the here-demonstrated process. Other types of storage, like pumped hydro or batteries, are not further discussed since they are usually less suitable for seasonal storage due to their low gravimetric energy storage density and their high capital costs, and the reader is referred to the existing literature for detailed argumentation.50–52 In addition, a comparison between the here-reported process and conventional battery technologies in terms of cost and energy density is provided as Table S10.†Future prospects and large-scale implementation
To investigate whether the here-demonstrated process could perform well in a future energy system, we performed an energy system optimization with reported methodology (details in ESI Note 8†).55 We assumed three possible consumer groups being fully reliant on solar PV at different scales (Fig. 8a and b). A detailed estimation of the CAPEX for systems with different sizes can be found in Table S8.† Groups 1 and 2 have a battery for day–night storage and a fuel cell for electricity, while group 3 accesses pumped hydro for day–night storage and H2 gas turbine to generate electricity. All three scenarios were simulated assuming costs and efficiency data sets for 2020 and 2030 (a table with all costs and efficiencies available in Table S9†). The first and second scenario represent microgrid applications, while the third illustrates the difference when moving to larger systems at city or industrial site level.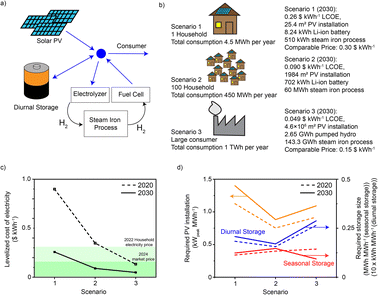 | ||
| Fig. 8 Levelized cost of electricity (LCOE) and installed unit size for different scenarios. (a) Generalized energy system: electricity is produced by solar PV, which is then either stored or consumed. (b) Different scenarios for the computation of the LCOE and the optimized unit sizes. (c) LCOE is compared to the current average electricity price for households in Switzerland (2022 data,57,58 this would be the goal for scenario 1) and the market price of electricity for 2024 (Cal-24,59 this would be the goal for scenario 3). (d) Required size of PV installation, seasonal storage and battery size, all expressed as the required size per MW h of annual demand. | ||
The levelized cost of electricity (LCOE) for a current system at the very small scale (single house) is significantly more expensive than electricity from the grid. However, even estimates based on today's prices show that microgrids with 100 households are only slightly more expensive (0.04 $ kW h−1, see Fig. 8c). At larger scale and with the cost scenarios for 2030, the electricity becomes even cheaper and competitive with the current market price of 2024 (current electricity price traded in the form of futures). The scenario for 2030 has significantly lower LCOE in all scenarios due to lower costs for electrolyzers, fuel cells and batteries, as well as higher efficiencies for these components. Comparing scenarios 2 and 3 describes the additional price payed for decentralized deployment which is in the order of 0.05 $ kW h−1 (for the 2030 scenario). This is again significantly less than the current grid fee of 0.11 $ kW h−1.56
Conclusions
For the first time, we demonstrate a safe, simple and technically feasible strategy for seasonal hydrogen and energy storage, using a 0.21 m3 reactor and 250 kg of iron oxide. Two steps are involved: the reduction of iron oxide with hydrogen when energy is in excess (warm season) and the oxidation of iron with steam when energy is needed (cold season). Scale-relevant data on material and energy flows are accompanied by chemical insights of the iron/iron oxide material during this process. The iron/iron oxide exhibited increased reactivity after repeated redox cycles, while retaining its surface area after 15![[thin space (1/6-em)]](https://www.rsc.org/images/entities/char_2009.gif) 000 h at elevated temperature. The safety was briefly discussed, and the charged state iron powder was experimentally shown to be of limited damage potential. A comparison of this iron-based process with other seasonal energy storage solutions at system scale confirmed its attractiveness in costs, system safety and simplicity.
000 h at elevated temperature. The safety was briefly discussed, and the charged state iron powder was experimentally shown to be of limited damage potential. A comparison of this iron-based process with other seasonal energy storage solutions at system scale confirmed its attractiveness in costs, system safety and simplicity.
Conflicts of interest
The authors U. L. and W. S. declare a financial interest in the form of two patent applications (EP 3′902′040 (B1) and EP 3′699′991 (B1)), covering the seasonal energy storage strategy presented in this article.60,61Acknowledgements
We would like to express our greatest gratitude to Fredy Mettler from the electronic workshop, Urs Krebs and Olivier Coriton from the mechanical workshop for their continued support in the last few years. We thank Jan Kovacovic for helping us with high-pressure experiments. The authors would also like to thank Dr Thomas Weber for assisting us with XRD measurements, Xiaoyu Zhou and Dario Faust Akl for N2 sorption measurements, Philipp Haueter for providing us with the IR camera, and Dr Michael Plötze for the density measurements of iron oxides. We thank Prof. Dr Robert Grass for rich discussions on the thermal control of the reactor and surface area determination, and Nikita Kobert for his involvement on the safety and design of the experiments. We also thank ETH Zürich for financial support.Notes and references
- Federal Ministry for Economic Affairs and Climate Action, Bundesrat Adopts Energy Security of Supply Act 3.0, https://www.bmwk.de/Redaktion/EN/Pressemitteilungen/2022/10/20221007-bundesrat-adopts-energy-security-of-supply-act-30.html, (accessed June 2023) Search PubMed.
- Bundesamt für Energie, Sichere Stromversorgung, https://www.uvek.admin.ch/uvek/de/home/energie/stromversorgungssicherheit.html, (accessed June 2023) Search PubMed.
- HM Government, Powering Up Britain: Energy Security Plan, https://www.gov.uk/government/publications/powering-up-britain, (accessed June 2023) Search PubMed.
- Energielage und Sparkampagne, Energie: Stärkung der Versorgungssicherheit (Archiv-Dossier), https://www.uvek.admin.ch/uvek/de/home/energie/energieversorgungssicherheit-ukraine-krieg.html, (accessed June 2023) Search PubMed.
- H. Ritchie, M. Roser and P. Rosado, CO2 and Greenhouse Gas Emissions, https://ourworldindata.org/co2-and-greenhouse-gas-emissions, (accessed June 2023) Search PubMed.
- United Nations, Paris Agreement, Paris, 2015.
- Bundesamt für Energie, Energiestrategie 2050, https://www.bfe.admin.ch/bfe/de/home/politik/energiestrategie-2050.html, (accessed June 2023) Search PubMed.
- Y. Wang, R. Wang, K. Tanaka, P. Ciais, J. Penuelas, Y. Balkanski, J. Sardans, D. Hauglustaine, W. Liu, X. Xing, J. Li, S. Xu, Y. Xiong, R. Yang, J. Cao, J. Chen, L. Wang, X. Tang and R. Zhang, Nature, 2023, 619, 761–767 CrossRef CAS PubMed
.
- P. Veers, K. Dykes, E. Lantz, S. Barth, C. L. Bottasso, O. Carlson, A. Clifton, J. Green, P. Green, H. Holttinen, D. Laird, V. Lehtomäki, J. K. Lundquist, J. Manwell, M. Marquis, C. Meneveau, P. Moriarty, X. Munduate, M. Muskulus, J. Naughton, L. Pao, J. Paquette, J. Peinke, A. Robertson, J. Sanz Rodrigo, A. M. Sempreviva, J. C. Smith, A. Tuohy and R. Wiser, Science, 2019, 366, eaau2027 CrossRef CAS PubMed
.
- IRENA, Future of Solar Photovoltaic: Deployment, Investment, Technology, Grid Integration and Socio-Economic Aspects (A Global Energy Transformation: Paper), International Renewable Energy Agency, Abu Dhabi, 2019 Search PubMed.
- C. T. Chu and A. D. Hawkes, Renewable Energy, 2020, 160, 955–963 CrossRef
.
- P. Pinel, C. A. Cruickshank, I. Beausoleil-Morrison and A. Wills, Renewable Sustainable Energy Rev., 2011, 15, 3341–3359 CrossRef
.
- J. Mouli-Castillo, M. Wilkinson, D. Mignard, C. McDermott, R. S. Haszeldine and Z. K. Shipton, Nat. Energy, 2019, 4, 131–139 CrossRef CAS
.
- T. J. Kucharski, N. Ferralis, A. M. Kolpak, J. O. Zheng, D. G. Nocera and J. C. Grossman, Nat. Chem., 2014, 6, 441–447 CrossRef CAS PubMed
.
- S. Krevor, H. de Coninck, S. E. Gasda, N. S. Ghaleigh, V. de Gooyert, H. Hajibeygi, R. Juanes, J. Neufeld, J. J. Roberts and F. Swennenhuis, Nat. Rev. Earth Environ., 2023, 4, 102–118 CrossRef CAS
.
- L. Brinkman, B. Bulfin and A. Steinfeld, Energy Fuels, 2021, 35, 18756–18767 CrossRef CAS
.
-
H. Lane, US Pat., US1078686A, 1910 Search PubMed
.
-
A. Messerschmitt, US Pat., US971206A, 1910 Search PubMed
.
- S. Hurst, Oil Soap, 1939, 16, 29–35 CAS
.
- T. L. LeValley, A. R. Richard and M. Fan, Int. J. Hydrogen Energy, 2014, 39, 16983–17000 CrossRef CAS
.
- K. Otsuka, T. Kaburagi, C. Yamada and S. Takenaka, J. Power Sources, 2003, 122, 111–121 CrossRef CAS
.
- K. Otsuka, C. Yamada, T. Kaburagi and S. Takenaka, Int. J. Hydrogen Energy, 2003, 28, 335–342 CrossRef CAS
.
- K. Otsuka and S. Takenaka, J. Jpn. Pet. Inst., 2004, 47, 377–386 CrossRef CAS
.
- P. De Filippis, L. D'Alvia, M. Damizia, B. de Caprariis and Z. Del Prete, Int. J. Energy Res., 2021, 45, 4479–4494 CrossRef CAS
.
- V. Hacker, R. Fankhauser, G. Faleschini, H. Fuchs, K. Friedrich, M. Muhr and K. Kordesch, J. Power Sources, 2000, 86, 531–535 CrossRef CAS
.
- J. Adanez, A. Abad, F. Garcia-Labiano, P. Gayan and L. F. de Diego, Prog. Energy Combust. Sci., 2012, 38, 215–282 CrossRef CAS
.
- A. Lyngfelt, Energy Fuels, 2020, 34, 9077–9093 CrossRef CAS
.
- P. R. Kidambi, J. P. E. Cleeton, S. A. Scott, J. S. Dennis and C. D. Bohn, Energy Fuels, 2012, 26, 603–617 CrossRef CAS
.
- F. Blaschke, M. Bele, B. Bitschnau and V. Hacker, Appl. Catal., B, 2023, 327, 122434 CrossRef CAS
.
- R. Zacharias, S. Bock and V. Hacker, Fuel Process. Technol., 2020, 208, 106487 CrossRef CAS
.
- M. Y. Haller, D. Carbonell, M. Dudita, D. Zenhäusern and A. Häberle, Energy Convers. Manage.: X, 2020, 5, 100017 CAS
.
- M. Teichert, M. Y. Haller and F. Sick, Appl. Energy Combust. Sci., 2023, 13, 100098 Search PubMed
.
- M. Rydén, A. Lyngfelt and T. Mattisson, Energy Fuels, 2008, 22, 2585–2597 CrossRef
.
- P. Gayán, C. R. Forero, A. Abad, L. F. de Diego, F. García-Labiano and J. Adánez, Energy Fuels, 2011, 25, 1316–1326 CrossRef
.
- K.-S. Kang, C.-H. Kim, W.-C. Cho, K.-K. Bae, S.-H. Kim and C.-S. Park, Int. J. Hydrogen Energy, 2009, 34, 4283–4290 CrossRef CAS
.
- A. Sim, N. W. Cant and D. L. Trimm, Int. J. Hydrogen Energy, 2010, 35, 8953–8961 CrossRef CAS
.
- I. Vishnevetsky and M. Epstein, Int. J. Hydrogen Energy, 2007, 32, 2791–2802 CrossRef CAS
.
-
U. B. Lustenberger, PhD thesis, ETH Zürich, 2022
.
- D. Spreitzer and J. Schenk, Metall. Trans. B, 2019, 50, 2471–2484 CrossRef CAS
.
-
R. I. Razouk, R. S. Mikhail and B. S. Girgis, in Solid Surfaces and the Gas–Solid Interface, American Chemical Society, Washington D. C., 1961, ch. 7, vol. 33, pp. 42–50 Search PubMed
.
- C. M. Kramer and R. M. German, J. Am. Ceram. Soc., 1978, 61, 340–342 CrossRef CAS
.
- W. Hui, S. Takenaka and K. Otsuka, Int. J. Hydrogen Energy, 2006, 31, 1732–1746 CrossRef
.
- M. Thommes, K. Kaneko, A. V. Neimark, J. P. Olivier, F. Rodriguez-Reinoso, J. Rouquerol and K. S. W. Sing, Pure Appl. Chem., 2015, 87, 1051–1069 CrossRef CAS
.
- ASTM, Standard Test Method for Explosibility of Dust Clouds, West Conshohocken, PA, USA, 2019 Search PubMed.
- NFPA, Guide for Venting of Deflagrations, Quincy, MA, USA, 2002 Search PubMed.
- J. Andersson and S. Grönkvist, Int. J. Hydrogen Energy, 2019, 44, 11901–11919 CrossRef CAS
.
- M. Reuß, T. Grube, M. Robinius, P. Preuster, P. Wasserscheid and D. Stolten, Appl. Energy, 2017, 200, 290–302 CrossRef
.
- P. Preuster, A. Alekseev and P. Wasserscheid, Annu. Rev. Chem. Biomol. Eng., 2017, 8, 445–471 CrossRef CAS PubMed
.
- N. A. Sepulveda, J. D. Jenkins, A. Edington, D. S. Mallapragada and R. K. Lester, Nat. Energy, 2021, 6, 506–516 CrossRef
.
- T. Kobert, C. Bauer, C. Bach, M. Beuse, G. Georges, M. Held, S. Heselhause, P. Korba, L. Küng, A. Malhotra, S. Moebus, D. Parra, J. Roth, M. Rüdisüli, T. Schildhauer, T. J. Schmidt, T. S. Schmidt, M. Schreiber, F. R. S. Sevilla and S. L. T. B. Steffen, Perspectives of Power-To-X Technologies in Switzerland: A White Paper, 2019 Search PubMed.
- T. M. Gür, Energy Environ. Sci., 2018, 11, 2696–2767 RSC
.
- J. D. Hunt, E. Byers, Y. Wada, S. Parkinson, D. E. H. J. Gernaat, S. Langan, D. P. van Vuuren and K. Riahi, Nat. Commun., 2020, 11, 947 CrossRef CAS PubMed
.
- A. Züttel, N. Gallandat, P. J. Dyson, L. Schlapbach, P. W. Gilgen and S. I. Orimo, Front. Energy Res., 2022, 9, 1–17 Search PubMed
.
- P. Jelušič, S. Kravanja and B. Žlender, J. Nat. Gas Sci. Eng., 2019, 61, 142–157 CrossRef
.
- P. Gabrielli, M. Gazzani, E. Martelli and M. Mazzotti, Appl. Energy, 2018, 219, 408–424 CrossRef
.
- Bundesamt für Energie, Entwicklung der Netzkosten in der Schweiz vor dem Hintergrund des derzeitigen Bedarfs, der ES2050 und der Strategie Stromnetze, https://pubdb.bfe.admin.ch/de/publication/download/8275, (accessed June 2023) Search PubMed.
-
Swissgrid AG, Alles rund um den Strompreis: Tarife für das Schweizer Übertragungsnetz, https://www.swissgrid.ch/de/home/about-us/company/electricity-price.html, (accessed June 2023) Search PubMed
.
-
Swissgrid AG, Strompreis 2023: Kosten und Erlöse, https://www.swissgrid.ch/dam/swissgrid/about-us/company/electricity-price/electricity-price-2023-de.pdf, (accessed August 2023) Search PubMed
.
- EEX, Futures: Cal-24, https://www.eex.com/de/marktdaten/strom/futures, (accessed June 2023) Search PubMed.
-
W. J. Stark and U. B. Lustenberger, Switzerland Pat., EP3699991B1, 2020 Search PubMed
.
-
W. J. Stark and U. B. Lustenberger, Switzerland Pat., EP3902040B1, 2021 Search PubMed
.
Footnotes |
| † Electronic supplementary information (ESI) available: Additional experimental and modelling details, additional data, and additional experimental results (PDF). See DOI: https://doi.org/10.1039/d3se01228j |
| ‡ These authors contributed equally to this article. |
| § Current address: Karl Bubenhofer AG, Hirschenstrasse 26, 9201 Gossau SG, Switzerland. |
| This journal is © The Royal Society of Chemistry 2024 |

