 Open Access Article
Clean hydrogen production from ammonia decomposition over zeolite 13X-supported Ni catalysts†
Jiyu
Kim
 ab,
Kyoung Deok
Kim
ac,
Unho
Jung
*a,
Yongha
Park
a,
Ki Bong
Lee
*b and
Kee Young
Koo
 *ad
*ad
aHydrogen Research Department, Korea Institute of Energy Research (KIER), 152 Gajeong-ro, Yuseong-gu, Daejeon 34129, Republic of Korea. E-mail: kykoo@kier.re.kr; uhjung@kier.re.kr; Fax: +82-42-860-3739; Tel: +82-42-860-3192 Tel: +82-42-860-3074
bDepartment of Chemical & Biological Engineering, Korea University, 145 Anam-dong, Seongbuk-Gu, Seoul 02841, Republic of Korea. E-mail: kibonglee@korea.ac.kr; Tel: +82-2-3290-4851
cGraduate School of Energy Science and Technology, Chungnam National University(CNU), 99 Daehak-ro, Yuseong-gu, Daejeon 34134, Republic of Korea
dAdvanced Energy and System Engineering, University of Science and Technology (UST), 217 Gajeong-ro, Yuseong-gu, Daejeon 34113, Republic of Korea
First published on 12th January 2024
Abstract
Unlike most H2 production methods, the decomposition of NH3 does not result in carbon dioxide emission and is therefore classified as clean technology. Thus, NH3 holds great promise for the large-scale transportation and storage of H2, and efficient low-temperature NH3 decomposition catalysts are highly sought after. Herein, we examined the textural properties and NH3 decomposition performances of zeolite 13X-supported Ni catalysts prepared by ion exchange, deposition precipitation, and incipient wetness impregnation. The main surface species were identified as Ni phyllosilicates (ion exchange), NiO + Ni phyllosilicates (deposition precipitation), and NiO (impregnation). Compared to other catalysts, the catalyst produced by deposition precipitation achieved the highest H2 formation rate (22.9 mmol gcat−1 min−1 at 30![[thin space (1/6-em)]](https://www.rsc.org/images/entities/char_2009.gif) 000 mL gcat−1 h−1, 600 °C) and exhibited a 30–40 °C lower nitrogen desorption temperature. Given that nitrogen desorption is assumed to be the rate-determining step of catalytic NH3 decomposition, this decrease in the desorption temperature was attributed to improved low-temperature performance. Specifically, the excellent performance of the catalyst obtained by deposition precipitation was ascribed to its large specific surface area and strong metal-support interactions due to the high dispersion and uniform deposition of the active Ni metal on the surface and in the pores of the zeolite support.
000 mL gcat−1 h−1, 600 °C) and exhibited a 30–40 °C lower nitrogen desorption temperature. Given that nitrogen desorption is assumed to be the rate-determining step of catalytic NH3 decomposition, this decrease in the desorption temperature was attributed to improved low-temperature performance. Specifically, the excellent performance of the catalyst obtained by deposition precipitation was ascribed to its large specific surface area and strong metal-support interactions due to the high dispersion and uniform deposition of the active Ni metal on the surface and in the pores of the zeolite support.
Introduction
The increasing incidences of natural disasters and other manifestations of abnormal climate show that climate change is a current rather than a future problem1 and highlight the importance of developing alternative fuels such as H2 (ref. 2–4) to achieve carbon neutrality and net-zero greenhouse gas emission. However, transporting and storing hydrogen directly is inefficient owing to its low volumetric density and boiling point. Thus, current research focuses on increasing the volumetric capacity and decreasing the cost of H2 storage through high-performance H2 carriers such methylcyclohexane, methanol, ethanol,5 and NH3.6 These hydrogen storage materials are more efficient in transportation and can be reformed or decomposed to obtain hydrogen in the consumption area.7 Compared to liquid H2, which needs to be stored at −253 °C, liquid NH3 can be stored at 20 °C and 8 bar and has 1.7-fold higher H2 storage density (120.3 vs. 70.9 kg H2 m−3), thus drawing considerable attention.8,9 The infrastructure for NH3 production, storage, and transportation is well-established because this compound has long been used as a refrigerant gas and material for fertilizer production.10 In addition, NH3 decomposition (2NH3(g)![[left over right harpoons]](https://www.rsc.org/images/entities/char_21cb.gif) N2(g) + 3H2(g), ΔH° = 46.22 kJ mol−1) generates no greenhouse gases and is therefore an eco-friendly H2 production process. As this process is endothermic, it requires an external energy supply, and NH3 conversion increases with increasing temperature. Therefore, NH3 decomposition catalysts exhibiting high activity at low temperatures are highly sought after. In general, Ru-based NH3 decomposition catalysts exhibit superior activity but are unsuitable for large-scale use because of the scarcity and high cost of Ru.11 Among the non-noble-metal (e.g., Fe, Co, Mo) NH3 decomposition catalysts, those based on Ni have the advantages of low cost and high activity.12 However, superior performance is observed only above 600 °C. Therefore, considerable efforts have been devoted to the achievement of the uniform dispersion of large amounts of Ni metal on the support surface to improve catalytic activity. Support properties and catalyst preparation methods significantly impact the physicochemical characteristics (e.g., Ni particle size, dispersion, and metal–support interactions) and activity of Ni-based catalysts.11,13,14 Gu et al. showed that the structural characteristics of porous alumina matrices help disperse small Ni particles and improve catalytic performance.15 Basic supports such as MgO and La2O3 can enhance catalytic activity through electron donation and strong metal–support interactions; however, their small surface area can significantly limit metal dispersion at high loadings.16 Porosity and a large surface area increase the contact area between the support and active material, promoting species diffusion within the support.17,18 Zeolites are widely used as catalyst supports because of their well-defined crystal structure, uniform pore structure, cation-exchange capability, acid–base properties, and large surface area.19,20 Active metal particles can be positioned in zeolite pores or on the zeolite surface, depending on their size, and can engage in strong metal–support interactions.21,22 These interactions, together with the high dispersion of the active metal, contribute to catalytic activity enhancement.23,24 The NH3 decomposition activity of 5% Ni/ZSM-5 catalysts was found to depend on the preparation method, e.g., the catalyst prepared by a modified solid-state ion-exchange method showed high activity because of the strong interaction between the highly dispersed Ni nanoparticles and ZSM-5 support.25 A 23% Ni/SBA-15 catalyst was prepared by a deposition–precipitation method by exploiting the large surface area and mesoporosity of the zeolite support; this catalyst featured highly dispersed Ni metal particles and exhibited high NH3 decomposition activity owing to strong metal–support interactions.26 The structural characteristics of zeolites are expected to influence the uniformity of active metal loading and metal–support interactions.21 In particular, zeolite 13X has a Faujasite structure featuring sodalite cages and supercages and is characterized by a low Si/Al ratio, thus providing abundant acidic sites advantageous for NH3 adsorption. However, despite these advantages, zeolite 13X has not been used to support NH3 decomposition catalysts. Herein, we loaded the active metal (Ni, 15 wt%) on zeolite 13X through ion exchange (IE), deposition precipitation (DP), and incipient wetness impregnation (IMP) and examined the textural properties, surface acidity, Ni–support interactions, and NH3 decomposition performance of the resulting catalysts.
N2(g) + 3H2(g), ΔH° = 46.22 kJ mol−1) generates no greenhouse gases and is therefore an eco-friendly H2 production process. As this process is endothermic, it requires an external energy supply, and NH3 conversion increases with increasing temperature. Therefore, NH3 decomposition catalysts exhibiting high activity at low temperatures are highly sought after. In general, Ru-based NH3 decomposition catalysts exhibit superior activity but are unsuitable for large-scale use because of the scarcity and high cost of Ru.11 Among the non-noble-metal (e.g., Fe, Co, Mo) NH3 decomposition catalysts, those based on Ni have the advantages of low cost and high activity.12 However, superior performance is observed only above 600 °C. Therefore, considerable efforts have been devoted to the achievement of the uniform dispersion of large amounts of Ni metal on the support surface to improve catalytic activity. Support properties and catalyst preparation methods significantly impact the physicochemical characteristics (e.g., Ni particle size, dispersion, and metal–support interactions) and activity of Ni-based catalysts.11,13,14 Gu et al. showed that the structural characteristics of porous alumina matrices help disperse small Ni particles and improve catalytic performance.15 Basic supports such as MgO and La2O3 can enhance catalytic activity through electron donation and strong metal–support interactions; however, their small surface area can significantly limit metal dispersion at high loadings.16 Porosity and a large surface area increase the contact area between the support and active material, promoting species diffusion within the support.17,18 Zeolites are widely used as catalyst supports because of their well-defined crystal structure, uniform pore structure, cation-exchange capability, acid–base properties, and large surface area.19,20 Active metal particles can be positioned in zeolite pores or on the zeolite surface, depending on their size, and can engage in strong metal–support interactions.21,22 These interactions, together with the high dispersion of the active metal, contribute to catalytic activity enhancement.23,24 The NH3 decomposition activity of 5% Ni/ZSM-5 catalysts was found to depend on the preparation method, e.g., the catalyst prepared by a modified solid-state ion-exchange method showed high activity because of the strong interaction between the highly dispersed Ni nanoparticles and ZSM-5 support.25 A 23% Ni/SBA-15 catalyst was prepared by a deposition–precipitation method by exploiting the large surface area and mesoporosity of the zeolite support; this catalyst featured highly dispersed Ni metal particles and exhibited high NH3 decomposition activity owing to strong metal–support interactions.26 The structural characteristics of zeolites are expected to influence the uniformity of active metal loading and metal–support interactions.21 In particular, zeolite 13X has a Faujasite structure featuring sodalite cages and supercages and is characterized by a low Si/Al ratio, thus providing abundant acidic sites advantageous for NH3 adsorption. However, despite these advantages, zeolite 13X has not been used to support NH3 decomposition catalysts. Herein, we loaded the active metal (Ni, 15 wt%) on zeolite 13X through ion exchange (IE), deposition precipitation (DP), and incipient wetness impregnation (IMP) and examined the textural properties, surface acidity, Ni–support interactions, and NH3 decomposition performance of the resulting catalysts.
Experimental
Catalyst preparation
Ni(NO3)2·6H2O (97%, Junsei) and zeolite 13X (Sigma Aldrich, Si/Al ratio = 1.2) were used as the active metal precursor and support. Depending on the preparation method, the catalysts were labelled as Ni/13X-IE, Ni/13X-DP, or Ni/13X-IMP. For Ni/13X-IE synthesis, the support was treated with 0.5 M Ni(NO3)2 solution (support/solution = 1 g/100 mL) at 80 °C for 24 h to exchange the Na+ ions in the zeolite for Ni2+ ions. For Ni/13X-DP synthesis, the support-solution mixture was supplemented with urea (60.06%, Junsei) with a Ni![[thin space (1/6-em)]](https://www.rsc.org/images/entities/char_2009.gif) :
:![[thin space (1/6-em)]](https://www.rsc.org/images/entities/char_2009.gif) urea = 1
urea = 1![[thin space (1/6-em)]](https://www.rsc.org/images/entities/char_2009.gif) :
:![[thin space (1/6-em)]](https://www.rsc.org/images/entities/char_2009.gif) 30 molar ratio at 70 °C, and the precipitate was aged for 2 h at 90 °C, filtered, and thoroughly washed with deionized water. Ni/13X-IMP was prepared by an incipient wetness impregnation method. All catalysts were dried at 120 °C overnight and then calcined at 400 °C for 4 h in air.
30 molar ratio at 70 °C, and the precipitate was aged for 2 h at 90 °C, filtered, and thoroughly washed with deionized water. Ni/13X-IMP was prepared by an incipient wetness impregnation method. All catalysts were dried at 120 °C overnight and then calcined at 400 °C for 4 h in air.
Catalyst characterization
For Ni and Na quantitation, the sample was dissolved in a solution of 70% HNO3 and 30% HCl, and the solution was analyzed by inductively coupled plasma-atomic emission mass spectrometry (ICP-MS; Agilent 7700S, Agilent). Phase compositions were analyzed using X-ray diffraction (XRD; SmartLab High Temp, Rigaku) with Cu Kα radiation (λ = 0.154 nm). Samples were scanned in steps of 0.02° over a 2θ range of 10°–90°. The crystallite size (d) was calculated using the Scherrer equation:d = kλ/(β![[thin space (1/6-em)]](https://www.rsc.org/images/entities/char_2009.gif) cosθ) cosθ) | (1) |
Specific surface areas and pore distributions were measured using the Brunauer–Emmett–Teller (BET) and Barrett–Joyner–Halenda (BJH) methods (BELSORP-MAX, MicrotracBEL Corp.). The sample (100 mg) was heated in a vacuum at 300 °C for 24 h, and N2 sorption isotherms were then measured at −196 °C. Samples were reduced at 700 °C for 1 h in a 10% H2/N2 gas flow before analysis. The distribution of meso- and micropores was determined using BJH and MP plots.
The catalyst reduction temperature and active metal–support interactions were probed using H2-temperature programmed reduction (H2-TPR; BELCAT-B, MicrotracBEL Corp.). The sample (50 mg) was heated in a flow of Ar at 400 °C, cooled to 50 °C, and heated to 1000 °C at a rate of 10 °C min−1 in 10% H2/Ar.
Active metal dispersion was examined using H2 chemisorption (BEL-METAL-3, MicrotracBEL Corp.). The sample (50 mg) was reduced in pure H2 at 700 °C for 1 h and then cooled to 50 °C under Ar. Pulse adsorption was conducted at 50 °C in 10% H2/Ar until saturation. The Ni dispersion state and surface area were estimated from the amount of adsorbed H2, assuming an adsorption stoichiometry of H/Nis (surface nickel atom) = 1.0.
The composition of the catalyst surface and the oxidation states of the constituent elements were examined using X-ray photoelectron spectroscopy (XPS; Sigma Probe, Thermos VG Scientific) in ultrahigh vacuum (10−9 Torr) using an Al Kα (1486.7 eV) X-ray source. The baseline was adjusted using the Shirley background, and all spectra were calibrated using the peak of adventitious carbon at 284.8 eV.
The shape and distribution of Ni particles were examined by transmission electron microscopy (TEM; JEM-F200, JEOL) at 200 kV. The distributions of Al, Si, O, Na, and Ni in the catalyst matrix were probed by energy-dispersive X-ray spectroscopy (EDS). Samples were dispersed in ethanol by ultrasonication, and a drop of the resulting suspension was placed on an ultrathin holey carbon grid and allowed to evaporate. The ultra-microtome (Powertome, RMC) cutting technique was used to examine cross-sections of the Ni/13X catalysts.
NH3-temperature programmed surface reaction and temperature programmed desorption (NH3-TPSR and NH3-TPD, BELCAT-B, MicrotracBEL Corp.) measurements were conducted to study catalyst surface acidity and NH3 decomposition performance. The catalyst was reduced in a flow of 10% H2/Ar at 700 °C for 1 h, cooled to 50 °C in a flow of He (50 sccm), held in an atmosphere of 10% NH3/He at 50 °C for 1 h, maintained in a flow of He (50 sccm) for 1 h to desorb weakly physically adsorbed NH3. And then the catalyst was heated from 50 to 800 °C at a rate of 10 °C min−1 under 10% NH3/He gas and He gas in NH3-TPSR and NH3-TPD, respectively. Residual NH3 (m/z = 17), H2 (m/z = 2), and N2 (m/z = 28) desorption were analyzed by mass spectrometry (BELMASS, microtracBEL Corp.). Pyridine-adsorbed diffuse-reflectance infrared Fourier transform spectroscopy (DRIFTS) was used to analyze the acidic sites on the catalyst surface. The sample was heated at 400 °C for 1 h to remove moisture, treated with 1 vol% pyridine/He at 50 °C for 1 h, and purged with He flow to desorb the weakly bound pyridine. Spectra were recorded using a step size of 4 cm−1 on a Nicolet iS50 FTIR spectrometer (Thermo Fisher Scientific) equipped with a focal plane array detector and a praying mantis DRIFTS attachment (Harrick) with a ZnSe window in the reaction chamber. For each analysis, 128 scans were performed on average.
Catalytic activity testing
Catalytic NH3 decomposition was conducted in a quartz fixed-bed reactor loaded with the catalyst (200 mg) mixed with the diluent (MgAl2O4) in a 1![[thin space (1/6-em)]](https://www.rsc.org/images/entities/char_2009.gif) :
:![[thin space (1/6-em)]](https://www.rsc.org/images/entities/char_2009.gif) 5 mass ratio. The reaction temperature was controlled by a thermocouple placed in the catalyst bed. Prior to each test, the catalyst was reduced in a flow of 20% H2/N2 at 700 °C. Subsequently, the temperature was decreased to 400 °C at a rate of 1 °C min−1 in a flow of pure NH3. NH3 was injected into the reactor at a flow rate of 20–150 mL min−1, corresponding to weight hourly space velocities (WHSV) of 6000–45000 mL gcat−1 h−1. The concentrations of N2, H2, and NH3 in the outlet gas were measured using gas chromatography (Agilent 7890 GC, Agilent). NH3 and N2 were quantified using He as a carrier gas and a PoraPLOT Amines column, while H2 was quantified using Ar as a carrier gas and an HP-PLOT 5A column. Each column was equipped with a thermal conductivity detector. The NH3 conversion (XNH3), H2 formation rate, apparent activation energy (Ea) and turn over frequency (TOF) were calculated as follows:
5 mass ratio. The reaction temperature was controlled by a thermocouple placed in the catalyst bed. Prior to each test, the catalyst was reduced in a flow of 20% H2/N2 at 700 °C. Subsequently, the temperature was decreased to 400 °C at a rate of 1 °C min−1 in a flow of pure NH3. NH3 was injected into the reactor at a flow rate of 20–150 mL min−1, corresponding to weight hourly space velocities (WHSV) of 6000–45000 mL gcat−1 h−1. The concentrations of N2, H2, and NH3 in the outlet gas were measured using gas chromatography (Agilent 7890 GC, Agilent). NH3 and N2 were quantified using He as a carrier gas and a PoraPLOT Amines column, while H2 was quantified using Ar as a carrier gas and an HP-PLOT 5A column. Each column was equipped with a thermal conductivity detector. The NH3 conversion (XNH3), H2 formation rate, apparent activation energy (Ea) and turn over frequency (TOF) were calculated as follows:| XNH3 (%) = (Fin − Fout)/Fin | (2) |
| H2 formation rate (mmol gcat−1 min−1) = [(Fin/22.4) × XNH3 × 1.5]/mcat | (3) |
k = A![[thin space (1/6-em)]](https://www.rsc.org/images/entities/char_2009.gif) exp(−Ea/RT) exp(−Ea/RT) | (4) |
| TOF (s−1)= (H2 formation rate × mass of catalyst)/(Ni dispersion × Ni contents) | (5) |
Results and discussion
Characteristics of Ni/zeolite 13X catalysts
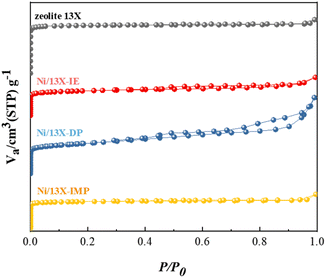
Table 1 lists the characteristics of the prepared catalysts showing that their Ni contents were similar (14.2–14.8 wt%). In contrast, the Na content was broadly variable and followed the order of Ni/13X-IE < Ni/13X-DP < Ni/13X-IMP ≈ zeolite 13X. This order reflected that the loss of Na(+) ions due to ion exchange for Ni ions was significant in the case of Ni/13X-IE. In contrast, the loss that occurred during aging was less significant for Ni/13X-DP. Ni/13X-DP featured the smallest Ni crystallite size (21.9 nm) and the highest Ni metal dispersion (2.71%). The specific surface area of all catalysts was significantly lower than that of the fresh zeolite 13X (919 m2 g−1) because of the pore blockage caused by the supported Ni; Ni/13X-IE (457 m2 g−1) and Ni/13X-DP (563 m2 g−1) exhibited the smallest and largest specific surface area, respectively. Fig. 1 presents the N2 sorption isotherms, revealing that zeolite 13X featured a type-I isotherm and could therefore be classified as a microporous material. Ni/13X-IE and Ni/13X-IMP also behaved as microporous materials. In contrast, Ni/13X-DP featured a type-IV isotherm with H3 hysteresis and was the only catalyst containing mesopores (∼12 nm), as reflected in its pore size distribution (Fig. S1†). This finding was attributed to the formation of mesopores during the conversion of Ni(OH)2 into NiO and Ni metal through calcination at 400 °C and reduction at 700 °C.27–29 The formation of mesopores is thought to benefit the diffusion of reactants and their adsorption onto the catalyst.23 The activity of Ni catalysts depends on particle size and support-interface properties.| Zeolite 13X | Ni/13X-IE | Ni/13X-DP | Ni/13X-IMP | |
|---|---|---|---|---|
| a Determined by ICP-MS. b Estimated from H2-Chemisorption at 50 °C. c Estimated from XRD. d Estimated from the N2 adsorption at −196 °C. e Estimated from the integration of H2-TPR peaks. | ||||
| Ni content (wt%)a | — | 14.5 | 14.8 | 14.2 |
| Na content (wt%)a | 4.27 | 1.54 | 2.85 | 4.20 |
| Metal dispersion (%)b | — | 0.96 | 2.71 | 0.59 |
| NiO crystallite size (nm)c | — | 6.8 | 9.0 | 25.8 |
| Ni0 crystallite size (nm)c | — | 27.3 | 21.9 | 36.4 |
| Surface area (m2 g−1)d | 919 | 457 | 563 | 493 |
| Pore volume (cm3 g−1)d | 0.38 | 0.26 | 0.48 | 0.23 |
| Average pore diameter (nm)d | 1.62 | 2.32 | 3.42 | 1.88 |
| H2 consumption (mmol g−1)e | — | 1.28 | 1.50 | 2.40 |
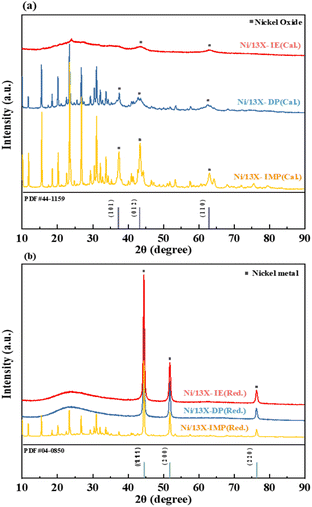
Fig. 2 presents the XRD patterns of catalysts recorded after calcination and reduction, in which NiO and Ni peaks corresponded with reference ICDD #44-1159 and #04-0850. The patterns of the calcined samples showed peaks of NiO at 2θ = 37.3°, 43.3°, and 62.9°, corresponding to the (1 0 1), (0 1 2), and (1 1 0) crystal planes. Upon reduction (700 °C, 20% H2/N2), the patterns of all catalysts indicated the conversion of NiO to Ni0. For the calcined Ni/13X-IE catalyst, the characteristic peak of zeolite 13X was not observed due to the formation of Ni phyllosilicate on the surface of zeolite 13X due to the ion exchange of Ni ions. The broad peak at 2θ = 23° corresponds to amorphous silica, and the Ni phyllosilicate characteristic peaks (2θ = 34.1° and 60.8°) were not clearly observed due to low crystallinity.30 The patterns of reduced Ni/13X-IE and Ni/13X-DP were dominated by Ni peaks and featured weakened and broadened zeolite 13X peaks, whereas that of reduced Ni/13X-IMP featured more pronounced zeolite 13X peaks. When fresh zeolite was reduced, the characteristic pattern of zeolite 13X did not change (Fig. S2†). The size of Ni crystallites was calculated using the Ni (2 0 0) peak; it was found to increase in the order of Ni/13X-DP (21.9 nm) < Ni/13X-IE (27.2 nm) < Ni/13X-IMP (36.3 nm). According to previous studies, the impregnation-based loading of active metals onto zeolites decreases metal dispersion, while deposition–precipitation-based loading improves metal dispersion because of strong metal–support interactions.31 Therefore, the loading of Ni by IE and DP mainly affected bonding within the zeolite pore structure and framework, while IMP mainly resulted in the loading of Ni onto the zeolite surface, and negligible change in the zeolite crystal structure was observed after calcination and reduction. Notably, the Ni/13X-DP catalysts exhibited distinct XRD peak changes before and after reduction. For the reduced Ni/13X-DP catalyst, the zeolite 13X peak disappeared and the peak of amorphous silica was observed. This is because during reduction, the Ni–O–Si bonds on the surface of the particles were cleaved, resulting in a Ni metal phase and amorphous SiO2, and the characteristic peaks of zeolite 13X were not observed. In addition, during reduction at 700 °C, the crystals of Ni metal particles grew and the peak intensity increased. To explain this, the XRD analysis of the Ni/13X-DP catalyst as a function of reduction temperature is shown in Fig. S2.† When only fresh zeolite 13X support was reduced at 700 °C, no change in the characteristic peaks was observed. However, for the Ni/13X-DP catalyst, the characteristic peaks of zeolite 13X disappeared and an amorphous silica peak was observed at reduction temperatures ≥600 °C, and the intensity of the crystal peak of Ni metal increased with increasing reduction temperature.32
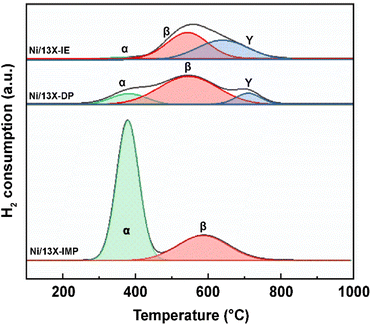
The catalyst reduction temperature depends on the location (e.g., support surface and pores) of the loaded active metal.33 In particular, the strong interaction between the support and Ni located in zeolite pores results in a high reduction temperature. Fig. 3 presents the H2-TPR profiles of the three catalysts, which are deconvoluted into three peaks (α, β, and γ). The α peak, observed at ≤400 °C, corresponds to the reduction of NiO located on the external surface of the zeolite and the weak interaction with the same.21 The β peak, observed at 400–600 °C, corresponds to the reduction of NiO located within the pores (e.g., zeolite supercages and sodalite cages) and the stronger interaction with the support than NiO located on the zeolite surface. The γ peak, observed at >600 °C, corresponds to the reduction of Ni2+ located in hexagonal prisms.34 Ni located in hexagonal prisms was considered as present in ion-exchangeable positions. α peaks were observed for all catalysts and had the largest relative area in the case of Ni/13X-IMP (Table S1†). High-temperature γ peaks were observed only for Ni/13X-IE and Ni/13X-DP because Ni in these catalysts was loaded onto the sites previously occupied by Na, thus interacting more strongly with framework Al and Si. Thus, in Ni/13X-DP, Ni was uniformly and efficiently dispersed in the zeolite pore structure, engaging in strong metal–support interactions.22 This agrees with the results of H2-chemisorption measurements.
Fig. 4 presents the TEM images of calcined and reduced catalysts, revealing that calcined Ni/13X-IE featured long lamellar Ni particles, while Ni/13X-DP featured both lamellar and spherical particles. Ni/13X-IMP contained only spherical particles. This finding is consistent with the observation of both zeolite and NiO XRD peaks due to the presence of agglomerated NiO particles on the zeolite surface. A lamellar structure was observed on the surface of the Ni/13X-IE catalyst even after reduction, and although a lamellar structure was observed on the surface of the Ni/13X-DP catalyst, the formation of spherical particles of Ni metal due to reduction was more pronounced. For Ni/13X-IMP, the reduction did not change the particle shape but induced Ni particle agglomeration due to sintering at high temperatures. Therefore, in the case of Ni/13X-IMP, the weak interaction between the support and Ni particles led to their agglomeration, which was reflected in the largest Ni crystallite size and the lowest metal dispersion among the catalysts. Interestingly, the simultaneous detection of Si and Ni in Ni/13X-IE, which maintained its morphology after reduction, indicated the presence of Ni phyllosilicate.29,35,36
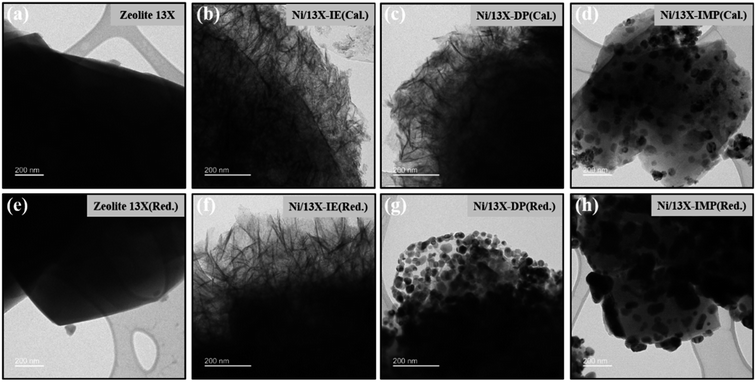 | ||
| Fig. 4 TEM images of (a) fresh zeolite 13X, (b–d) calcined Ni/zeolite 13X catalyst, (e) reduced zeolite 13X, and (f–h) reduced Ni/zeolite 13X catalysts. | ||
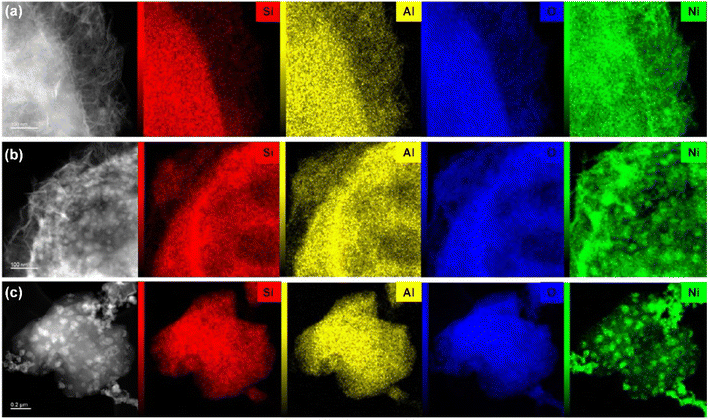
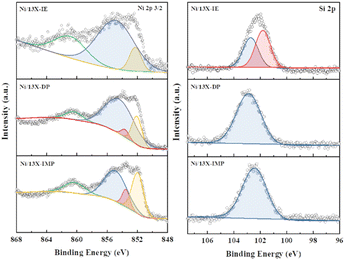
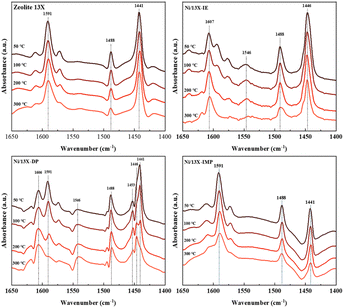
Lehman et al. used a template ion-exchange method to load Ni onto MCM-41 and showed that lamellar Ni(OH)2 or Ni phyllosilicates were present on the surface at or above a certain Ni loading.29 In general, Ni(OH)2 decomposes into cubic NiO crystallites above 197 °C, whereas Ni phyllosilicates are thermally stable. Therefore, the lamellar structures observed on the surface of Ni/13X-IE after reduction at 700 °C were identified as Ni phyllosilicates.37 This conclusion is consistent with the H2-TPR profile of Ni/13X-IE, where the reduction peak was mainly observed at 650 °C. The composition and dispersion of Ni particles on the calcined catalyst surface were examined using EDS (Fig. 5). The lamellar particles observed on the surfaces of Ni/13X-IE and Ni/13X-DP were found to contain Ni. Furthermore, Ni particle agglomeration induced by sintering was observed on the surface of Ni/13X-IMP. Notably, in the case of Ni/13X-DP, lamellar and spherical Ni particles coexisted on the support surface, which agreed with the wide reduction temperature range of this catalyst. To confirm the distribution of Ni deposited inside the pores of the zeolite 13X support, we obtained cross-sectional TEM images of the Ni/13X-DP catalyst with ultra-microtome pretreatment (Fig. S4†). EDS mapping indicated that NiO particles were uniformly distributed inside the pores along with lamella-structured Ni phyllosilicate particles on the surface of the calcined Ni/13X-DP catalyst. This indicates that Ni can be distributed through ion exchange and pore internal deposition. After reduction, Ni metal particles coexisted on the surface and inside the pores of the zeolite 13X support. This is consistent with the H2-TPR results, which exhibited a high reduction temperature distribution of Ni particles with stronger interactions than the zeolite surface. Fig. 6 shows the X-ray photoelectron spectra of reduced catalysts, revealing the presence of Ni 2p3/2 peaks at ∼852 (Ni0), ∼853 (NiO), ∼855 (Ni2+), and 860 eV (broad shake-up satellite peak). The NiO peak was observed only for Ni/13X-DP and Ni/13X-IMP, indicating the partial oxidation of surface Ni during analysis.38 For the Ni/13X-IE catalyst, a significant Ni2+ peak was observed due to the strong chemical bonding and stable structure of Ni–O–Si present on the surface. This is consistent with the H2-TPR results, where a high-temperature reduction peak was observed for the Ni/13X-IE catalyst due to the Ni–O–Si bonds of Ni phyllosilicate formed by ion exchange.32 In the Si 2p spectra, a peak due to a Si–O–Al bonding structure within the zeolite was observed at 102.9 eV for all catalysts. In addition to the Si–O–Al peak, the Si 2p spectrum of Ni/13-IE featured the Ni–O–Si peak of Ni phyllosilicate at 101.6 eV.39 Similarly, to TEM analysis, this finding suggested that the preservation of lamellar particles in Ni/13X-IE, even after reduction at 700 °C, was due to Ni phyllosilicate formation.15,25,40Fig. 7 presents the pyridine-adsorbed DRIFT spectra. Bands corresponding to the pyridine adsorbed on Lewis acid sites (LASs) 19b and 8a were observed at 1441–1453 and 1591–1607 cm−1, respectively. The peak at 1441 cm−1 is due to the pyridine adsorbed on the Al3+ ions adjacent to the Na+ cations of the zeolites, and the same peak as in zeolite 13X was observed in Ni/13X-IMP. Moreover, the peak at 1446 cm−1 observed for Ni/13X-IE was attributed to a band shift caused by the incorporation of Ni2+ through ion exchange with Na+.41 This finding is consistent with the results of ICP-MS and H2-TPR measurements, as some Na+ was ion exchanged for Ni2+ during precipitation. Notably, a peak at 1453 cm−1 was observed for Ni/13X-DP, which was attributed to the presence of LASs due to Al3+ ions present in the tetrahedral sites of the zeolite framework.42 In addition, for Ni/13X-IE and Ni/13X-DP, the 1607 cm−1 band was more intense than the 1591 cm−1 band in the 1591–1606 cm−1 region. Peaks at 1453 and 1606 cm−1 were attributed to LASs caused by the presence of Al3+.43 The band at 1488 cm−1 observed for all samples reflected the presence of both Brønsted-acidic sites (BASs) and LASs. For Ni/13X-IE and DP, surface acidity changes such as a shift in LASs and an increase in the peak intensity of BASs were observed as Ni was ionically exchanged with Na.44,45
NH3 decomposition activity
Fig. S5b† presents the results of the NH3-TPSR-MS measurements, showing the desorption profiles of NH3, N2, and H2. The NH3 signal lost intensity with progressing NH3 decomposition above 300 °C and became undetectable above 650 °C. Interestingly, Ni/13X-IE did not completely decompose NH3 even above 700 °C, which is expected to affect catalytic activity for NH3 decomposition. The formation of N2 and H2 was confirmed along with desorption through NH3 decomposition. The N2 desorption temperature decreased in the order of Ni/13X-IE (365 °C) > Ni/13X-IMP (351 °C) > Ni/13X-DP (321 °C). For NH3 decomposition on non-noble-metals (e.g., Fe, Co, and Ni) catalysts, the recombination and desorption of surface N atoms is the rate-determining step, and the facile desorption of recombined N2 can enhance NH3 decomposition activity.46Fig. 8a presents NH3 conversion achieved at a WHSV of 30![[thin space (1/6-em)]](https://www.rsc.org/images/entities/char_2009.gif) 000 mL gcat−1 h−1 as a function of temperature. This conversion increased with increasing temperature, following the order of Ni/13X-DP > Ni/13X-IMP > Ni/13X-IE. The temperature corresponding to a conversion of 50% (T50) was in the order of Ni/13X-DP (572 °C) < Ni/13X-IMP (586 °C) < Ni/13X-IE (601 °C). Thus, the maximum T50 difference between different catalysts was ∼15 °C (Table 2). In agreement with NH3-TPSR results, Ni/13X-IE, which showed the least N2 and H2 desorption even at maximum temperature, required a higher temperature for complete NH3 decomposition. Ni/13X-IE exhibited a low NH3 conversion due to the presence of mostly Ni phyllosilicate on the surface that was not reduced to Ni metal. Ni/13X-DP showed the highest NH3 conversion at low temperatures, which was ascribed to the efficient and uniform dispersion of Ni resulting from the high support-reactant contact area provided by the mesopores formed during catalyst synthesis. The H2 formation rates of Ni/zeolite 13X catalysts ranged from 17.3 to 22.9 mmol gcat−1 min−1 at a WHSV of 30
000 mL gcat−1 h−1 as a function of temperature. This conversion increased with increasing temperature, following the order of Ni/13X-DP > Ni/13X-IMP > Ni/13X-IE. The temperature corresponding to a conversion of 50% (T50) was in the order of Ni/13X-DP (572 °C) < Ni/13X-IMP (586 °C) < Ni/13X-IE (601 °C). Thus, the maximum T50 difference between different catalysts was ∼15 °C (Table 2). In agreement with NH3-TPSR results, Ni/13X-IE, which showed the least N2 and H2 desorption even at maximum temperature, required a higher temperature for complete NH3 decomposition. Ni/13X-IE exhibited a low NH3 conversion due to the presence of mostly Ni phyllosilicate on the surface that was not reduced to Ni metal. Ni/13X-DP showed the highest NH3 conversion at low temperatures, which was ascribed to the efficient and uniform dispersion of Ni resulting from the high support-reactant contact area provided by the mesopores formed during catalyst synthesis. The H2 formation rates of Ni/zeolite 13X catalysts ranged from 17.3 to 22.9 mmol gcat−1 min−1 at a WHSV of 30![[thin space (1/6-em)]](https://www.rsc.org/images/entities/char_2009.gif) 000 mL gcat−1 h−1 and 600 °C.
000 mL gcat−1 h−1 and 600 °C.
Table S2† summarizes the NH3 decomposition performances of previously reported catalysts, revealing that the H2 formation rate of Ni/13X-DP exceeded that of the 15 wt% Ni/MRM-600 catalyst with a similar Ni content (18.4 mmol gcat−1 min−1) and was similar to that of the 25 wt% Ni/rGO catalyst with a higher Ni content (24.8 mmol gcat−1 min−1).47,48 The H2 formation rates of the Ni/SiO2 and Ni/SiO2-AEH catalysts with a SiO2 support were 11.4 and 16 mmol gcat−1 min−1, respectively, which were lower than those of the prepared Ni/13X catalyst. The TOF (s−1) values were calculated using the dispersion of Ni particles determined by H2-chemisorption. The TOF of the prepared catalysts increased in the order of Ni/13X-DP < Ni/13X-IE < Ni/13X-IMP as the dispersion of Ni particles decreased (Table 2). However, the Ni/13X-DP catalyst exhibited high NH3 conversion activity, which contradicted the catalytic activity order based on TOF. Considering the results of previous studies performed under the same reaction conditions (WHSV = 30![[thin space (1/6-em)]](https://www.rsc.org/images/entities/char_2009.gif) 000 mL gcat−1 h−1, 600 °C), the TOF of 10 wt% Ni/SiO2 (metal dispersion = 0.9%) prepared by the precipitation method49 and that of 9 wt% Ni/BN (metal dispersion = 1.1%)50 were 12.4 and 16.0 s−1, respectively, which were higher than those of the Ni/13X-DP catalyst (metal dispersion = 2.71%); however, the NH3 conversions of these catalysts (36.4% and 48.1%, respectively) were lower. In addition, previous studies51,52 reported that the catalytic activity improved while the TOF tended to decrease with Ni loading. Therefore, the Ni metal dispersion has a major effect on the NH3 conversion. In particular, Ni/13X-DP had a dispersion more than double those of Ni/SiO2 and Ni/BN, indicating that the even distribution of Ni active sites on the support surface improved the NH3 conversion. Fig. 8b shows the NH3 conversions obtained at 550 °C and different WHSVs, revealing that conversion decreased as the WHSV increased from 6000 to 45
000 mL gcat−1 h−1, 600 °C), the TOF of 10 wt% Ni/SiO2 (metal dispersion = 0.9%) prepared by the precipitation method49 and that of 9 wt% Ni/BN (metal dispersion = 1.1%)50 were 12.4 and 16.0 s−1, respectively, which were higher than those of the Ni/13X-DP catalyst (metal dispersion = 2.71%); however, the NH3 conversions of these catalysts (36.4% and 48.1%, respectively) were lower. In addition, previous studies51,52 reported that the catalytic activity improved while the TOF tended to decrease with Ni loading. Therefore, the Ni metal dispersion has a major effect on the NH3 conversion. In particular, Ni/13X-DP had a dispersion more than double those of Ni/SiO2 and Ni/BN, indicating that the even distribution of Ni active sites on the support surface improved the NH3 conversion. Fig. 8b shows the NH3 conversions obtained at 550 °C and different WHSVs, revealing that conversion decreased as the WHSV increased from 6000 to 45![[thin space (1/6-em)]](https://www.rsc.org/images/entities/char_2009.gif) 000 mL gcat−1 h−1, following the order of Ni/13X-DP > Ni/13X-IMP > Ni/13X-IE even at high WHSVs. Fig. 8c shows the Arrhenius plot for NH3 decomposition over Ni/zeolite 13X catalysts. The effect of the catalyst preparation method on the apparent activation energy of NH3 decomposition was determined in the NH3 conversion range of 10–20% at a WHSV of 30
000 mL gcat−1 h−1, following the order of Ni/13X-DP > Ni/13X-IMP > Ni/13X-IE even at high WHSVs. Fig. 8c shows the Arrhenius plot for NH3 decomposition over Ni/zeolite 13X catalysts. The effect of the catalyst preparation method on the apparent activation energy of NH3 decomposition was determined in the NH3 conversion range of 10–20% at a WHSV of 30![[thin space (1/6-em)]](https://www.rsc.org/images/entities/char_2009.gif) 000 mL gcat−1 h−1. Ni/13X-DP featured the lowest apparent activation energy (57.0 kJ mol−1), suggesting that the preparation method significantly enhanced catalytic activity. This finding is consistent with the low NH3 decomposition and N2 desorption temperatures of Ni/13X-DP observed by NH3-TPSR.53,54 Therefore, because of its low apparent activation energy and high N2 recombination and desorption rates, Ni/13X-DP exhibited the best low-temperature catalytic activity. To evaluate the stability of the prepared catalysts, we performed NH3 decomposition for 30 h at WHSV = 30
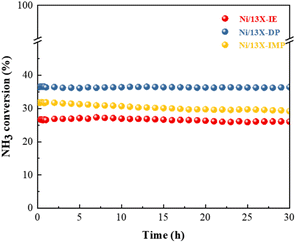
000 mL gcat−1 h−1. Ni/13X-DP featured the lowest apparent activation energy (57.0 kJ mol−1), suggesting that the preparation method significantly enhanced catalytic activity. This finding is consistent with the low NH3 decomposition and N2 desorption temperatures of Ni/13X-DP observed by NH3-TPSR.53,54 Therefore, because of its low apparent activation energy and high N2 recombination and desorption rates, Ni/13X-DP exhibited the best low-temperature catalytic activity. To evaluate the stability of the prepared catalysts, we performed NH3 decomposition for 30 h at WHSV = 30![[thin space (1/6-em)]](https://www.rsc.org/images/entities/char_2009.gif) 000 mL gcat−1 h−1 and 550 °C (Fig. 9). Ni/13X-IE and Ni/13X-DP showed stable activity with no decrease in initial conversion (26.6% and 36.5%, respectively) after 30 h. In the case of Ni/13X-IMP, the initial conversion of 31.8% decreased by 2.6% after 30 h, which was attributed to the low dispersion of Ni metal and its weak interaction with the support.
000 mL gcat−1 h−1 and 550 °C (Fig. 9). Ni/13X-IE and Ni/13X-DP showed stable activity with no decrease in initial conversion (26.6% and 36.5%, respectively) after 30 h. In the case of Ni/13X-IMP, the initial conversion of 31.8% decreased by 2.6% after 30 h, which was attributed to the low dispersion of Ni metal and its weak interaction with the support.
Conclusions
Ni/zeolite 13X catalysts with a Ni loading of 15 wt% were prepared using IE, DP, and IMP and utilized to realize COx-free H2 production through NH3 decomposition. The well-defined structure of the zeolite support allowed the uniform loading of Ni particles, the shape and dispersion of which were strongly influenced by the preparation method. Ni/13X-IE featured lamellar Ni phyllosilicate structures, while Ni/13X-IMP mainly featured spherical Ni particles on the zeolite surface, as confirmed by TEM. The morphology of Ni/13X-DP had the features of both Ni/13X-IE and Ni/13X-IMP, i.e., lamellar structure and uniformly dispersed spherical Ni particles were observed. As a result of the uniform distribution of Ni particles within the zeolite structure and their strong interaction with the support, reduction peaks were observed over a temperature range of 500–700 °C. For Ni/13X-IE and -DP, surface acidity changes such as a shift in LASs and an increase in the peak intensity of BASs were observed as Ni was ionically exchanged with Na. Among the prepared catalysts, Ni/13X-DP showed the lowest apparent activation energy of NH3 decomposition and achieved high NH3 conversion, high H2 formation rate, and stable activity at low temperatures.Author contributions
Jiyu Kim: synthesis, investigation, data curation, writing – original draft. Kyoung Deok Kim: methodology, data curation. Unho Jung: data validation, funding acquisition, project administration. Yongha Park: experimental analysis, visualization. Ki Bong Lee: supervision, writing – review and editing. Kee Young Koo: conceptualization, supervision, writing – review and editing.Conflicts of interest
There are no conflicts to declare.Acknowledgements
This work was supported by the Korea Institute of Energy Technology Evaluation and Planning (KETEP) grant funded by the Ministry of Trade, Industry & Energy (MOTIE) of the Republic of Korea (No. 20213030040550) and the Research and Development Program of the Korea Institute of Energy Research (KIER) (C3-2417).References
- G. Plant, E. A. Kort, A. R. Brandt, Y. Chen, G. Fordice, A. M. Gorchov Negron, S. Schwietzke, M. Smith and D. Zavala-Araiza, Science, 2022, 377, 1566 CrossRef CAS PubMed.
- I. Lucentini, X. Garcia, X. Vendrell and J. Llorca, Ind. Eng. Chem. Res., 2021, 60, 18560 CrossRef CAS.
- A. M. Abdalla, S. Hossain, O. B. Nisfindy, A. T. Azad, M. Dawood and A. K. Azad, Energy Convers. Manage., 2018, 165, 602 CrossRef CAS.
- S. Niaz, T. Manzoor and A. H. Pandith, Renewable Sustainable Energy Rev., 2015, 50, 457 CrossRef CAS.
- B. L. Tran, S. I. Johnson, K. P. Brooks and S. T. Autrey, ACS Sustainable Chem. Eng., 2021, 9, 7130 CrossRef CAS.
- T. He, P. Pachfule, H. Wu, Q. Xu and P. Chen, Nat. Rev. Mater., 2016, 1, 1 Search PubMed.
- S. Giddey, S. P. S. Badwal, C. Munnings and M. Dolan, ACS Sustainable Chem. Eng., 2017, 5, 10231 CrossRef CAS.
- A. Valera-Medina, H. Xiao, M. Owen-Jones, W. I. F. David and P. J. Bowen, Prog. Energy Combust. Sci., 2018, 69, 63 CrossRef.
- A. Villalba-Herreros, R. d'Amore-Domenech, A. Crucelaegui and T. J. Leo, ACS Sustainable Chem. Eng., 2023, 11, 4716 CrossRef CAS.
- L. Lin, Y. Tian, W. Su, Y. Luo, C. Chen and L. Jiang, Sustainable Energy Fuels, 2020, 4, 3006 RSC.
- T. Bell and L. Torrente-Murciano, Top. Catal., 2016, 59, 1438 CrossRef CAS.
- Y.-Q. Gu, Z. Jin, H. Zhang, R.-J. Xu, M.-J. Zheng, Y.-M. Guo, Q.-S. Song and C.-J. Jia, J. Mater. Chem. A, 2015, 3, 17172 RSC.
- L. Yao, Y. Li, J. Zhao, W. Ji and C. Au, Catal. Today, 2010, 158, 401 CrossRef CAS.
- J. Zhang, H. Xu, X. Jin, Q. Ge and W. Li, Appl. Catal., A, 2005, 290, 87 CrossRef CAS.
- Y. Gu, Y. Ma, Z. Long, S. Zhao, Y. Wang and W. Zhang, Int. J. Hydrogen Energy, 2021, 46, 4045 CrossRef CAS.
- T. Kocer, F. E. Saraç-Öztuna, S. F. Kurtoğlu-Öztulum, U. Unal and A. Uzun, Energy Technol., 2022, 10, 2100794 CrossRef CAS.
- T. Barakat, J. C. Rooke, E. Genty, R. Cousin, S. Siffert and B.-L. Su, Energy Environ. Sci., 2013, 6, 371 RSC.
- X. Duan, G. Qian, Y. Liu, J. Ji, X. Zhou, D. Chen and W. Yuan, Fuel Process. Technol., 2013, 108, 112 CrossRef CAS.
- H. Inokawa, M. Maeda, S. Nishimoto, Y. Kameshima, M. Miyake, T. Ichikawa, Y. Kojima and H. Miyaoka, Int. J. Hydrogen Energy, 2013, 38, 13579 CrossRef CAS.
- G. Busca, Microporous Mesoporous Mater., 2017, 254, 3 CrossRef CAS.
- L. Wei, W. Haije, N. Kumar, J. Peltonen, M. Peurla, H. Grenman and W. de Jong, Catal. Today, 2021, 362, 35 CrossRef CAS.
- A. Luengnaruemitchai and A. Kaengsilalai, Chem. Eng. J., 2008, 144, 96 CrossRef CAS.
- X. Li, W. Ji, J. Zhao, S. Wang and C. Au, J. Catal., 2005, 236, 181 CrossRef CAS.
- Z. Wan, Y. Tao, H. You and J. Shao, Sustainable Energy Fuels, 2021, 5, 3182 RSC.
- Z.-P. Hu, C.-C. Weng, C. Chen and Z.-Y. Yuan, Appl. Catal., A, 2018, 562, 49 CrossRef CAS.
- H. Liu, H. Wang, J. Shen, Y. Sun and Z. Liu, Appl. Catal., A, 2008, 337, 138 CrossRef CAS.
- R. n. Nares, J. Ramírez, A. d. Gutiérrez-Alejandre, C. Louis and T. Klimova, J. Phys. Chem. B, 2002, 106, 13287 CrossRef CAS.
- X. Ju, L. Liu, P. Yu, J. Guo, X. Zhang, T. He, G. Wu and P. Chen, Appl. Catal., B, 2017, 211, 167 CrossRef CAS.
- T. Lehmann, T. Wolff, C. Hamel, P. Veit, B. Garke and A. Seidel-Morgenstern, Microporous Mesoporous Mater., 2012, 151, 113 CrossRef CAS.
- S. Kuhaudomlap, O. Mekasuwandumrong, P. Praserthdam, K. M. Lee, C. W. Jones and J. Panpranot, ACS Omega, 2022, 8, 249 CrossRef PubMed.
- B.-H. Chen, Z.-S. Chao, H. He, C. Huang, Y.-J. Liu, W.-J. Yi, X.-L. Wei and J.-F. An, Dalton Trans., 2016, 45, 2720 RSC.
- R. P. Ye, W. Gong, Z. Sun, Q. Sheng, X. Shi, T. Wang and Y. G. Yao, Energy, 2019, 188, 116059 CrossRef CAS.
- M. C. Bacariza, I. Graça, A. Westermann, M. F. Ribeiro, J. M. Lopes and C. Henriques, Top. Catal., 2016, 59, 314 CrossRef CAS.
- I. Graça, L. V. González, M. C. Bacariza, A. Fernandes, C. Henriques, J. M. Lopes and M. F. Ribeiro, Appl. Catal., B, 2014, 147, 101 CrossRef.
- R. Gómez-Reynoso, J. Ramírez, R. Nares, R. Luna and F. Murrieta, Catal. Today, 2005, 107, 926 CrossRef.
- R. Nares, J. Ramírez, A. d. Gutiérrez-Alejandre and R. Cuevas, Ind. Eng. Chem. Res., 2009, 48, 1154 CrossRef CAS.
- D. Wang, R. Xu, X. Wang and Y. Li, Nanotechnology, 2006, 17, 979 CrossRef CAS PubMed.
- K. Hadjiivanov, M. Mihaylov, D. Klissurski, P. Stefanov, N. Abadjieva, E. Vassileva and L. Mintch, J. Catal., 1999, 185, 314 CrossRef CAS.
- T. Zhang, Z. Tian and Q. Liu, Sustainable Energy Fuels, 2020, 4, 3438 RSC.
- Q. Jin, D. Fang, Y. Ye, S. Hou, F. He and J. Xie, Appl. Surf. Sci., 2022, 600, 154075 CrossRef CAS.
- F. Benaliouche, Y. Boucheffa, P. Ayrault, S. Mignard and P. Magnoux, Microporous Mesoporous Mater., 2008, 111, 80 CrossRef CAS.
- A. Jentys, K. Kleestorfer and H. Vinek, Microporous Mesoporous Mater., 1999, 27, 321 CrossRef CAS.
- M. E. Z. Velthoen, S. Nab and B. M. Weckhuysen, Phys. Chem. Chem. Phys., 2018, 20, 21647 RSC.
- T. Barzetti, E. Selli, D. Moscotti and L. Forni, J. Chem. Soc., Faraday Trans., 1996, 92, 1401 RSC.
- V. Zholobenko, C. Freitas, M. Jendrlin, P. Bazin, A. Travert and F. Thibault-Starzyk, J. Catal., 2020, 385, 52 CrossRef CAS.
- S. R. Kulkarni, N. Realpe, A. Yerrayya, V. K. Velisoju, S. Sayas, N. Morlanes and P. Castaño, Catal. Sci. Technol., 2023, 13, 2026 RSC.
- J.-L. Cao, Z.-L. Yan, Q.-F. Deng, Z.-Y. Yuan, Y. Wang, G. Sun, X.-D. Wang, B. Hari and Z.-Y. Zhang, Catal. Sci. Technol., 2014, 4, 361 RSC.
- T. Meng, Q.-Q. Xu, Y.-T. Li, J.-L. Chang, T.-Z. Ren and Z.-Y. Yuan, J. Ind. Eng. Chem., 2015, 32, 373 CrossRef CAS.
- T. V. Choudhary, C. Sivadinarayana and D. W. Goodman, Catal. Lett., 2001, 72, 197 CrossRef CAS.
- H. Ren, J. Cheng, H. Fang, F. Zhong, C. Chen, L. Lin and X. Lin, Appl. Catal., A, 2023, 664, 119344 CrossRef CAS.
- K. Okura, T. Okanishi, H. Muroyama, T. Matsui and K. Eguchi, ChemCatChem, 2016, 8, 2988 CrossRef CAS.
- X. Duan, G. Qian, Y. Liu, J. Ji, X. Zhou, D. Chen and W. Yuan, Fuel Process. Technol., 2023, 108, 112 CrossRef.
- Y. Qiu, E. Fu, F. Gong and R. Xiao, Int. J. Hydrogen Energy, 2022, 47, 5044 CrossRef.
- L. Li, F. Chen, J. Shao, Y. Dai, J. Ding and Z. Tang, Int. J. Hydrogen Energy, 2016, 41, 21157 CrossRef CAS.
Footnote |
| † Electronic supplementary information (ESI) available: Additional XRD, H2-TPR, TEM-EDS, NH3-TPSR-MS, and NH3-TPD-MS data pertaining to zeolite 13X-based catalysts and performance comparison with previously reported catalysts. See DOI: https://doi.org/10.1039/d3se01426f |
| This journal is © The Royal Society of Chemistry 2024 |

