 Open Access Article
Creative Commons Attribution 3.0 Unported Licence
Ammonia synthesis from nitrogen and steam using electrochemical cells with a hydrogen-permeable membrane and Ru/Cs+/C catalysts†
Shintaroh
Nagaishi
,
Rika
Hayashi
,
Aika
Hirata
,
Raisei
Sagara
and
Jun
Kubota
 *
*
Department of Chemical Engineering, Fukuoka University, 8-19-1, Nanakuma, Jonan-ku, Fukuoka 814-0180, Japan. E-mail: jkubota@fukuoka-u.ac.jp
First published on 17th January 2024
Abstract
The ammonia (NH3) synthesis from nitrogen (N2) and steam (H2O) using electrochemical cells with a hydrogen-permeable membrane, Ru/Cs+/C catalysts, and CsH2PO4/SiP2O7 electrolytes at 250 °C was investigated. The highest formation rate was achieved in the hydrogen-permeable membrane cell with 30 wt%-Ru/Cs+/VXC72R catalysts, where VXC72R represents a carbon black powder of Cabot Vulcan XC-72R, reaching 32 nmol s−1 cm−2 at 60 mA cm−2, 1.0 MPa, and 250 °C, corresponding to 15% current efficiency for NH3 formation. This rate can be converted to 1.8 mmol h−1 gcat−1 as a catalyst-based unit. At 10 mA cm−2, 1.0 MPa, and 250 °C, a rate of NH3 formation of 9.8 nmol s−1 cm−2 was obtained with a corresponding current efficiency of 28%. The rate of NH3 formation under this condition was close to the maximum current efficiency of 36% determined by the theoretical chemical equilibrium on thermodynamics. Three-electrode measurements with a reference electrode were conducted on the present cell. It was observed that the anode exhibited significant overpotential, especially at higher current density.
1. Introduction
Ammonia (NH3) is presently synthesized from atmospheric nitrogen (N2) and hydrogen (H2), primarily obtained from fossil resources, such as natural gas and coal, through a catalytic process known as the Haber–Bosch process.1–3 Approximately 85% of NH3 is extensively utilized in the production of artificial fertilizers, for supporting our food supply, while the remainder serves as a critical raw material for various chemicals, including plastics such as urea resin and polyamide.4,5 The use of NH3 as a fuel lacks motivation if produced from fossil resources, contributing to CO2 emissions. However, its potential as an efficient and sustainable fuel arises if NH3 can be produced from N2 and H2O using renewable energy.5–9In the early stages of industrial NH3 synthesis, NH3 was synthesized from H2 produced by water electrolysis based on hydropower plants and the catalytic NH3 process.10 In several countries, NH3 is still being produced in this way.10 Indeed, water electrolysis using hydropower is well-suited for the NH3 synthesis process, as it can produce H2 at a steady rate. However, a contemporary challenge revolves around the conversion of renewable power sources with notable fluctuations, such as solar photovoltaics, solar thermal power, and wind power, which exhibit daily, weekly, monthly, and seasonal variations, into chemical energy. Conventional catalytic processes require steady-state operation due to heat management considerations in several components. The development of a method for producing NH3 from N2 and H2O that is small-scale, decentralized, and easily adaptable to start and stop, similar to fuel cells, is essential.
In this context, the electrochemical synthesis of NH3 has garnered significant attention, with numerous efforts being made in this field.11–20 However, even after reviewing the results of numerous studies, we believe that there are very few reported examples that practically lead to an industrial-scale method for NH3 synthesis. Electrochemical NH3 synthesis via the electrochemical nitrogen reduction reaction (EC-NRR) at room-temperature has yielded only trace amounts of NH3 in most cases, with precision in NH3 detection being a concern.19,20 While the Li-mediated EC-NRR appears to be a highly promising method,21–25 it is thought to involve the use of metallic Li, an energy-dense substance much higher in energy content than H2, raising doubts about whether NH3 can be obtained at voltages similar to that for water electrolysis. Moreover, there are numerous examples for synthesizing NH3 using sacrificial reagents such as alcohols, and research cases that do not involve H2O and N2 are also widely observed.
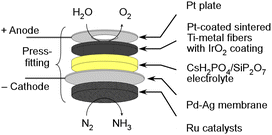
In our research group, we have been investigating the feasibility of NH3 synthesis by integrating NH3 synthesis catalysts into the cathode of water electrolysis.26–28 We have been using promising phosphate electrolytes operating at temperatures between 200 and 300 °C. There have been numerous reports of successful applications of this electrolyte in fuel cells and electrolytic synthesis, suggesting high potential.26–37 However, when applying a homogenous mixture of the cathode catalyst and NH3 synthesis catalyst to the cathode, we encountered issues with the variability of NH3 synthesis rates due to the coverage of the NH3 synthesis catalyst surfaces with the electrolyte, resulting in non-reproducible and inconsistent outcomes. To address this challenge, we devised a novel approach by using a Pd alloy hydrogen-permeable membrane to separate the cathode from the catalyst layer. The illustration of a cell is depicted in Fig. 1. Unfortunately, the electrochemical N2 reduction reaction cannot take place in this cell due to the isolation of the catalyst from the electrolyte. Nevertheless, this approach allowed us to sustain the activity of the catalytic NH3 synthesis reaction for an extended period. Because of this innovation, we successfully achieved electrochemical NH3 synthesis with conversion rates close to thermodynamic equilibrium. In this electrochemical cell, it is possible to synthesize NH3 at voltages close to those for water electrolysis, and a high energy efficiency for NH3 production is expected. In this research paper, we will focus on summarizing recent progress and achievements in the synthesis of NH3 using the present electrochemical system.
In this article, it is mentioned that synthesis of NH3 from N2 and H2O using the present electrochemical system was performed with a hydrogen-permeable membrane cell with Ru/Cs+/C catalysts and phosphate electrolyte at around 250 °C. The aim of this article is to demonstrate the synthesis of NH3 from H2O and N2 using the proposed electrochemical cells with high efficiency and a high NH3 formation rate by improving both the anode and Ru catalyst. Subsequently, challenges towards the practical application of the proposed cell were comprehensively discussed based on measurements of overpotential using a reference electrode and impedance measurements. The carbon-supported Ru catalyst has been widely reported as an excellent catalyst showing high activity at low temperatures,38–42 and it is also a promising catalyst in this electrochemical system. The current density and total pressure in the experiments have been enhanced compared to that in our previous papers, suggesting that this method can be considered a more practical approach for the synthesis of NH3 using the present electrochemical system.
2. Experimental
2.1 Catalyst synthesis
Carbon support materials, specifically carbon black samples of VULCAN XC-72R and BLACK PEARLS 2000 (Cabot Co.), as well as multi-wall carbon nanotubes NC-7000 (Nanocyl SA), were purchased, and they are hereafter referred to as VXC72R, BP2000, and MWCNTs. MWCNTs were refluxed in boiling hydrochloric acid until the color of the hydrochloric acid disappeared, removing metal impurities such as iron. The carbon support materials were subjected to a 1 h calcination process at 400 °C in ambient air to eliminate impurities. A tetrahydrofuran (THF, FUJIFILM Wako Chemicals Co.) solution of triruthenium dodecacarbonyl (Ru3(CO)12, TANAKA Kikinzoku Kogyo K. K.) was prepared at a predetermined concentration. The carbon material powder was immersed in the Ru3(CO)12/THF solution for 4 h with continuous stirring. The solvent was then removed from the suspension using a rotary evaporator at 40 °C under reduced pressure to prevent the decomposition of Ru3(CO)12. The resulting powder was subsequently calcined at 400 °C under vacuum conditions. This procedure yielded Ru/C.Next, Ru/C was immersed in an aqueous solution of cesium nitrate (CsNO3, FUJIFILM Wako Chemicals Co.) for 4 h with continuous stirring. The solvent was removed from the suspension using a rotary evaporator. The resulting powder was then calcined at 400 °C in a flow of H2 at a rate of 50 cmSTP3 min−1 for 2 h. Here, STP is an abbreviation for standard temperature and pressure, and refers to values converted to 0 °C and 0.101 MPa. The resulting catalyst was denoted as Ru/Cs+(1.0)/C, with the chemical state of Cs remaining unknown, whether it is in the form of a carbonate, hydroxide, or oxide, and is thus represented as Cs+. The number in parentheses after Cs+ indicates the molar ratio of Cs+ relative to Ru.
The preparation method for oxide-supported Ru catalysts is described in our previous paper.26–28 MgO (500A, Ube Material Industries Ltd) was used after calcination at 500 °C in air. Essentially, the preparation process is identical to the method described above, with the exception that an oxide is utilized in place of carbon.
The catalysts were shaped into disks using a hydraulic press, and these disks were subsequently crushed. Granules ranging from 600 to 800 μm in size were then separated through sieving and used for experiments.
2.2 Electrolyte synthesis
Phosphate electrolytes composed of a CsH2PO4 and SiP2O7 composite were employed.26–28 Cesium dihydrogen phosphate (CsH2PO4) was synthesized by neutralizing phosphoric acid (H3PO4, FUJIFILM Wako Chemical Co.) with an aqueous solution of Cs2CO3 (FUJIFILM Wako Chemical Co.) and subsequently dried at 120 °C. SiP2O7 was prepared by kneading a stoichiometric mixture of H3PO4 and silica (SiO2, Sigma-Aldrich) for 1 h to obtain a homogeneous viscous slurry. This slurry was calcined at 200 °C in air for 3 h. The resulting lumps were crushed using a mortar, and the powder was ultimately calcined at 500 °C in air for 3 h. CsH2PO4 and SiP2O7 in a 1![[thin space (1/6-em)]](https://www.rsc.org/images/entities/char_2009.gif) :
:![[thin space (1/6-em)]](https://www.rsc.org/images/entities/char_2009.gif) 2 molar ratio were then mixed in a mortar and pressed to form a 20 mm diameter and 2 mm thick disk. The aim is to store electrolyte material powders and electrolyte disks in a vacuum desiccator.
2 molar ratio were then mixed in a mortar and pressed to form a 20 mm diameter and 2 mm thick disk. The aim is to store electrolyte material powders and electrolyte disks in a vacuum desiccator.
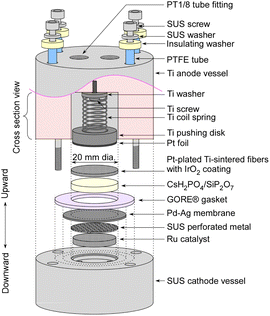
2.3 Electrochemical cells
The detailed structure of an electrochemical cell is depicted in Fig. 2. The Ru catalyst granules were positioned within a space 18 mm in diameter and 2.5 mm in height in the cathode vessel made of steel use stainless (SUS). The catalyst quantities were approximately 0.4 g for MgO-supported catalysts, and approximately 0.2 g for carbon-supported catalysts. On the top of the catalyst granules, a perforated plate made of SUS was placed to prevent warping of the Pd–Ag membrane. The perforated holes had a diameter of 1 mm, which was considerably larger than that of the catalyst granules. Both the top surfaces of the perforated plate and the cathode vessel were flat, and a Pd–Ag membrane 25 mm in diameter and 0.1 mm in thickness was positioned on top. The Pd–Ag membrane had an atomic ratio of 25% Ag and was supplied by TANAKA Kikinzoku Kogyo K. K.An electrolyte disk consisting of CsH2PO4/SiP2O7 was positioned on top of the Pd–Ag membrane. A GORE hyper-sheet gasket (W. L. Gore & Associates, Inc.), 2 mm in thickness, made of polytetrafluoroethylene (PTFE), was cut into a ring with an outer diameter of 30 mm and an inner diameter of 20 mm. The anode was a 20 mm diameter and 1 mm thick Ti metal fiber-sintered disk which was Pt-plated, which was supplied by Bekaert. IrO2 ink, composed of 9.4 mg of IrO2 powder (TANAKA Kikinzoku Kogyo K. K.), 250 μL of isopropanol (FUJIFILM Wako Chemical Co.), and 36 μL of PTFE suspension (60 wt%, Sigma Aldrich), was applied to the front face of a 20 mm disk and left to dry at room temperature. All of these components were compressed using a Ti pushing disk along with a Ti coil spring. Additionally, Pt foil was spot-welded onto the front face of the Ti pushing disk to maintain suitable electrical conductivity of the Pt-plated Ti-sintered disk.
2.4 Apparatus
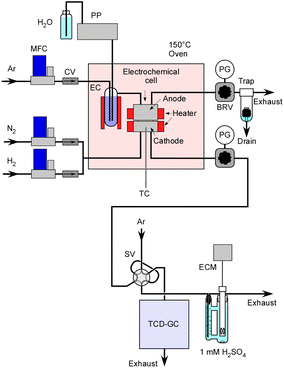
A schematic representation of the equipment setup is presented in Fig. 3. The electrochemical cell was placed inside an oven maintained at 150 °C to prevent steam condensation. In order to continuously supply steam to the cell, liquid H2O was introduced into an Ar flow within an evaporation chamber operating at 180 °C, and this chamber was filled with ceramic beads. Initially, H2 was used for the catalyst pretreatment at 250 °C. It also served for conducting a leak check on the system using a portable H2 detector with pressurization prior to the experiments.The concentration of H2 in the exhaust gas from the cathode vessel was analysed using a gas chromatograph with a thermal conductivity detector. Production rates of H2 were estimated in relation to the flow rate of N2. The absolute amount of NH3 was determined based on the change in electrical conductivity of a 1.0 mM H2SO4 solution which was bubbled with the exhaust gas. Unlike gas chromatography analysis, this measurement method is notable for its high accuracy as it is not influenced by the flow rate of N2. In this experiment, the N2 flow rate is relatively low, often in the range of a few cmSTP3 min−1, and especially at higher pressures, the flow rate accuracy is not very satisfactory.
To perform electrolysis, a direct current-regulated power supply (P4K40-0.6, Matsusada Precision Inc.) was connected to the cell and operated in constant current mode at the specified current. A data logger (GL-100, Graphtec Co.) was used for the acquisition of cell voltage and current.
In three-electrode measurements, the cell was driven by a power supply with a current sweep, and the potential of the reference electrode was monitored using a potentiostat (HSV-110, Meiden Hokuto Co.) in rest potential measurement mode. The cathode vessel and reference electrode for three-electrode measurements are illustrated in Fig. 4. A Pt wire with 0.5 mm diameter was used as a reference electrode, and the top of the Pt wire was attached to the electrolyte through the hole in the Pd–Ag membrane on the cathode side. Since the cathode vessel was filled with H2 during the three-electrode measurements, the potential of the electrode was equivalent to the reversible hydrogen electrode (RHE) potential. In three-electrode measurements, no catalyst was used in the cell, and only the electrochemical properties were investigated.
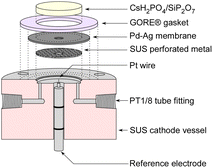 | ||
| Fig. 4 Illustration of the cross section of the cathode vessel and reference electrode for three-electrode measurements. | ||
For impedance measurements, a potentiostat with an impedance analyser (HZ-7000, Meiden Hokuto Co.) was used for the two-electrode cell. The impedance measurements were conducted after confirming that NH3 could be synthesized as usual.
3. Results and discussion
3.1 Activity of various Ru catalysts for catalytic NH3 synthesis
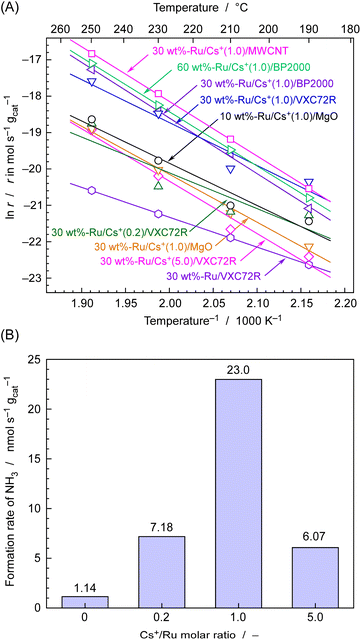
The rate of NH3 formation for various carbon-supported and MgO-supported Ru catalysts was first investigated using fixed-bed flow-type vertical reactors at temperatures ranging from 190 to 250 °C and an absolute pressure of 0.1 MPa. A total of 0.10 g of Ru catalyst was placed in a tubular reactor made of quartz glass. The feed gas was supplied with a stoichiometric ratio of N2 and H2 and total flow of 4 cmSTP3 min−1. Fig. 5(A) shows the rate of NH3 formation for various catalysts at different temperature expressed as an Arrhenius plot. Fig. 5(B) displays the rate of NH3 formation at 250 °C for 30 wt%-Ru/Cs+/VXC72R with changing Cs+/Ru molar ratios, as extracted from Fig. 5(A).It is well known that the activity of Ru catalysts for NH3 formation is significantly enhanced by the addition of promoters of alkali metal and alkali earth metal compounds such as Cs+.38,42–46Fig. 5(B) shows the NH3 formation rates measured at 250 °C with various Cs/Ru ratios for 30 wt%-Ru/Cs+/VXC72R. The maximum formation rate of 23 nmol s−1 g−1 was achieved at Cs/Ru = 1, resulting in a more than tenfold increase in the formation rate of NH3 compared to that of Cs/Ru = 0. Therefore, the value of Cs/Ru was set to 1 for the preparation of Ru/Cs+/VXC72R, Ru/Cs+/BP2000, Ru/Cs+/MWCNT, and Ru/Cs+/MgO.
As shown in Fig. 5(A), for MgO-supported Ru catalysts, increasing the Ru loading from 10 to 30 wt% led to a decrease in the rate of NH3 formation, and there were concerns about agglomeration of Ru particles. On the other hand, in the case of carbon-supported Ru catalysts, 30 wt%-Ru/Cs+(1.0)/BP2000 and 60 wt%-Ru/Cs+(1.0)/BP2000 had similar rates of NH3 formation, and a Ru loading of about 30 wt% was thus considered to be the appropriate amount. It should be noted that the specific surface areas of MgO, VXC72R, BP2000, and MWCNT are found to be 28–38,48 250,49 1400–1500,50 and 480 m2 g−1,51 respectively. The carbon support has a significantly high surface area compared to the magnesia support, and it is evident that it is well-suited for highly dispersed loading at a high carrying capacity. The NH3 formation rates for carbon-supported Ru catalysts were in the order of Ru/Cs+(1.0)/MWCNT > Ru/Cs+(1.0)/BP2000 > Ru/Cs+(1.0)/VXC72R, which exhibited a NH3 formation rate of 49, 32, and 23 nmol s−1 gcat−1 at 250 °C, respectively. These values correspond to a 4–8 times higher formation rate compared to 6.2 nmol s−1 gcat−1 of 10 wt%-Ru/Cs+(1.0)/MgO. Therefore, carbon-supported Ru catalysts have higher potential as catalysts for electrochemical cells using phosphate electrolyte operating in the temperature range of 190–250 °C. The Arrhenius plots exhibit an excellent fit to straight lines, and the apparent activation energies (Ea) determined from the slopes for Ru/Cs+/CNT, Ru/Cs+/BP-2000, and Ru–Cs+/MgO were 125, 127, and 109 kJ mol−1, respectively. These values are consistent with typical apparent activation energies for Ru catalysts for NH3 synthesis.36,42–46 Ru/Cs+/CNT and Ru/Cs+/BP-2000 exhibited similar apparent activation energies. This indicates that the effect of the support on the catalytic activity is not significant. The fact that the apparent activation energy remains unchanged with electron donation has long been known.1 The addition of promoters does not accelerate the reaction rate by reducing the apparent activation energy.1
TEM images of carbon-supported Ru catalysts are shown in Fig. 6. Ru nanoparticles were widely dispersed in all carbon supports. Both Ru/Cs+/VXC72R and Ru/Cs+/BP2000 exhibited a relatively uniform dispersion of Ru nanoparticles, whereas Ru/Cs+/CNT showed some agglomerations of Ru nanoparticles. The average particle sizes of Ru obtained from TEM images were 2.8 nm for Ru/Cs+/VXC72R, 1.9 nm for Ru/Cs+/BP2000, and 5.5 nm for Ru/Cs+/CNT, respectively. Carbon nanotubes are believed to have fewer surface defects, which could serve as anchoring sites for the Ru support, compared to carbon black. This suggests that carbon black is more suitable for achieving high dispersion of Ru when prepared from Ru3(CO)12 by evaporative drying. TEM images reveal the aggregation of Ru nanoparticles on CNTs. Nevertheless, Ru/Cs+/CNT exhibited the highest NH3 formation rate. This is believed to be the electron-donating effect on Ru nanoparticles due to the high electron density on the surface of CNTs.47
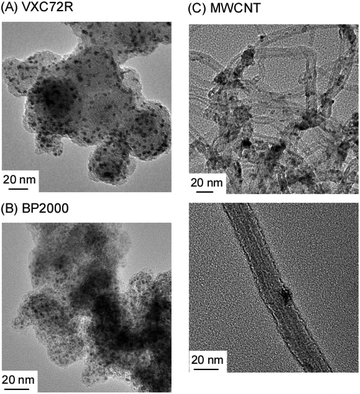 | ||
| Fig. 6 TEM images of 30 wt%-Ru/Cs+(1.0)/VXC72R (A), 30 wt%-Ru/Cs+(1.0)/BP2000 (B), and 30 wt%-Ru/Cs+(1.0)/MWCNT (C). | ||
3.2 NH3 synthesis using electrochemical cells
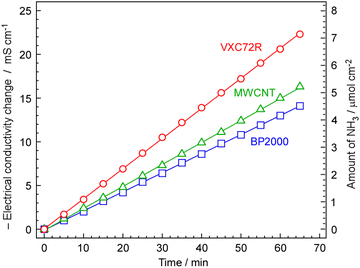
The rate of NH3 formation was investigated using the proposed electrochemical cells and carbon-supported Ru catalysts, 30 wt%-Ru/Cs+(1.0)/VXC72R, 30 wt%-Ru/Cs+(1.0)/BP2000, and 30 wt%-Ru/Cs+(1.0)/MWCNT. The cell was operated at 250 °C, an absolute pressure of 0.1 MPa, and a current density of 10 mA cm−2. The generated NH3 was trapped in 1 mM H2SO4, and NH3 formation rates were calculated from the change in electrical conductivity, as shown in Fig. 7. To optimize the rate of NH3 formation, the flow of N2 was at a rate of 3 cmSTP3 min−1 for a current density of 10 mA cm−2. Calculating the amount of hydrogen generated at this current density results in a ratio of H2/N2 = 0.07 relative to the flow of N2. This ratio exceeds the stoichiometric ratio of H2/N2 = 3, as optimized in our previous work.13–15 For all carbon-supported Ru catalysts, there was a continuous change in electrical conductivity, indicating that NH3 was steadily synthesized using the proposed electrochemical cells and carbon-supported Ru catalysts. The NH3 formation rates for carbon-supported Ru catalysts in the synthesis of NH3 from N2 and H2O using the present electrochemical system were in the order of Ru/Cs+/Vulcan > Ru/Cs+/MWCNT > Ru/Cs+/BP2000, which exhibited a NH3 formation rate of 1.84, 1.35, and 1.17 nmol s−1 cm−2, respectively. The discrepancy in the activity sequence observed for the catalytic reaction in the flow reactor (Fig. 5) compared to the electrochemical synthesis (Fig. 8) is attributed to differences in catalyst loading into the cells. While the same weights of catalysts were set in the reactor for the measurement in Fig. 5, the amounts of catalysts are limited in the case of electrochemical cells. The thickness of the catalyst layer in the cell was approximately 2.5 mm and the amounts of Ru/Cs+/VXC72R, Ru/Cs+/MWCNT and Ru/Cs+/BP2000 were limited to ca. 64, 54 and 46 mg cm−2, respectively, due to the difference in bulk density of the carbon support. Due to mechanical structural constraints, the proposed electrochemical cell cannot vary the thickness of the catalyst layer. Therefore, the differences in obtained reaction rates are not attributable to the intrinsic catalytic activity per catalyst weight. Although the NH3 generation rate of Ru/Cs+/VXC72R was high, this can be attributed to the larger weight of the catalyst that could be loaded into the cell. The NH3 synthesis rates per catalyst weight for other top-performing catalysts shown in Fig. 5(A) were almost comparable. Ru/Cs+/VXC72R has a higher bulk density, which proved advantageous in this electrochemical cell.For 30 wt%-Ru/Cs+(1.0)/VXC72R, the rate of NH3 formation was calculated to be 2.12 nmol s−1 cm−2 from Fig. 7, which was the highest among the three kinds of carbon-supported Ru catalysts. The NH3 formation rate is thermodynamically limited by chemical equilibrium. Details of calculations for NH3 equilibrium concentration are explained in our previous report,25 and the individual calculation was performed using a freely provided software.52,53 Calculating the rate of NH3 formation on the basis of the theoretical chemical equilibrium, the attainment of chemical equilibrium for 30 wt%-Ru/Cs+(1.0)/VXC72R was derived as 84%, indicating that the rate of NH3 formation was almost limited by the equilibrium.
3.3 Pressure dependence of NH3 synthesis
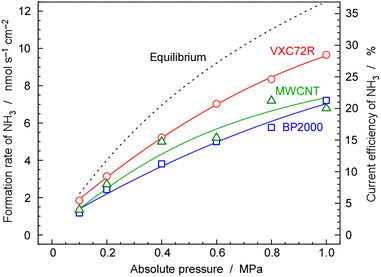
As mentioned above, NH3 synthesis is strongly limited by the chemical equilibrium. To increase the formation rate, the pressure inside the cell was increased from 0.1 to 1.0 MPa, at 250 °C and 10 mA cm−2. NH3 formation rates for 30 wt%-Ru/Cs+(1.0)/VXC72R, 30 wt%-Ru/Cs+(1.0)/BP2000, and 30 wt%-Ru/Cs+(1.0)/MWCNT were measured while increasing the pressure, as shown in Fig. 8. It is noted that the pressures of the cathode and anode sides were independently regulated by using the respective backpressure valves, but both pressures were controlled such that they were balanced at the same value. The NH3 formation rate consistently increased with increasing pressure, following the thermodynamic equilibrium limit shown by the dashed lines in Fig. 8. The rates of NH3 formation for the synthesis of NH3 from N2 and H2O using the present electrochemical system followed the order of Ru/Cs+(1.0)/VXC72R > Ru/Cs+(1.0)/MWCNT > Ru/Cs+(1.0)/BP2000 in any pressure range as shown in Fig. 8.In the proposed electrochemical cell, H is initially reduced to H2 through an electrochemical process, and the produced H2 is released into the gas phase in the catalyst layer. A portion of the released H2 undergoes conversion to NH3 through catalytic reactions. Consequently, we defined the current efficiency for NH3 formation (CENH3) as the ratio of H2 converted to NH3 relative to the Faraday efficiency of H2 formation (assumed to be 100%). Additionally, we defined the current efficiency for H2 formation (CEH2) as the proportion of unreacted H2. The CENH3 and CEH2 were thus calculated using the following formulae.
where CENH3 and CEH2 are the current efficiencies for NH3 and H2 formation in %, respectively, and rNH3 and rH2 are the rates of NH3 and H2 formation in mol s−1 cm−2, respectively. The variable j expresses the current density in A cm−2, and F is the Faraday constant of 96
![[thin space (1/6-em)]](https://www.rsc.org/images/entities/char_2009.gif) 485 C mol−1. Since the CENH3 is proportional to the rate of NH3 formation, the corresponding current efficiency is shown on the right axis.
485 C mol−1. Since the CENH3 is proportional to the rate of NH3 formation, the corresponding current efficiency is shown on the right axis.
Table 1 shows the values of rates and current efficiencies for NH3 and H2 formation for the three catalysts at 1.0 MPa and those for 30 wt%-Ru/Cs+(1.0)/VXC72R at various pressures, which are extracted from Fig. 8. The values for attainment of chemical equilibrium are also listed in Table 1. The highest rate and current efficiency for NH3 formation at 10 mA cm−2 and 1.0 MPa were 9.7 nmol s−1 cm−2 and 28%, respectively, for 30 wt%-Ru/Cs+(1.0)/VXC72R. In the typical industrial NH3 synthesis process, the concentration of NH3 at the reactor output is from 17 to 20% at pressures from 14 to 22 MPa.2 These yields can be converted to the conversion of H2 from 29 to 33%. The current efficiency for NH3 formation in the present system was found to have a similar conversion of H2 to that of the conventional commercial NH3 reactors. The fact that the reactor can be operated at a conversion rate equivalent to that of a realistic reactor proves that this method is practical.
| Sample | Pressure (MPa) | Formation rate (N mol s−1 cm−2) | Current efficiency (%) | AE (%) | ||
|---|---|---|---|---|---|---|
| NH3 | H2 | NH3 | H2 | |||
| Ru/Cs+/VXC72R | 0.1 | 1.8 | 57 | 5.3 | 111 | 84 |
| 0.2 | 3.1 | 56 | 9.1 | 107 | 78 | |
| 0.4 | 5.2 | 51 | 15 | 99 | 75 | |
| 0.6 | 7.0 | 48 | 20 | 93 | 76 | |
| 0.8 | 8.3 | 46 | 24 | 88 | 76 | |
| 1.0 | 9.7 | 44 | 28 | 85 | 77 | |
| Ru/Cs+/BP2000 | 1.0 | 7.2 | 28 | 21 | 54 | 58 |
| Ru/Cs+/MWCNT | 1.0 | 6.8 | 34 | 20 | 66 | 54 |
For practical applications, it is crucial to not only consider the current efficiency but also to increase the NH3 concentration in the exhaust gas. This is because a high concentration is crucial to liquefy the NH3 and separate it from the product. In this experiment, the H2/N2 ratio is exceptionally low at 0.07, resulting in a significantly low concentration of NH3 even at an electrical efficiency of 28%, which is 1.2%. The reason for setting a low H2/N2 ratio is to mitigate the poisoning of the Ru catalyst by H. In the future, to get a high NH3 concentration, it is important to develop catalysts that are not affected by H poisoning, allowing operation with a N2 supply close to the stoichiometric ratio.
Carbon-supported Ru catalysts are known to inhibit poisoning by H.42 However, the Ru/Cs+/VXC72R showed the maximum NH3 production rate at H2/N2 = 0.05–0.07 (see Fig. S1 in the ESI†), similar to the previously reported optimal value for Ru/Cs+/MgO. This shows that the hydrogen poisoning effect is not significantly different between MgO and carbon supports, and that a similar H2/N2 ratio is optimal.
The sum of current efficiencies for NH3 and H2 formation should be 100% theoretically. Therefore, the sum of current efficiencies for NH3 and H2 formation shown in Table 1 was almost 100%. However, when it was considered in detail, the sum varied between 75 and 116%. This issue has been discussed in the previous papers.23–25 This discrepancy may be due to the following reasons.
The amount of formation of NH3 was quantitated using electroconductivity changes of 1 M H2SO4 during titration. This method has absolute accuracy and the values are highly reliable. The numerical values are obtained by titrating the entire amount of NH3 produced in a matter of tens of minutes, allowing us to achieve highly accurate average rates.
However, the amount of formation of H2 was quantitated using a gas chromatograph as a ratio of H2 and N2 of exhaust gas. The accuracy of N2 flow rates is the key to obtain high accuracy of the rate of H2 formation. The typical flow rate of N2 at 10 mA cm−2 was only 3.0 cmSTP3 min−1, which was too small to be controlled accurately. Small leakage of N2 from the system contributed to overestimation of H2 formation. Gas chromatographs determine concentration ratios from a small amount of sampling, so they are easily affected by flow rate fluctuations. Another error should be considered. Especially at high pressures, the electrolyte layer has cross-leakage of H2 or O2. Inadequate sealing of the electrolyte or cracks in the electrolyte can cause the generated H2 and O2 to mix, react, and disappear, potentially reducing current efficiency. Due to the influence of these errors, the sum of current efficiencies slightly deviates from 100%, but it is not essentially 100% and it largely depends on experimental errors.
3.4 Temperature dependence of NH3 synthesis
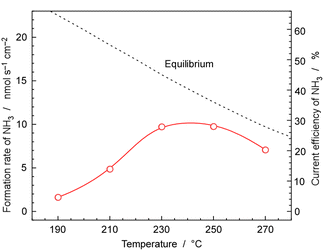
Fig. 9 shows the rates and current efficiency of NH3 formation for 30 wt%-Ru/Cs+(1.0)/VXC72R at temperatures ranging from 190 to 270 °C at 1.0 MPa pressure and a current density of 10 mA cm−2. The current efficiency for NH3 formation reached a maximum of 28% at 230 and 250 °C. However, at 270 °C, the current efficiency for NH3 formation dropped to 20%. At 190 °C and 210 °C, the current efficiency for NH3 formation was 14% and 4.7%, respectively. The dashed line in Fig. 9 represents the temperature-dependent rate of NH3 formation derived theoretically from the chemical equilibrium. Since the equilibrium limit decreases with increasing temperature, the rate of NH3 formation decreased at 270 °C. The values for equilibrium attainment at 250 °C and 270 °C were both estimated to be around 75%, indicating that NH3 synthesis is almost limited by chemical equilibrium.The reason for the equilibrium attainments not reaching 100% is unclear, but it might be attributed to the different reaction kinetics at high NH3 concentrations near equilibrium conditions from that at low NH3 concentrations, which leads to a decrease in catalytic activity. Another possibility is that the real temperature of the catalyst layer was different from that of cathode vessel, due to the exothermic heat of NH3 synthesis. NH3 synthesis is a well-known exothermic reaction of 31 kJ molH2−1, and the practical temperature at the catalyst layer may be higher by several degrees Celsius. One concern is the potential non-uniform gas composition within the catalyst layer, as there is a possibility that the N2 supplied from outside and the H2 generated in the cathode were flowing in opposite directions. Therefore, experiments were conducted by recirculating the exhaust gas at a higher flow rate to alter the gas mixing conditions within the catalyst layer. However, since no significant change in equilibrium attainment was observed, it was considered that the deviation from equilibrium was not due to the influence of gas mixing.
At temperatures below 230 °C, the current efficiency for NH3 formation significantly falls below the equilibrium values, indicating that the process was kinetically limited due to the insufficient catalytic activity. It was found that the optimal temperature range for cell operation is 230 °C to 250 °C when using 30 wt%-Ru/Cs+(1.0)/VXC72R at 10 mA cm−2 and 1.0 MPa.
3.5 Cell voltage at various current densities
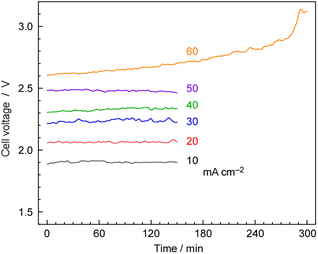
Fig. 10 shows the typical time courses of cell voltages at different current densities at 250 °C, and 1.0 MPa. The cell voltage was approximately 1.9 V at 10 mA cm−2 and increased to 2.5 V at 50 mA cm−2, with the cell voltage remaining stable for 150 min. However, at 60 mA cm−2, the cell voltage gradually increased over time due to cell degradation. In our previous work, we observed a significant increase in cell voltage in the case of the hydrogen-permeable membrane electrochemical cell when the current density exceeded 30 mA cm−2.25 As explained in the experimental section, the anode was constructed using IrO2 on Pt-plated Ti-sintered fibres, which differs from the Pt/Carbon-paper used in our previous report.25 These modifications helped prevent anode corrosion by phosphate, allowing high-current-density operation up to 50 mA cm−2.3.6 NH3 synthesis at high current density
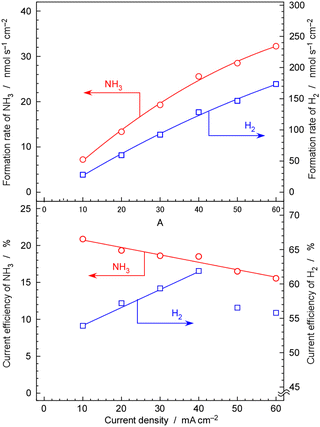
Fig. 11 show rates and current efficiency of NH3 formation for a 30 wt%-Ru/Cs+(1.0)/VXC72R catalyst at 250 °C and 1.0 MPa with varying current densities. The sum of the current efficiencies of NH3 and H2 formation was 75%, which deviates significantly from the expected 100%. In the discussion for Fig. 10 and 11, it was explained that the rate and current efficiency of NH3 formation at 10 mA cm−2, 1.0 MPa, and 250 °C were 9.7 nmol s−1 cm−2 and 28%, respectively. However, in Fig. 11, the rate and current efficiency of NH3 formation under the corresponding conditions were 7.5 nmol s−1 cm−2 and 21%, which is somewhat different from those in Fig. 10 and 11.As the current density increased, both the rate and current efficiency of NH3 formation consistently increased. The highest rate of NH3 formation reached 32 nmol s−1 cm−2 at 60 mA cm−2. When converted to a rate per catalyst weight, this value becomes 1.8 mmol h−1 gcat−1. Nishi et al. reported a rate of NH3 formation of approximately 2 mmol h−1 gcat−1 at 1.0 MPa and 260 °C using a Ru catalyst (10 wt%-Ru) with Cs promoters supported on carbon nanotubes in the typical NH3 synthesis reaction from N2 and H2.42 Kitano et al. also summarized the rates of NH3 formation for their Ru catalysts in the temperature range from 200 to 340 °C in the typical NH3 synthesis reaction from N2 and H2.54 However, in this literature study, the loading amount of Ru was 2 wt%, and the pressure was 0.1 MPa, resulting in NH3 formation rates of less than 1 mmol h−1 gcat−1.54 Note that in these reports of the typical NH3 synthesis reaction from N2 and H2, a weight hourly space velocity (WHSV)42,54 of 36![[thin space (1/6-em)]](https://www.rsc.org/images/entities/char_2009.gif) 000 cm3 h−1 gcat−1 and a gas hourly space velocity (GHSV)42 of 7000 h−1 were employed. In the present study, the WHSV and GHSV of the N2 reactant were calculated to be 900 cm3 h−1 gcat−1 and 230 h−1, respectively, for 30 wt%-Ru/Cs+(1.0)/VXC72R. At low space velocities and under conditions close to chemical equilibrium, the rate of NH3 formation tends to be low. Despite our conditions being less favourable compared to those reported in previous papers, the present work achieved a similar level of rate of NH3 formation as reported in these papers.42,54 This high synthesis rate can be attributed to the suppression of hydrogen poisoning achieved by conducting NH3 synthesis reactions under low hydrogen partial pressure conditions of H2/N2 = 0.07. In the case of Ru catalysts, the reaction order for partial pressure of H2 is typically a negative value although H2 is a reactant.45 The operation under nitrogen excess conditions is key to the NH3 synthesis using the electrochemical system.
000 cm3 h−1 gcat−1 and a gas hourly space velocity (GHSV)42 of 7000 h−1 were employed. In the present study, the WHSV and GHSV of the N2 reactant were calculated to be 900 cm3 h−1 gcat−1 and 230 h−1, respectively, for 30 wt%-Ru/Cs+(1.0)/VXC72R. At low space velocities and under conditions close to chemical equilibrium, the rate of NH3 formation tends to be low. Despite our conditions being less favourable compared to those reported in previous papers, the present work achieved a similar level of rate of NH3 formation as reported in these papers.42,54 This high synthesis rate can be attributed to the suppression of hydrogen poisoning achieved by conducting NH3 synthesis reactions under low hydrogen partial pressure conditions of H2/N2 = 0.07. In the case of Ru catalysts, the reaction order for partial pressure of H2 is typically a negative value although H2 is a reactant.45 The operation under nitrogen excess conditions is key to the NH3 synthesis using the electrochemical system.
The current efficiency of NH3 formation linearly decreased with increasing current density, reaching 15% at 60 mA cm−2. In contrast, the current efficiency of H2 exhibited a consistent increase in current density from 10 to 40 mA cm−2. This indicates that the NH3 formation rate through catalytic reactions is insufficient compared to the rate of H2 formation by electrolysis of H2O. However, at 50 and 60 mA cm−2, the current efficiency of H2 was slightly decreased. This is likely due to the cross-leakage of cathode and anode gases by inappropriate sealing of the electrolyte at high current density. The electrolyte is in a nearly solid state, and if a crack occurs in the seal or disk, some H2 will escape through the crack from the electrolyte side to the anode side. Moreover, at high current densities, detachment between the Pd–Ag cathode and the electrolyte is possible, leading to the release of H2 towards the electrolyte side, creating cracks and causing leakage. There are instances where the destruction of the cell occurs at a certain current density, and such leaks were not observed at lower current densities. This is caused by the destruction of a solid electrochemical cell, and it seems to be a phenomenon that occurs when a certain limit is exceeded.
3.7 Three electrode measurements
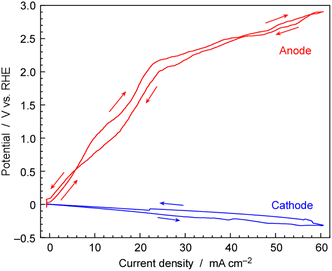
To evaluate the individual overpotentials of the cathode and anode, a three-electrode cell was utilized. The current density was swept at a rate of ±10 mA cm−2 h−1 within the range of 0 to 60 mA cm−2, and both potentials of the cathode and anode against the reference electrode of Pt wire in H2 ambient as shown in Fig. 12. The three-electrode cells consisted of the same cathode and anode as those in the NH3 synthesis using the electrochemical system and were regarded as electrochemically equivalent to the two-electrode cells for NH3 synthesis. The reactions and standard electrode potentials at the cathode and anode are as follows,| Cathode: 2H+ + 2e− → H2 (E0 = 0 V vs. RHE) |
| Anode: 2H2O → 4H+ + 4e− + 4O2 (E0 = 1.23 V vs. RHE) |
The reference electrode was surrounded with 0.1 MPa of H2 indicating that this electrode was acting as the reversible hydrogen electrode (RHE) for the proton concentration of CsH2PO4/SiP2O7 electrolyte. The cathode potential increased linearly with the increase in current density, reaching −0.31 V vs. RHE at 60 mA cm−2. This overpotential was considered to be due to resistance because of the linear relationship and it was most probably due to ionic conductivity of electrolyte.
The anode potential also increased with the increase in current density. However, the anode potential remained below the standard electrode potential of 1.23 V until the current density surpassed 15 mA cm−2. Water electrolysis cannot occur below 1.23 V, and a current density below 1.23 V can be non-faradaic current due to electric double-layer capacitance. This type of current flow should be temporal. In fact, for steady state electrolysis for electrochemical NH3 synthesis, the cell voltage was 1.8–2.5 V for 10–50 mA cm−2. It should be noted that during scanning within a finite scan time, a non-faradaic current was found. While it was not possible to separate the non-faradic current and the faradaic current at each potential in this experiment, on comparing with the relationship between cell potential and current density under steady-state conditions in Fig. 10, it can be observed that in the region above 20 mA cm−2, the cell voltage in Fig. 12 is approximately the same as the steady cell voltage in Fig. 10.
The potential on the anode side exceeded 2.0 V for current densities above 20 mA cm−2. This potential was significantly higher than the standard electrode potentials for O2 evolution. As the current density increased, the potential of the anode increased more noticeably compared to that of the cathode. The overpotential for the oxygen reduction reaction (ORR) and oxygen evolution reaction (OER), which are reverse reactions of each other, is typically the main component in the overpotential for fuel cells and water electrolysis. In the present study, it was found that the anode was a major factor contributing to a high cell voltage. The anode was made of IrO2 on a Pt-plated Ti metal fiber-sintered disk, but improvements in its properties are necessary for lowering the cell voltage. There is a possibility that Ti of the substrate of the anode is leaching into the electrolyte, as indicated in Table S1 in the ESI.† Metal Ti fibres might undergo oxidation at a high electrode potential and due to the acidity of phosphate, leaching Ti into the electrolyte. It is necessary to develop an anode resistant to phosphate corrosion. Three-electrode measurements revealed the insufficient performance of the anode.
3.8 Impedance measurements
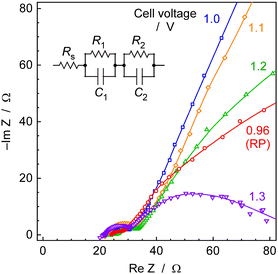
Fig. 13 illustrates Cole–Cole plots obtained from impedance measurements of electrochemical cells at 250 °C and 0.1 MPa. This plot is considered to consist of two semicircles, and its equivalent circuit is presumed to be similar to the circuit diagram in Fig. 13. The intersection of plots at high-frequency limits, for various cell voltages, ranged from 20 to 24 Ω at cell voltages of 0.96 to 1.3 V. This discrepancy is relatively minor, and there is no correlation between the intersection values and the cell voltages. Consequently, these variations fall within the scope of experimental error, and it was reasonable to assume, based on the average, that the intersection was 22 Ω. This intersection corresponds to Rs in the equivalent circuit. Considering this to be the ionic conductivity resistance in the CsH2PO4/SiP2O7 electrolyte, which is responsive at high frequencies, the electrolyte conductivity can be calculated to be approximately 3.4 mS cm−1 for an electrolyte area of 3.1 cm−2 and an electrolyte thickness of 2.0 mm.The ionic conductivity of CsH2PO4/SiP2O7 electrolyte was reported to be 44 mS cm−1 at 266 °C,55 and the conductivity obtained in the present study was significantly lower. There are several possible reasons for this.
Firstly, ohmic resistance may exist in addition to the solution resistance. While the cathode of the Pd alloy hydrogen-permeable membrane is precious metal foil and was not expected to have significant electrical resistance, the anode substrate, a Ti fiber-sintered disk with Pt plating, is considered to be covered with passivated surfaces or corroded by electrolytes under anodic conditions, potentially exhibiting ohmic resistance.
Secondly, humidity could strongly affect the conductivity of the CsH2PO4/SiP2O7 electrolyte, and the humidification in the present study might not have been appropriate. It was reported that more than 30% humidity was needed for high conductivity.56 The injection of 10 μLliq min−1 of H2O into the anode gas is equivalent to a 12 cmSTP3 min−1 flow of steam. Considering that the carrier is an Ar flow of 10 cmSTP3 min−1, the humidification seems to be higher than that reported in the literature.56 In this study, humidification was only performed from the anode side, and therefore, there remains a question regarding whether the humidification is sufficient. Additionally, as the anode is a titanium fiber-sintered disk with Pt-plating, on the order of several hundred μm, there is a lingering doubt about whether the porosity of the anode is adequate.
Thirdly, there is a possibility that the electrodes are peeling off from the electrolyte. The impedance measurements were conducted after steady-state electrochemical synthesis of NH3 to simulate the characteristics of an actual reaction condition, so a part of the electrodes could peel off from the electrolyte due to the evolution of H2 or O2.
Distinguishing among these several possibilities is challenging, but this issue is a subject for future research. We have not analysed components of impedance other than the intercept. The semicircle in the lowest frequency portion of Fig. 13 is believed to exhibit a dependency on cell voltage and includes reaction resistance. However, a more detailed examination is required for a thorough analysis, including determining whether it originates from the anode or cathode side.
The other impedance components such as R1, R2, C1, and C2 could not be assigned in this work. Because the shape of semicircles depended on the cell voltage, one of the impedance components might be attributed as a kinetic resistance and double layer capacitance. However, these results included both anode and cathode properties and detailed assignment was hard in this work.
3.9 General discussion
In our previous paper,15 we used the cathode side with Ru catalysts supported on MgO or CeO2, whereas in this paper, we used the cathode side with a carbon-supported Ru catalyst. This modification allowed us to demonstrate the synthesis of NH3 at a relatively high current efficiency for NH3 formation of 15% even at a high current density of 60 mA cm−2. Additionally, for the anode, in the previous report,15 we used a Pt-coated carbon paper, while in this paper, we used IrO2 loading on Pt-plated Ti fibres. The improvement in the anode design enables stable operation at 50 mA cm−2, surpassing the previous upper limit of 30 mA cm−2.At 10 mA cm−2 and 1.0 MPa, NH3 synthesis was achieved with 21–28% current efficiency for NH3 at a cell voltage of 1.9 V. The thermoneutral potential for the reaction producing NH3 from N2 and H2O is 1.32 V. At a cell voltage of 1.9 V, the 0.58 V difference corresponds to the energy lost as heat. Thus, 69% of the applied voltage is utilized for NH3 production. The current efficiency for NH3 formation is 21–28%, so the energy efficiency of NH3 production is estimated to be 14–19%. At 60 mA cm−2 and 1.0 MPa, the energy efficiency for NH3 production is calculated to be 7% from 15% current efficiency for NH3 formation and 2.7 V cell voltage. Improving current efficiency is crucial for enhancing the performance of this system. The current efficiency in this cell is largely constrained by the chemical equilibrium of catalytic reactions. Therefore, to achieve further improvements, it is necessary to either significantly lower the temperature and increase the pressure to broaden the equilibrium constraints, or incorporate processes such as unreacted gas separation and recirculation.
In the present electrochemical cell, the following elemental reactions occur:
Interface reactions
| Anode/electrolyte: H2O → 2H+ + 2e− + 1/2O2 | (1) |
| Cathode/electrolyte H+ + e− → H | (2) |
| Cathode/gas H → 1/2H2 | (3) |
| Ru catalyst/gas 3H2 + N2 → NH3 | (4) |
The essential feature of this cell is that reactions (2) and (4) are completely isolated by the Pd–Ag hydrogen-permeable membrane. Renouncing the direct electrochemical reduction of nitrogen and instead, correctly separating the reaction sites on the catalytic Ru sites for nitrogen hydrogenation and the cathode surface for proton reduction to hydrogen, is a key factor enabling this method to operate with a high hydrogen conversion rate comparable to that of the Haber–Bosch process of approximately 30%.
This approach does not completely abandon the goal of achieving conversion rates beyond the chemical equilibrium using electrochemical reactions. If the Ru catalyst can selectively catalyse the hydrogenation of dissociatively adsorbed nitrogen obtained through surface diffusion of hydrogen from the Pd hydrogen-separation membrane, rather than participating in the reaction where hydrogen is desorbed as a product, there is a possibility of attaining conversion rates beyond the chemical equilibrium. However, as of now, the development of such catalysts has not been realized.
In the present electrochemical cell, the rate of NH3 formation at 250 °C and 1 MPa was strongly limited by the chemical equilibrium as discussed in the previous section. Therefore, lowering temperature and increasing pressure are strategies for improving the current efficiency of NH3 formation. Recently, quite active catalysts at around 200 °C have been proposed by several research groups, and applying these catalysts is also a possible strategy.57–59 However, many of the recently reported catalysts require pretreatment at high temperatures, are irreversibly deactivated by atmospheric components, and are difficult to reactivate. Many of these catalysts are difficult to use in the present cell. At 200 °C, 1 MPa and H2/N2 = 0.07, the limit of the chemical equilibrium is 60% in current efficiency which is equivalent to hydrogen conversion. If the temperature can be lowered to 200 °C, current efficiency will be significantly improved.
As an alternative strategy, given that the current efficiency of this cell is close to the hydrogen conversion rate of the Haber–Bosch process, it may be feasible to combine gas separation from NH3 and recycling of unreacted gases, similar to the Haber–Bosch method. Even when operating at lower temperatures, down to 200 °C, the current efficiency derived from chemical equilibrium is only 60%, and 40% of the current is directed towards hydrogen. Considering the need for close to 100% current conversion in energy conversion technologies, employing a separation and recirculation approach similar to the Haber–Bosch method might be more practical.
From a different perspective, the current density experimented with in this cell, ranging from 10 to 60 mA cm−1, is approximately one-fifth of that in industrial electrochemical devices. In fact, the U.S. Department of Energy (DOE) has set a target in 2017 for electrolytic NH3 synthesis with a current density of 300 mA cm−2, aiming for 90% current efficiency and 60% energy conversion efficiency.60,61 Therefore, it is necessary to establish operation at five times the current density. Additionally, to anticipate a 60% energy conversion efficiency, even with improvements such as the recycling of unreacted gases to bring the apparent current efficiency close to 100%, the cell voltage must be below 2.2 V, calculated by multiplying the theoretical thermoneutral potential of 1.32 V divided by 60%. While the cell voltage is currently around 2.2 V up to only 30 mA cm−2, further consideration of techniques to reduce the cell voltage is still required.
The drawback of this method is that it relies on a rare precious metal, the Pd alloy, as the hydrogen-permeable membrane. The current membrane has a thickness of 0.1 mm. However, there are ways to further reduce this thickness. One approach is to produce a hydrogen-permeable membrane with a thickness of several μm by depositing a Pd alloy membrane on porous oxide substrates.62,63 The second method involves forming a Pd alloy membrane on the substrates of other hydrogen-permeable alloys, such as V–Ni alloys.64–66 Both methods can significantly decrease the amount of Pd used.
Another approach to avoid the utilization of the Pd alloy is to use a hydrophobic membrane filter to prevent electrolyte infiltration despite the presence of a Pd alloy membrane. In the case of methane synthesis from CO2 and H2O in a similar electrochemical cell, a hydrophobic membrane filter has been successfully used as a separator between the electrode and Ru catalysts.34 Unlike methane synthesis, NH3 synthesis requires a mechanism to prevent the NH3 product from being absorbed into the electrolyte. Therefore, it is necessary to carefully examine whether it is possible to use a hydrophobic membrane filter, but possibilities may arise by changing or tuning the electrolyte, among other factors. Nevertheless, there is no issue in continuing research using Pd at the laboratory level for the time being.
4. Conclusions
NH3 was synthesized from H2O and N2 using a carbon-supported Ru catalyst and a hydrogen-permeable membrane-type electrolysis cell at temperatures ranging from 200 to 250 °C. At 10 mA cm−2, 250 °C, and 1.0 MPa, with 30 wt%-Ru/Cs+(1.0)/VXC72R, an electrical current efficiency of 21 to 28% for NH3 was achieved. The NH3 formation rate is limited by both the chemical equilibrium (around 250–270 °C) and catalyst reaction rate (around 190–230 °C). At 60 mA cm−2, and 250 °C, and 1.0 MPa, the maximum NH3 formation rate of 32 nmol s−1 cm−2 was achieved with a current efficiency of 15%. At 10 mA cm−2 (1.9 V cell voltage) and 60 mA cm−2 (2.7 V cell voltage), the energy efficiencies for NH3 formation are calculated to be 14–19% and 7%, respectively. The development of a highly active catalyst for NH3 synthesis at temperatures lower than 200 °C, where the constraints of chemical equilibrium are weaker and high conversion rates are anticipated, is desired.Author contributions
Nagaishi primarily contributed to the investigation, which included experimental work, analysis of the obtained data, and paper writing. Hayashi, Hirata, and Sagara were primarily involved in practical experimental studies and data analysis. Kubota played a multifaceted role including supervision in this study.Conflicts of interest
There are no conflicts to declare.Acknowledgements
This article is based on results obtained from a project, JPNP14004, “Highly-efficient NH3 electrochemical synthesis technology from renewable energy electricity (FY2022-2023)”, commissioned by the New Energy and Industrial Technology Development Organization (NEDO), Japan.References
- A. Ozaki and K. Aika, Catalysis-Science and Technology, ed. J. R. Anderson and M. Boudart, Springer-Verlag KG, Berlin, 1981, vol. 1, pp. 87–158 Search PubMed.
- Ammonia: Catalysis and Manufacture, ed. A. Nielsen, Springer-Verlag, Berlin, 1995 Search PubMed.
- H. Liu, Ammonia Synthesis Catalysis, World Scientific and Chemical Industry Press, Singapore and Beijing, 2013 Search PubMed.
- M. Appl, Ammonia: Principles & Industrial Practice, Wiley-Vch, Weinheim, 1998 Search PubMed.
- International Renewable Energy Agency, Innovation Outlook: Renewable Ammonia, 2022, ISBN: 978-92-9260-423-3 Search PubMed.
- Sustainable Ammonia Production, ed. Inamuddin, R. Boddula and A. M. Asiri, Springer Nature, Switzerland, 2020 Search PubMed.
- I. Dincer, D. Erdemir, M. I. Aydin, H. Karasu and G. Vezina, Ammonia Energy Technologies, Springer Nature, Switzerland, 2022 Search PubMed.
- CO2 Free Ammonia as an Energy Carrier: Japan's Insights, ed. K. Aika and H. Kobayashi, Springer Nature, Singapore, 2023 Search PubMed.
- International Energy Agency, Ammonia Technology Roadmap, 2021 Search PubMed.
- A. Valera-Medina, F. Amer-Hatem, A. K. Azad, I. C. Delouse, M. de Joannon, R. X. Fernandes, P. Glarborg, H. Hashemi, X. He, S. Mashruk, J. McGowan, C. Mounaim-Rouselle, A. Ortiz-Prado, A. Ortiz-Valera, I. Rossetti, B. Shu B, M. Yehia, H. Xiao and M. Costa, Energy Fuels, 2021, 35, 6964–7029 CrossRef CAS.
- R. F. Service, Science, 2018, 361, 120–123 CrossRef CAS PubMed.
- S. Giddey, S. P. S. Badwal and A. Kulkarni, Int. J. Hydrogen Energy, 2013, 38, 14576–14594 CrossRef CAS.
- I. A. Amar, R. Lan, C. T. G. Petit and S. Tao, J. Solid State Electrochem., 2011, 15, 1845–1860 CrossRef CAS.
- X. Guo, Y. Zhu and T. Ma, J. Energy Chem., 2017, 26, 1107 CrossRef.
- G. Qing, R. Ghazfar, S. T. Jackowski, F. Habibzadeh, M. M. Ashtiani, C.-P. Chen, M. R. Smith III and T. W. Hamann, Chem. Rev., 2020, 120, 5437–5516 CrossRef CAS PubMed.
- A. J. Martín, T. Shinagawa and J. Pérez-Ramírez, Chem, 2019, 5, 263–283 Search PubMed.
- B. Wang, T. Li, F. Gong, M. H. D. Othman and R. Xiao, Fuel Process. Technol., 2022, 235, 107380 CrossRef CAS.
- S. Y. Park, Y. J. Jang and D. H. Youn, Catalysis, 2023, 13, 639 CAS.
- L. F. Greenlee, J. N. Renner and S. L. Foster, ACS Catal., 2018, 8, 7820–7827 CrossRef CAS.
- S. Z. Andersen, V. Čolić, S. Yang, J. A. Schwalbe, A. C. Nielander, J. M. McEnaney, K. Enemark-Rasmussen, J. G. Baker, A. R. Singh, B. A. Rohr, M. J. Statt, S. J. Blair, S. Mezzavilla, J. Kibsgaard, P. C. K. Vesborg, M. Cargnello, S. F. Bent, T. F. Jaramillo, I. E. L. Stephens, J. K. Nørskov and Ib Chorkendorff, Nature, 2019, 570, 504–508 CrossRef CAS PubMed.
- A. Tsuneto, A. Kudo and T. Sakata, J. Electroanal. Chem., 1994, 367, 183–188 CrossRef CAS.
- Y. Ito, T. Nishikiori and H. Tsujimura, Faraday Discuss., 2016, 190, 307–326 RSC.
- J. M. McEnaney, A. R. Singh, J. A. Schwalbe, J. Kibsgaard, J. C. Lin, M. Cargnello, T. F. Jaramillo and J. K. Nørskov, Energy Environ. Sci., 2017, 10, 1621–1630 RSC.
- S. Li, Y. Zhou, K. Li, M. Saccoccio, R. Sažinas, S. Z. Andersen, J. B. Pedersen, X. Fu, V. Shadravan, D. Chakraborty, J. Kibsgaard, P. C. K. Vesborg, J. K. Nørskov and Ib Chorkendorff, Joule, 2022, 6, 2083–2101 CrossRef CAS PubMed.
- M. I. Ahmed, A. Assafiri, D. B. Hibbert and C. Zhao, Small, 2023, 2305616 CrossRef CAS PubMed.
- K. Imamura, M. Matsuyama and J. Kubota, ChemistrySelect, 2017, 2, 11100–11103 CrossRef CAS.
- K. Imamura and J. Kubota, Sustainable Energy Fuels, 2018, 2, 1278–1286 RSC.
- K. Imamura and J. Kubota, Sustainable Energy Fuels, 2019, 3, 1406–1417 RSC.
- T. Matsui, T. Kukino, R. Kikuchi and K. Eguchi, J. Electrochem. Soc., 2006, 153, A339–A342 CrossRef CAS.
- H. Muroyama, K. Kudo, T. Matsui, R. Kikuchi and K. Eguchi, Solid State Ionics, 2007, 178, 1512–1516 CrossRef CAS.
- H. Muroyama, T. Matsui, R. Kikuchi and K. Eguchi, J. Electrochem. Soc., 2009, 156, B1389–B1393 CrossRef CAS.
- S. Kishira, G. Qing, S. Suzu, R. Kikuchi, A. Takagaki and S. T. Oyama, Int. J. Hydrogen Energy, 2017, 42, 26843–26854 CrossRef CAS.
- A. V. Nikiforov, I. M. Petrushina, E. Christensen, R. W. Berg and N. J. Bjerrum, Renewable Energy, 2020, 145, 508–513 CrossRef CAS.
- D. K. Lim, A. B. Plymill, H. Paik, X. Qian, S. Zecevic, C. R. I. Chisholm and S. M. Haile, Joule, 2020, 4, 2338–2347 CrossRef CAS.
- Y. Yuan, S. Tada and R. Kikuchi, Sustainable Energy Fuels, 2022, 6, 458–465 RSC.
- J. Kubota, T. Okumura and R. Hayashi, Sustainable Energy Fuels, 2022, 6, 1362–1372 RSC.
- E. Christensen, R. W. Berg, R. Krüger and N. J. Bjerrum, J. Electrochem. Soc., 2023, 170, 014502 CrossRef CAS.
- K. Aika, A. Ozaki and H. Hori, J. Catal., 1972, 27, 424–431 CrossRef CAS.
- Z. Zhong and K. Aika, Chem. Commun., 1997, 1223–1224 RSC.
- L. Forni, D. Molinari, I. Rossetti and N. Pernicone, Appl. Catal., A, 1999, 185, 269–275 CrossRef CAS.
- I. Rossetti, N. Pernicone and L. Forni, Catal. Today, 2005, 102–103, 219–224 CrossRef CAS.
- M. Nishi, S.-Y. Chen, H. Tateno, T. Mochizuki, H. Takagi and T. Nanba, J. Catal., 2022, 413, 623–635 CrossRef CAS.
- S. Murata and K. Aika, J. Catal., 1992, 136, 118–125 CrossRef CAS.
- K. Aika, J. Kubota, Y. Kadowaki, Y. Niwa and Y. Izumi, Appl. Surf. Sci., 1997, 121, 488–491 CrossRef.
- K. Aika, Catal. Today, 2017, 286, 14–20 CrossRef CAS.
- K. Sato and K. Nagaoka, Chem. Lett., 2021, 50, 687–696 CrossRef CAS.
- S. J. Guo, X. L. Pan, H. L. Gao, Z. Q. Yang, J. J. Zhao and X. H. Bao, Chem.–Eur. J., 2010, 16, 5379–5384 CrossRef CAS PubMed.
- Ube Material Industries Data Sheet, https://www.ubematerial.com/upload/1678428047.pdf.
- M. J. Lázaro, L. Calvillo, V. Celorrio, J. I. Pardo, S. Perathoner and R. Moliner, Carbon Black: Production, Properties and Uses, ed. I. J. Sanders and T. L. Peeten, Nova Science Publishers, Inc., New York, 2011, ch. 2 Search PubMed.
- P. Yin, S. Hu, K. Qian, Z. Wei, L.-L. Zhang, Y. Lin, W. Huang, H. Xiong, W.-X. Li and H.-W. Liang, Nat. Commun., 2021, 12, 4865 CrossRef CAS PubMed.
- C. M. Whitea, R. Banks, I. Hamertonc and J. F. Watts, Prog. Org. Coat., 2016, 90, 44–53 CrossRef.
- National Aeronautics and Space Administration (NASA) and Glenn Research Center, Chemical Equilibrium Applications (CEA) (LEW-17687-1), 2023, https://www1.grc.nasa.gov/researchand-engineering/ceaweb/ Search PubMed.
- B. J. McBride and S. Gordon, Computer Program for Calculation of Complex Chemical Equilibrium Compositions and Applications II. User's Manual and Program Description, NASA Reference Publication NASA-RP-1311, NASA, USA, 1996 Search PubMed.
- M. Kitano, Y. Inoue, H. Ishikawa, K. Yamagata, T. Nakao, T. Tada, S. Matsuishi, T. Yokoyama, M. Hara and H. Hosono, Chem. Sci., 2016, 7, 4036–4043 RSC.
- T. Matsui, T. Kukino, R. Kikuchi and K. Eguchi, Electrochem. Solid-State Lett., 2005, 8, A256–A258 CrossRef CAS.
- S. Yoshimi, T. Matsui, R. Kikuchi and K. Eguchi, J. Power Sources, 2008, 179, 497–503 CrossRef CAS.
- K. Sato, S. Miyahara, K. Tsujimaru, Y. Wada, T. Toriyama, T. Yamamoto, S. Matsumura, K. Inazu, H. Mohri, T. Iwasa, T. Taketsugu and K. Nagaoka, ACS Catal., 2021, 11, 13050–13061 CrossRef CAS.
- M. Hattori, N. Okuyama, H. Kurosawa and M. Hara, J. Am. Chem. Soc., 2023, 145, 7888–7897 CrossRef CAS PubMed.
- M. Hattori, T. Mori, T. Arai, Y. Inoue, M. Sasase, T. Tada, M. Kitano, T. Yokoyama, M. Hara and H. Hosono, ACS Catal., 2018, 8, 10977–10984 CrossRef CAS.
- C. A. Fernandez and M. C. Hatzell, J. Electrochem. Soc., 2020, 167, 143504 CrossRef CAS.
- L. Ye, R. Nayak-Luke, R. Bañares-Alcántara and E. Tsang, Chem, 2017, 3, 709–714 Search PubMed.
- E. Kikuchi, Catal. Today, 1995, 25, 333–337 CrossRef CAS.
- D. A. P. Tanaka, M. A. L. Tanco, S. Niwa, Y. Wakui, F. Mizukami, T. Namba and T. M. Suzuki, J. Membr. Sci., 2005, 247, 21–27 CrossRef.
- Y. Zhang, M. Komaki and C. Nishimura, J. Membr. Sci., 2005, 246, 173–180 CrossRef CAS.
- Y. Zhang, T. Ozaki, M. Komaki and C. Nishimura, J. Alloys Compd., 2003, 356–357, 553–556 CrossRef CAS.
- C. Nishimura, M. Komaki, S. Hwang and M. Amano, J. Alloys Compd., 2002, 330–332, 902–906 CrossRef CAS.
Footnote |
| † Electronic supplementary information (ESI) available. See DOI: https://doi.org/10.1039/d3se01527k |
| This journal is © The Royal Society of Chemistry 2024 |

