 Open Access Article
Dynamic compaction of cohesive granular materials: scaling behavior and bonding structures†
Max
Sonzogni
 ab,
Jean-Mathieu
Vanson
 a,
Katerina
Ioannidou
 b,
Yvan
Reynier
c,
Sébastien
Martinet
 c and
Farhang
Radjai
 *b
*b
aCEA, DES, IRESNE, DEC, Cadarache, F-13108 Saint-Paul-lez-Durance, France
bLMGC, CNRS, University of Montpellier, 34090 Montpellier, France. E-mail: franck.radjai@umontpellier.fr
cUniversité Grenoble Alpes, CEA, Liten, DEHT, 38000 Grenoble, France
First published on 28th March 2024
Abstract
The compaction of cohesive granular materials is a common operation in powder-based manufacture of many products. However, the influence of particle-scale parameters such as bond strength on the packing structure and the general scaling of the compaction process are still poorly understood. We use particle dynamics simulations to analyze jammed configurations obtained by dynamic compaction of sticky particles under a fixed compressive pressure for a broad range of system parameter values. We show that relative porosity, representing the relative importance of porosity with respect to its minimum and maximum values, is a unique function of a modified cohesion number that combines adhesion force, confining pressure, and particle size, as well as contact stiffness, which is often assumed to be ineffective but is shown here to play an essential role in compaction. An asymmetric sigmoidal form based on two power laws provides an excellent fit to the data. The statistical properties of the bond network reveal self-balanced force structures and an exponential fall-off of the number of both tensile and compressive forces. Remarkably, the properties of the bond network depend on the cohesion number rather than the modified cohesion number, implying that similar bond network characteristics are compatible with a broad range of porosities mainly due to the effect of contact stiffness. We also discuss the origins of data points escaping the general scaling of porosity and show that they reflect either finite system size or rigid confining walls.
1 Introduction
Granular materials represent a ubiquitous form of solid matter in nature and a major component of the manufacturing process in several industries. The mobility of grains and their versatile interactions underlie the ability of granular materials to undergo diverse mechanical and chemo-physical transformations in response to external forces and environmental changes. These transformations are strongly coupled with a change of porosity or volume, which for this reason plays a key role in all granular processes.1,2 For example, the compaction and gradual consolidation of sediments deposited in lakes and oceans are at the origin of sedimentary rocks such as sandstone, limestone, and shale.3 The compaction of fine cohesive particles in response to mechanical stress or vibrations is also one of the most common operations in powder metallurgy, the ceramic industry, and the pharmaceutical industry for the production of stable agglomerates of desired composition, shape, strength, and porosity. Some examples are pharmaceutical pills,4–8 nuclear fuel pellets,9,10 detergent tablets,11,12 titanium compact tools,13–15 and Li-ion battery electrodes.16–20The physics of volume change in granular materials is complex due to the interplay of the concurrent effects of mutual particle exclusions, collisional energy dissipation, friction, bond forces, and collective dynamics involving arching and force correlations.21,22 The Reynolds dilatancy (volume change by shear), the sensitive dependence of the packing fraction on the confinement strategy, and the highly inhomogeneous distribution of local porosities as a result of shear-banding and wall boundary conditions are among well-known features that heavily bear on the practical handling of granular materials and raise fundamental issues about the microstructural origins and controllability of volume changes.23–29 Although experimental methods are often designed to meet the specific challenges and types of materials of interest in each field, such common features prompt also the basic question of whether a universal or an inherent volume-change behavior can be extracted.
This question has been so far mostly addressed in the case of cohesionless granular materials in soil mechanics.2,30 A nearly logarithmic dependence of the porosity on the confining pressure or on the number of vibration cycles has been evidenced.2,26,31,32 This scaling holds within two limits of porosity corresponding to the lowest and highest porosities that can be reached by applying an assembling procedure to a granular material. The lowest porosity represents the densest random packing state that is compatible with steric exclusions whereas the highest porosity is a property of the loosest state that is compatible with the static equilibrium and stability of the packing. Most work on cohesive granular materials concerns compaction by ballistic aggregation or under the action of a compressive pressure.23,33,34 A remarkable effect of adhesion between particles is to increase the range of accessible porosities as compared to cohesionless materials.35,36 Indeed, much higher porosities can be reached due to the stabilizing effect of tensile forces on the particles. However, in most experiments reported on powder compaction only a limited range of porosities is considered; the main concern often being the mechanical strength induced by compaction together with specific target functionalities such as specific surface or permeability rather than porosity alone.37–40
Several different compaction laws have been proposed in the case of cohesive powders including the logarithmic dependence of the porosity on the applied pressure for quasi-static compaction and the power-law dependence on the cohesion number for dynamic compaction.5,20,24 However, the particle-scale physical mechanisms deriving the compaction process are not the same for all processes. At low compressive stresses, the compaction is mainly due to diffusive-like motions, aggregation, and rearrangements of the particles whereas at high compressive stresses, the porosity increases also as a result of plastic particle shape change and breakage. Very low levels of porosity can be achieved in the latter case.18,41–43 It is also important to distinguish the primary compaction of a granular material as a consequence of the preparation method, such as filling a die, from the secondary compaction, which is applied with the intension of reducing porosity or enhancing the tensile strength of the compact.
Beyond many insights provided by compaction experiments, a systematic understanding of the microstructural mechanisms that underlie the compaction behavior of cohesive granular materials may be achieved by means of particle dynamics simulations based on the discrete element method (DEM).44–48 In this method, the classical equations of motion of rigid particles are incrementally integrated by accounting for the interactions between particles. For example, 2D simulations of the compaction of sticky particles with and without rolling resistance were carried out to analyze the influence of the assembling protocol on the resulting microstructures.23,49 In these simulations, a primary process of ballistic aggregation was first applied to obtain a stable packing with high porosity. Then, the packing was compressed by a quasistatic stepwise increase of isotropic pressure under periodic boundary conditions. The simulations reveal the fractal structure of the packing below a correlation length on the order of a few diameters (fractal blobs). During compaction, loose structures collapse as the tensile strength of contacts is overcome by the externally imposed forces. It is found that the consolidation process is governed by the reduced pressure p* defined as the ratio of the applied pressure to the internal cohesive stress. A nearly logarithmic dependence of porosity on the reduced pressure is observed as in experiments, followed by a power-law fall-off down to the porosity of a cohesionless material. A similar compaction process was simulated in 3D and similar results were obtained.50,51 There are few simulations accounting for particle shape change. A new algorithm coupling material point method (MPM) for the simulation of particle deformation with DEM for frictional contact interactions in 2D was able to simulate the compaction of a collection of soft disks down to a porosity close to zero.43 Interestingly, the logarithmic scaling of porosity in these simulations was found to hold when compaction enters a stage of particle deformation without rearrangements. Similar simulations in 3D by coupling DEM with finite elements were recently reported.42
In this paper, we employ 3D particle dynamics simulations to analyze the compaction of a collection of sticky spheres enclosed inside a box whose walls are subjected to a constant isotropic compressive pressure. The particles are assumed to be rigid and unbreakable so the compaction is merely due to particle aggregation and rearrangement. In contrast to quasi-static simulations, where the pressure is increased in a step-wise manner after an initial aggregation process, the compaction process in our simulations is a consequence of the action of the confining pressure without step-wise control and equilibration of the packing. In this sense, our simulations are fully dynamic and represent the natural process of primary compaction under load. We also apply a small kinetic agitation to the particles to randomize the initial particle positions. Hence, the compaction is a consequence of diffusion, ballistic aggregation, and collective rearrangements of the particles.
We are interested in the characteristics of the packing and its internal structure as a function of adhesion force, compressive pressure, particle size, and contact stiffness. Recent simulations of sheared cohesive granular materials evidenced an unexpected influence of contact stiffness on the location of shear bands.52,53 Previous simulations of the fluidization of cohesive powders have also revealed a significant influence of contact stiffness on the onset of fluidization, but this effect has never been studied in the compaction process.54,55 As we shall see, the combination of contact stiffness with the cohesion number, defined as the ratio of adhesive stress to the confining stress and corresponding to the inverse of reduced pressure, leads to a new dimensionless parameter that properly scales the porosity. Nevertheless, as we shall see, the bonding structure is more appropriately scaled by the cohesion number, implying that packings with a wide range of porosities can have similar bond networks.
An important goal of this work is to clarify the effects of rigid walls, which are essential elements of most applications and are expected to play a major role in cohesive granular materials. For this reason, periodic boundary conditions were avoided. The walls and their motion with a finite mass under the action of the applied pressure lead to strong inhomogeneity of the bonding structure at very low and very high pressures. Such inhomogeneities are often observed in cohesive powders and we will show that, while the average porosity is basically well scaled by system parameters, the presence of the walls leads to average porosities that escape the proposed scaling.26
In the following, we first describe the simulation method with a focus on the force laws and the characteristics of the simulated system in Section 2. In Section 3, we present a detailed parametric study of porosity as a function of system parameters. We consider the scaling of the data with a modified cohesion number, the origin of the influence of contact stiffness, the dependence of the highest porosity on system parameters, the effect of the damping parameter, the influence of wall mass and initial porosity, and the functional form of the collapsed porosity data on the modified cohesion number. In Section 4, we characterize the bonding structures in terms of connectivity and force transmission, as well as the origins of the data points escaping the general scaling proposed. Finally, in Section 5, we conclude with a summary of the main findings of this work and open issues for further investigation.
2 Methodology
2.1 Force laws
For simulations, we used an in-house code based on DEM (code called Rockable; see ref. 56). The classical velocity-Verlet time-stepping scheme of the equations of motion and contact detection procedures are used in this code.57 The total interaction force f between two particles is the sum of normal and tangential components fn and ft, respectively:| f = fnn + ft, | (1) |
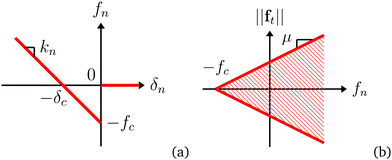
We used an elasto-adhesive contact law, in which the normal force is the sum of a linear elastic repulsion force fen = −knδn, where kn is the normal stiffness, and a constant adhesion force −fc:
 | (2) |
The adhesion force fc is assumed to represent the vdW (van der Waals) force, which is the main source of bonding for fine particles. The vdW force between two particles is given by
 | (3) |
 | (4) |
 | (5) |
In the numerical model, we assume that fc is independent of the overlap between particles. Second-order effects related to the variations of the adhesion force with the overlap or gap54,59 can be more suitably evaluated by comparison with the simple adhesion law. In the absence of external forces acting on two touching particles, the adhesion force is exactly balanced by the elastic repulsive force so that fn = 0 and the overlap at equilibrium is given by
 | (6) |
For the tangential force, we used a linear elastic law together with a Coulomb dry friction criterion:
 | (7) |
For energy dissipation, in addition to frictional sliding and bond breaking as two natural mechanisms of dissipation, we assume inelastic collisions with a restitution coefficient εn < 1. In cohesionless contacts, the value of εn is controlled by adding a viscous normal force fvn to the elastic and adhesion forces:
 | (8) |
 | (9) |
 corresponding to αn ≃ 0.25. In Section 3.5, we will discuss the effect of εn on the scaling of porosity. Finally, we set the cohesionless tangential damping to zero. This implies that the aggregation of colliding particles is controlled only by normal damping.
2.2 Sample preparation and system parameters
The initial granular sample is created by randomly placing 17![[thin space (1/6-em)]](https://www.rsc.org/images/entities/char_2009.gif) 657 monodisperse particles inside a rectangular 3D box without overlap between them. The box size is 25d × 25d × 40d. The compactness of the system can also be measured in terms of packing fraction ϕ, porosity (1 − ϕ), and void ratio e. The latter is defined as the ratio of pore volume to particle volume, so that62
657 monodisperse particles inside a rectangular 3D box without overlap between them. The box size is 25d × 25d × 40d. The compactness of the system can also be measured in terms of packing fraction ϕ, porosity (1 − ϕ), and void ratio e. The latter is defined as the ratio of pore volume to particle volume, so that62 | (10) |
Isotropic compaction was applied by imposing the same pressure p on all six walls of the box. The gravity is set to zero to keep the sample in an isotropic stress state. Under the action of p, the walls move inward, compressing the particles until a stable mechanical equilibrium is reached. The simulation is stopped when the ratio of the kinetic energy to the total elastic energy stored in the contacts is 2 × 10⁻⁷. This process is fully dynamic and depends not only on the initial void ratio e0 but also on the wall mass mw. The pressure p is kept constant, the force acting on each wall decreases as pS, where S is the surface area of the wall. The initial dynamics of compaction is governed by the acceleration pS/mw. In most simulations used for scaling the void ratio with respect to system parameters, we kept ei constant and mw was set equal to 96 times the mass m of a single particle. However, further simulations were run for several different values of ei and mw to assess their effect on the resulting void ratios (see Section 3).
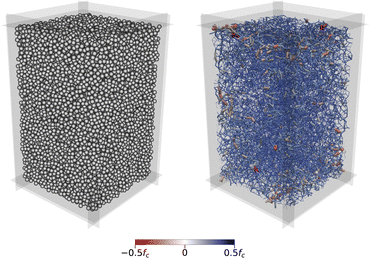
As the walls move inward, they collide with particles and we may distinguish two limit scenarios depending on the dissipation rate or adhesion force between particles. In one limit, the walls sweep and capture the particles and a densification front propagates from the walls towards the center of the simulation box. In the other limit, they push the particles away and the induced kinetic agitation leads to bulk aggregation of the particles. In both cases, the initial aggregation stage is followed by particle rearrangements under the action of compressive pressure. This second stage may fully erase the memory of the initial aggregation stage if the pressure is sufficiently high or the adhesion force is sufficiently small. Then, the initial void ratio ei will not affect the resulting bonding structure and porosity of the packing. Otherwise, the compressive pressure is not high enough to destroy the bonding structure created by aggregation and the initial void ratio will fully determine the bonding structure. Fig. 2 displays an example of a jammed configuration and its bonding structure at the end of compaction. The force chains are composed of both compressive and tensile forces.
To enhance the randomness of particle positions, we added a small initial velocity vk = 10−3 m s−1 of random orientation to all particles. This kinetic energy is rapidly dissipated in the initial stages of compaction. The initial kinetic pressure pk = ρϕvk2 is 57 times smaller than our lowest pressure p0 = 0.01 MPa. Nevertheless, for this pressure, the walls are initially pushed outwards. Hence, the void ratio e increases beyond ei and the subsequent aggregation under load leads to a slightly higher void ratio e0 ≃ 1.76 (>ei = 1.72) while the pressure is too low to induce further particle rearrangements. In the opposite case of high compressive pressure and low adhesion, we obtain the lowest void ratio emin, which coincides with that of a packing of cohesionless frictional particles. We obtain emin ≃ 0.76 (ϕ ≃ 0.57) in agreement with previous studies.65 All values of e reached during compaction vary therefore between emin and e0.
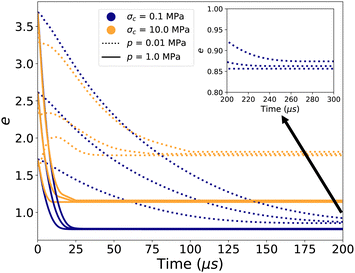
The two limits of compaction and the two stages of evolution of porosity can be clearly distinguished as shown in Fig. 3, which displays the evolution of e and the coordination number Z with time for several values of the cohesive stress σc = fc/d2 and p. At low pressure (dotted lines), e declines with time only at low cohesive stress; otherwise, it slightly increases as a result of the expansion of the simulation box before decreasing again to a constant value when all particles are aggregated. In this regime, the time needed for aggregation decreases as σc is increased. Note that Z continues to increase slowly as a result of rearrangements even when e reaches a nearly constant value. At high pressure (solid lines), the initial aggregation is fast and Z jumps from the very beginning to a finite value. e declines much faster for all values of adhesion force and we observe a slow evolution of Z even when e levels off. In all cases, the compaction stems from the combined effects of diffusion, aggregation and compression.
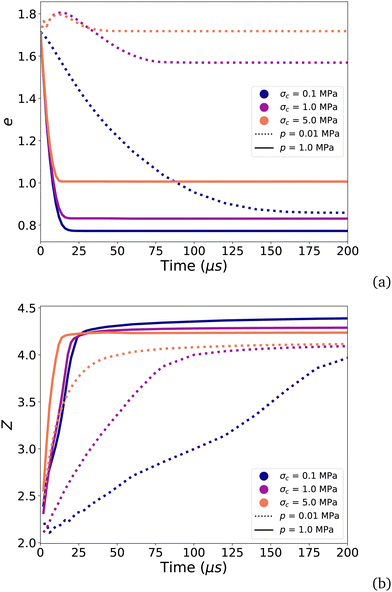 | ||
| Fig. 3 Evolution of the void ratio e (a) and coordination number Z (b) as a function of time for three values of cohesive stress σc = fc/d2 and two values of pressure p. | ||
We performed compaction simulations with different values of the cohesive stress σc = fc/d2, the applied pressure p, and the elastic stress σe = kn/d. The latter represents the order of magnitude of the elastic moduli of jammed configurations.66 To vary σc, we varied the values of both fc and d. For dimensional reasons, the particle size is irrelevant and, as we shall see, the void ratio is controlled by only two dimensionless variables that can be defined from the above three parameters. The ranges of the values of these parameters are given in Table 1. All other parameters are kept constant in most simulations. In particular, we set mw/m = 96 and μ = 0.4. The influence of wall mass mw/m is considered separately in Section 3. The initial void ratio ei is also likely to influence the aggregation phase and its influence is investigated in Section 3.
| Parameters | Values |
|---|---|
| Cohesive stress σc [MPa] | 11 values ∈ [2 × 10⁻³, 4 × 10²] |
| Pressure p [MPa] | 4 values ∈ [10−2, 1] |
| Elastic stress σe [MPa] | 5 values ∈ [5 × 10², 2 × 10⁵] |
| η | [2.5 × 10⁻³, 4 × 10⁴] |
| η* | [3.5 × 10⁻⁵, 31.6] |
We initially performed 220 simulations with all combinations of the parameters mentioned in Table 1 and constant values of all other parameters. This corresponds to the number of data points used for the scaling of the void ratio. We ran 55 more simulations to assess the effect of the damping parameter αn, 8 more simulations for the effect of wall mass mw, and 8 other simulations for the influence of the initial void ratio ei. In the following, e refers only to the void ratio of the final stable configuration obtained by isotropic compaction.
3 Scaling of porosity
In this section, we are interested in the effect of system parameters on the void ratio e of stable packings obtained by compaction with the goal of identifying dimensionless scaling parameters that control e.3.1 Parametric study
Fig. 4(a) shows e as a function of pressure p for different values of cohesive stress σc and a fixed value of σe. As expected, the void ratio declines with increasing pressure. Furthermore, since adhesion tends to hinder particle rearrangements, higher cohesive stress leads to a larger void ratio. Fig. 4(b) shows e as a function of σc for different values of p and a fixed value of σe. We identify three phases in the evolution of e in agreement with the previous studies.49,51 At low adhesion, e increases slowly with p from emin. As adhesion further increases, e increases more rapidly at a rate increasing with pressure. Finally, at even higher levels of adhesion, e tends to level off to a plateau value emax. The value of emax declines as the pressure increases. As discussed previously, the highest value of e in our simulations is e0 = 1.76, corresponding to the highest adhesion and lowest pressure p0 = 0.01 MPa. The occurrence of a plateau suggests that a minimum value of σc is required to freeze the contact network in a configuration that is stable enough to withstand rearrangements under the action of a given value of p. The increase of σc beyond this value is ineffective.Fig. 4(c) shows e as a function of σc for different values of σe = kn/d and a fixed value of p. We see here a clear dependence of the void ratio on the contact stiffness. As σe increases, the same level of compaction occurs for higher values of σc. We also observe that emax depends only slightly on σe. These effects of σe are not quite intuitive since particle stiffness is generally irrelevant to the rheology of cohesionless granular materials. This point will be discussed in more detail below in connection with the scaling of porosity.
A key question is whether the void ratio can be scaled with respect to dimensionless parameters combining the parameters σc, p, and σe. Dimensional analysis yields two independent dimensionless parameters, σc/p = fc/pd2 and p/σe = pd/kn. Equivalently, the parameters σc/σe = fc/knd and p/σe = pd/kn may be considered. Given the mass mw of the walls, we may also consider the ratio mw/m as a third dimensionless parameter of the system. Hence, it might be possible to express the void ratio as an additive or multiplicative combination of these three parameters. The product of arbitrary powers of σc/p, p/σe, and mw/m provides a simple function:
 | (11) |
By setting b = 0 and c = 0, we obtain the cohesion number,
 | (12) |
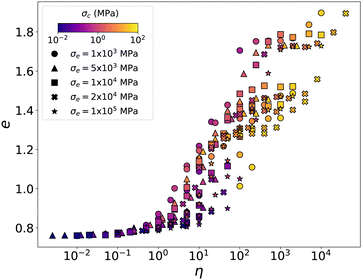 | ||
| Fig. 5 Void ratio e as a function of cohesion number η. Each data point represents an independent compaction with parameter values represented by symbols and colors. | ||
We find that the data points are much better regrouped together when b is set to a nonzero value. Considering mainly the points in the intermediate range of values of e, the best fit was obtained by setting b = 1/2 in eqn (11). The corresponding scaling parameter is
 | (13) |
We also observe that the differences between different datasets in the intermediate range reflect their differences in plateau levels emax. The values of emax can be extracted from the plots of void ratios as a function of p for different values of σc and σe. The plateau corresponds to the range of pressures p < pcrit with
 | (14) |
Fig. 7(a) displays emax as a function of pcrit. The data points are rather well collapsed and fitted to a logarithmic function:
 | (15) |
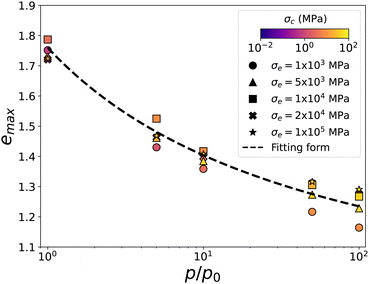 | ||
| Fig. 7 The upper bound values emax of void ratio (plateau levels) as a function of pressure p = pcrit = σc2/σe normalized by the lowest pressure p0, corresponding to void ratio e0 ≃ 1.76, for different sets of system parameters. The dashed line is the logarithmic fitting function of eqn (15). | ||
Eqn (15) predicts emax in a unique way and independently of the choice of pΔ. It is easy to show that this requirement is indeed satisfied if Δe and pΔ satisfy the following relationship:
 | (16) |
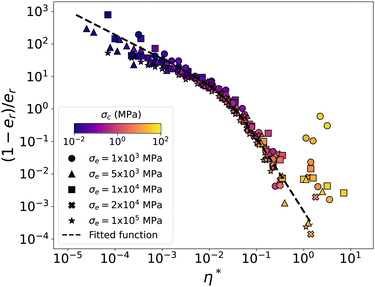
We now can rescale the data points of Fig. 13 by considering the relative void ratio er defined from emin and emax:
 | (17) |
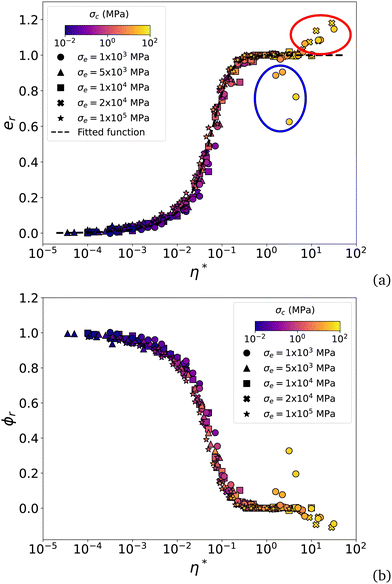 | ||
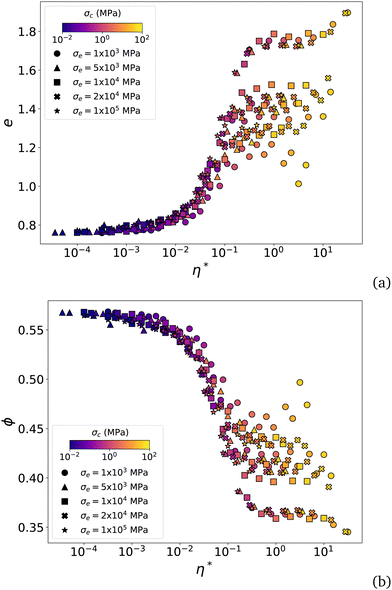
| Fig. 8 Relative void ratio er (a) and relative packing fraction ϕr (b) as a function of the modified cohesion number η* for the data obtained from all compaction simulations. The dotted line represents the fitting function given by eqn (31). The encircled symbols are the data points escaping the general scaling. | ||
This collapsed form of the porosity data and the presence of data points escaping the general trend raise several questions that will be further discussed below: (1) how to interpret the expression of the modified cohesion number η* in eqn (13)? (2) Is the intermediate range of porosities best fit to a logarithmic function as often suggested by compaction experiments and simulations? (3) What is the effect of the damping parameter αn? (4) What are the effects of the wall mass mw and initial void ratio? (5) What is the origin of deviating data points?
3.2 Modified cohesion number
The cohesion number η represents the relative importance of the cohesive stress σc acting at all contact points with respect to the pressure p in static equilibrium. However, compaction under load is a dynamic process and the porosities of the jammed configurations arise from the balance of energy rates such as in the thermodynamic description of the propagation and arrest of cracks in a solid material.68 We may attribute a surface energy of the order of G = fc2/(knd2) to each contact. During compaction, particle rearrangements occur if this energy is overcome by the work W = pd supplied by the action of p per unit surface and over a distance of the order of the particle size. Hence, the ratio G/W = fc2/(pknd3) = σc2/(pσe) = (η*)2 is expected to control the compaction level, i.e. the void ratio at which the particles get jammed in a stable configuration. The modified cohesion number η* is the square root of this ratio. Hence, η* can be considered as a measure of the relative level of inertia during compaction. For this reason, we expect that for low values of η*, where dynamic effects are less important, the void ratio is also well scaled by η, and this is what we observe in Fig. 5.The effect of the attraction force on the dynamics can be analyzed in a more straightforward way by considering the collision of a particle with a rigid wall.55 The equation of motion of the particle is given by:
 | (18) |
 , the solution of eqn (18) is given by:
δn(t) = exp−t/τ2(A![[thin space (1/6-em)]](https://www.rsc.org/images/entities/char_2009.gif) cos(t/τ1) + B cos(t/τ1) + B![[thin space (1/6-em)]](https://www.rsc.org/images/entities/char_2009.gif) sin(t/τ1)) − A sin(t/τ1)) − A | (19) |
 | (20) |
 | (21) |
 | (22) |
 | (23) |
Depending on the impact velocity v0, two different scenarios occur. If v0 is relatively low, the particle will stick to the wall and δn tends to δc after a few damped oscillations. Otherwise, the contact will open up and the particle rebounds with a lower velocity. The contact duration τc in this case satisfies the condition δn(τc) = 0, which can be shown to be equal to the solution of the following implicit equation:
e−τc/τ2![[thin space (1/6-em)]](https://www.rsc.org/images/entities/char_2009.gif) cos(τc/τ1 − γ) = cos(γ) cos(τc/τ1 − γ) = cos(γ) | (24) |
 | (25) |
 | (26) |
From the critical velocity vcrit, we can define a critical adhesion force in the case of compaction under load p:
 | (27) |
 as the typical velocity induced by the force pd2 on particles. The critical adhesion force represents the adhesion force above which the particles stick together and aggregate. Obviously, compaction is not a binary process since the particle velocities are unevenly distributed. However, fcritc provides a reference adhesion force from which we can define a dimensionless adhesion force,
 | (28) |
3.3 Effect of wall mass and initial void ratio
In all simulations analyzed for the scaling of void ratio, the mass ratio mw/m and initial void ratio e0 were fixed to a constant value. We ran more simulations by varying separately these parameters for low and high values of p and σc. Fig. 9 displays the evolution of void ratio e as a function of time for a constant initial void ratio e0, but three different values of mw/m, two very different values of σc, and two very different values of p. We see that except for a small variation (without trend) at low p and high σc, the mass ratio has no effect on the final value of the void ratio. Hence, we must set c = 0 in the scaling law (11). This absence of wall mass effects, at least in the range of the investigated range of mass ratios, means that the kinetic energy acquired by the walls during compaction is efficiently dissipated as a result of inelastic collisions and formation of cohesive bonds.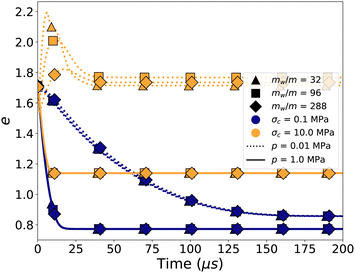 | ||
| Fig. 9 Void ratio e as a function of time for 3 different values of the ratio mw/m of wall mass to particle mass, 2 different values of cohesive stress σc, and 2 different values of pressure p. | ||
Fig. 10 displays the evolution of e as a function of time for three different values of the initial void ratio, two different values of cohesive stress σc, and two different values of pressure p. We observe a clear effect of the initial void ratio on the compaction process, but the final void ratio is nearly independent of the initial void ratio. As in the case of wall mass, the kinetic energy acquired by the walls during compaction is rapidly dissipated since e decays monotonically and tends asymptotically to its equilibrium value, which is solely controlled by p, σc, and σe.
3.4 Fitting forms
Let us turn now to the functional form of the collapsed data er(η*) in Fig. 8. The intermediate range of this plot looks like a logarithmic function. However, as can also be checked in past simulations reported in the literature, this range actually concerns only a small part of the whole range of the values of η*, which covers at least 5 orders of magnitude. A power law has also been suggested in the dense regime (er < 0.2).23,24 We found no fit in the literature for the loose regime (er > 0.8). In 2D simulations of compaction with samples prepared by aggregation, the upper plateau is not reached as an asymptotic state and the crossover between the intermediate and loose regimes is discontinuous since it reflects a transition from stable aggregates to collapsed aggregates. However, previous 3D simulations based on the same preparation process do show a gradual transition to the loose state as in our simulations of Fig. 8.50,51The trend in this intermediate-to-loose crossover observed in Fig. 8 is similar to that of the dense-to-intermediate crossover, but there is an obvious asymmetry between them. In particular, the evolution of er in the dense regime is slow and takes place over several decades whereas in the loose regime, it occurs for less than one decade. To make clearly appear this difference, let us consider the ratio
 | (29) |
 | (30) |
 and s = sm ≃ 1.55 is the crossover point. This representation suggests that the intermediate logarithmic regime is practically absent and simply reflects the transition between the two power-law regimes. Interestingly, a similar power-law behavior with α = 3/4 for the dense regime was found by contact dynamics simulations of dynamic compaction in 2D.24 However, the effect of contact stiffness was not included in the scaling proposed and all the data were described as a function of η.
From eqn (30), we get the following fitting form for er(η*):
 | (31) |
3.5 Effect of damping parameter
All the void ratio data discussed so far were obtained from simulations with a fixed value of dissipation parameter αn = 0.25. However, eqn (28) naturally suggests αnη* as a scaling parameter rather than η*. The issue is therefore whether αn can be included in a simple way in the scaling of void ratios. To assess the effect of αn, we ran a series of simulations with different values of αn while also varying σc for p = 0.1 MPa and σe = 104 MPa. The results are shown in Fig. 12(a). As expected, for each value of η*, e increases with αn because of the stabilizing effect of energy dissipation or, equivalently, because of the decrease of the effective restitution coefficient or increase of the critical velocity, as suggested by eqn (26). This effect is most pronounced for intermediate values of η*. In transition to the plateau, the effect of αn declines since the stabilizing effect of fc prevails in this regime. For the same reason, emax is independent of αn. | ||
| Fig. 12 Evolution of void ratio e as a function of η* (a), αnη* (b), and αn1/4η* (c), for different values of damping parameter αn. | ||
If, as suggested by eqn (28), we plot the same data as a function of αnη*, we obtain Fig. 12(b). We see that the data collapse indeed in the dense regime, but the discrepancy increases everywhere else. The best collapse is obtained by using the scaling parameter αn1/4η* as shown in Fig. 12(c). Data collapse is nevertheless mediocre in the dense regime. Note that a dependence on αn1/4 was observed in shear localization.52,53 The same authors found a scaling of cohesion with αn0.7 in a different problem.53 It seems therefore that the void ratio depends in a nonlinear and unmonotonic way on the level of adhesion. Further simulations are necessary to arrive at a scaling that includes the dissipation parameter. This can be done by investigating the influence of αn on the general shape of er(η*), i.e. by quantifying the dependence of the parameters of the functional form of eqn (31) on αn.
4 Bonding structure
Particle configuration, contact network and force transmission are key features that evolve during the compaction process. Besides porosity, these features underlie mechanical properties and functionalities for which compaction is used in industry. For example, while the void ratio is essential for the transport of fluid in the pore space, the contact network underlies the electronic and heat conductivity across a packing. The pore and solid phases are, however, related together through two constraints: (1) geometrical duality of the particle and pore phases, and (2) force balance at the level of each particle. A fundamental issue is therefore whether the void ratio and variables pertaining to the bonding structure are correlated across the parametric space, i.e. in the whole range of values of compressive pressure, contact adhesion, and contact stiffness. Hence, we consider in this section, several aspects of the bonding structure and investigate their scaling with system parameters.4.1 Force networks
Fig. 13 displays three examples of the bond network with increasing value of the modified cohesion number η*. At low cohesion (Fig. 13(a)), nearly all force chains are in the compressive state. Although it is difficult to fully appreciate the force chains in a 3D perspective, the strongest forces are clearly located in the vicinity of the walls, featured by several arches along the walls or spanning the space between adjacent walls in the corners of the box. Such wall effects are common in cohesionless packings and their presence together with a small gradient of forces from the walls towards the center of the box indicate that mesoscopic force inhomogeneities occur in our system on top of the well-known particle scale force inhomogeneity.60,69–73 At higher cohesion (Fig. 13(b)), we observe both compressive and tensile force chains. The void ratio is higher but a higher density of forces occurs at the corners of the box. We also see that the number of particle–wall contacts is reduced, implying that the transmission of the applied pressure from the walls to the sample is concentrated over a few contacts. At an even higher level of cohesion (Fig. 13(c)), the network is even looser and the tensile and compressive forces are almost equally present everywhere.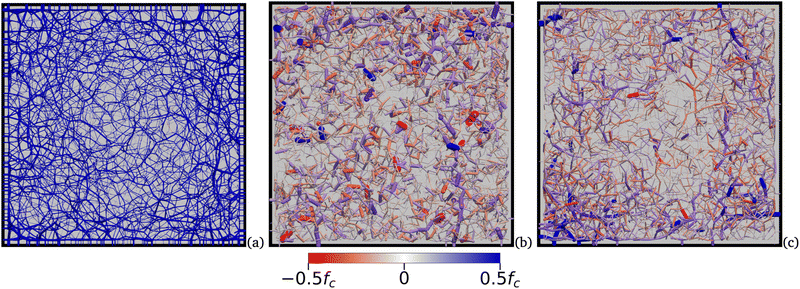 | ||
| Fig. 13 Force network in a thin slice inside the packing for (a) η* = 10−3, (b) η* = 0.05, and (c) η* = 0.5. Line thickness is proportional to force magnitude. | ||
Fig. 14 displays the bond networks for one data point of each of the two groups of data escaping the general scaling in Fig. 8. The first group, encircled in red in Fig. 8, occurs at lowest pressures (p ≤ 5.10−2 MPa) and the data points are above the plateau er = 1. Fig. 14(a) is an example of the corresponding bonding network. As a result of very low pressure and high adhesion, the particles fully aggregate before the wall moves and comes in contact with only a few particles. The higher porosity of these samples is in agreement with 3D quasi-static compaction simulations.51
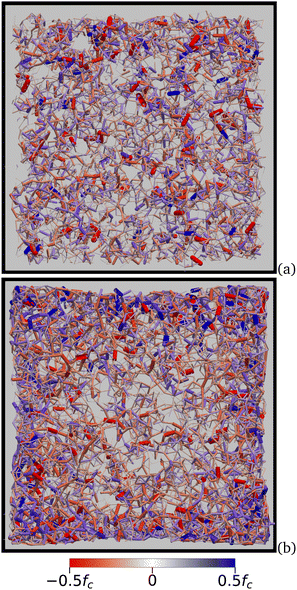 | ||
| Fig. 14 Force network in a thin slice inside the packing for (a) η* = 15, er > 1 and (b) η* = 3, er < 1. Line thickness is proportional to the force magnitude. | ||
The second group, encircled in blue in Fig. 8, occurs at very high pressures (p ≥ 0.5 MPa) and high cohesive stress. Fig. 14(b) shows an example of the corresponding bonding network. High pressure leads to the fast creation of stable and strong force chains along the walls followed by their buckling. As a result, most particles in the bulk are screened and receive a small amount of external pressure. The high density in a thick layer close to the walls leads to a lower global void ratio. Such inhomogeneous structures at low and high pressure in highly cohesive granular materials show the effect of both wall dynamics and finite sample size on the compaction process. In particular, high pressures lead to fast motion of the walls and dynamic jamming, tending to enhance force correlations and giving rise to stable arches across the system.
To better characterize the bonding structure for the ‘regular’ and ‘deviating’ data points, we calculated the void ratio as a function of the distance r from the center of the samples. To do so, we calculated the void ratios inside a cubic probe of side 2r and centered on the center of the sample. Fig. 15 shows e as a function of r/L, where L is the sample size. The five curves correspond to the five bond networks of Fig. 13 and 14. In all cases, we observe a higher void ratio in the center of the sample and in the vicinity of the walls. The observed oscillations in the center reflect the local ordering of particles or cohesive aggregates due to steric exclusions. Between these two limits, we observe either a plateau (for η* = 0.5) or a small gradient for the regular data points (for η* = 10−3 and η* = 0.05). For the deviating points, we observe either a strong gradient (case of η* = 15 with er > 1) or a very high void ratio at the wall (case of η* = 3 with er < 1). These pathologies reflect therefore a strong finite size effect in the former case and a strong wall effect in the latter case. In this latter case, we also see that the oscillations of e extend from the center to mid-distance from the wall, indicating the presence of aggregates, as can also be observed in Fig. 14(b). The finite-size effects are naturally expected in the case of highly cohesive granular materials due to the clustering of cohesive particles. We find it interesting that the general scaling of er with η* occurs despite such effects and porosity gradients inside the samples.
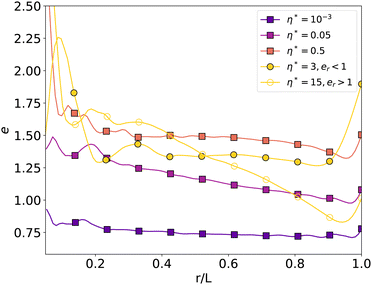 | ||
| Fig. 15 Void ratio e in a cubic probe with side 2r and the same center as the sample as a function of r/L, where L is the length of the sample, for η* = 10−3 (corresponding to Fig. 13(a)), η* = 0.05 (corresponding to Fig. 13(b)), η* = 0.5 (corresponding to Fig. 13(c)), η* = 15 (corresponding to Fig. 14(a)), and η* = 3 (corresponding to Fig. 14(b)). | ||
4.2 Coordination numbers
The coordination number Z is the lowest-order scalar variable characterizing the contact network. We find that in all packings and independently of system parameters, Z varies between 4 and 4.2. Since the coordination number of an isostatic frictional packing of spheres is 4, this means that bonding structures are only weakly hyperstatic even in the dense regime and the force networks are almost uniquely defined. A similar result was found by compaction simulations with 3D periodic boundary conditions.51 The contact network is therefore fragile in the sense that, although it is globally stable, it can easily break or undergo large deformations under the action of shear stresses. The fact that Z remains low throughout the parametric space indicates that low coordination is a consequence of isotropic compaction, which is common to all our simulations. Higher levels of coordination can be reached by shearing or for soft deformable particles.Since Z does not discriminate the generated packings, we consider tensile and compressive contacts whose numbers vary with the level of cohesion as observed in Fig. 13. Let Z+ and Z− be the compressive and tensile coordination numbers, i.e. the average numbers of compressive contacts (fn > 0) and tensile contacts (fn < 0), respectively. We have Z = Z+ + Z−. Fig. 16 shows both Z+ and Z− as a function of η* and η with all simulation compaction data points. We see that Z− increases steadily with η and levels off around 2 at large values of η while at the same time Z+ declines and tends to the same value of 2. Hence, in the asymptotic state, each particle has 2 tensile contacts and 2 compressive contacts on average. This symmetry between the tensile and compressive networks in the asymptotic state reflects the fact that at large values of η the force network (with its both tensile and compressive contacts) is mainly induced by adhesion forces which are well above the forces induced by the confining pressure.74
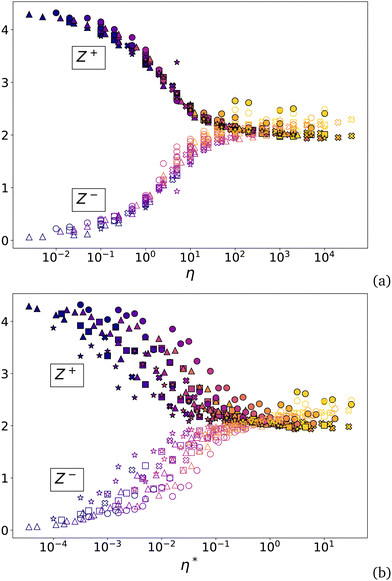 | ||
| Fig. 16 Evolution of the coordination numbers Z− (empty symbols) and Z+ (plain symbols) as a function of η and η*. The symbols and colors are the same as in Fig. 8. | ||
Remarkably, in contrast to the void ratio, the coordination number data collapse much better as a function of η rather than η*! This means that, since  the same values of Z+ and Z− for a fixed value of η are compatible with a range of values of void ratio obtained by simply changing σe. This is quite important for the range of intermediate values of er where the latter changes significantly with η*. Fig. 17 shows er as a function of the proportion Z−/Z of tensile contacts. We see that for each value of Z−/Z (depending on η), er varies indeed in a broad range of values with the widest variation occurring just before the plateau. We also see that the largest (resp. lowest) values of er correspond to the lowest (resp. largest) values of σe. Fig. 18 shows force networks for η = 10 but with different values of σe. We clearly see that the force gradient increases from the center towards the walls with increasing relative void ratio er although the distributions of tensile and compressive contacts are similar in the three networks.
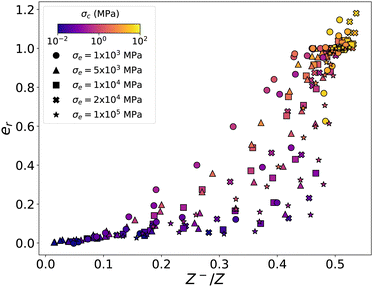 | ||
| Fig. 17 Relative void ratio er as a function of the proportion Z−/Z of tensile contacts for all simulations. | ||
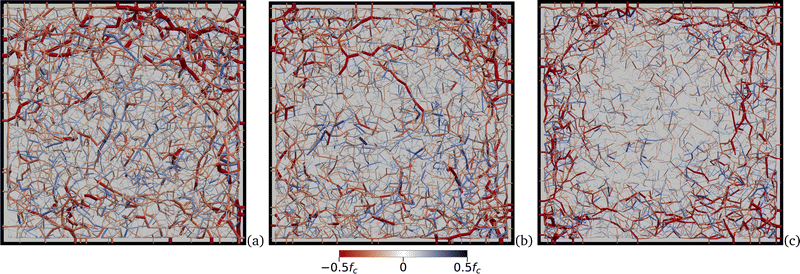 | ||
| Fig. 18 Force networks in a thin slice inside the packing for η = 10 and er = 0.1 (a), er = 0.5 (b), and er = 0.9 (c). | ||
The scaling of compressive and tensile coordination numbers with η rather than η*, although unexpected, is actually a consequence of static equilibrium. This equilibrium is ensured at the level of each particle by the balance of forces induced by the applied pressure, which is of the order of pd2, and the adhesion forces fc acting at all contacts. The connectivity of the contact network characterized by Z being nearly the same for all compacted configurations, it is plausible that the force network characterized by the proportion Z−/Z of tensile contacts depends on the relative importance of adhesion force and applied pressure via the ratio η = fc/pd2.
4.3 Force distributions
The bonding structure can be analyzed in more detail by considering the probability density function (PDF) of normal forces fn. As fc is the reference internal force which varies in our parametric study, we focus on the distribution of force ratios fn/fc. Since we have fn = fen − fc at every contact point, the force ratio is fn/fc = fen/fc − 1 so that the PDF of force ratios actually represents the statistics of the mobilization of repulsive forces in the bond network as compared to the adhesion force. Fig. 19 shows three examples of the PDFs of normalized forces fn/fc. For the three values of η*, we observe a double-exponential distribution: | (32) |
We computed the values of β− and β+ in the ranges [−0.5fc, 0] and [0, 1.5fc] for which we generally have sufficient statistics. The precision is low in the range of tensile forces at low values of η due to a much lower number of tensile forces. Fig. 20 shows β− and β+ as a function of both η and η*. Consistently with the behavior of Z− and Z+ and within our statistical precision, we find that β− and β+ are much better scaled by η than η*. Hence, as in the case of Z−/Z, the force distributions are increasingly uncoupled from the relative void ratio as η increases. Interestingly, both β− and β+ first decrease and then increase again at larger values of η. The initial decrease is more pronounced for β+. The minimum value occurs at η ≃ 0.2 (e ≃ 0.8) and, according to Fig. 6, it corresponds to the transition from the dense regime to the intermediate regime. The two exponents tend to have the same value at large η.
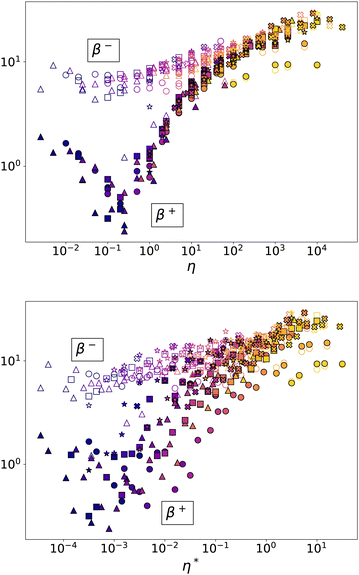 | ||
| Fig. 20 Evolution of the exponents β− (empty symbols) and β+ (plain symbols) of the force PDFs for the tensile and compressive force domains. The symbols and colors are the same as in Fig. 8. | ||
To understand the unmonotonic evolution of the exponents with η, it must be reminded that the evolution of the force PDF reflects the effect of adhesion on the distribution of elastic forces fen = −knδn. In the dense regime, the effect of increasing adhesion is to reinforce strong force chains via weak tensile forces that play in this way the same role with respect to the strong force network as the weak compressive forces.75 As a result, the number of strong compressive forces and the inhomogeneity of the force network increase, the force PDFs become wider, and β+ declines. Beyond η ≃ 0.2, the tensile network grows and self-sustained groups of particles mixing compressive and tensile forces appear as observed in Fig. 13(b). The amplitude of strong compressive forces is increasingly dictated by the adhesion force rather than external pressure. As a result, the scale of the compressive force is increasingly imposed by σc rather than p and the value of β+ tends to that of β−. In this sense, the force network becomes more symmetric around fn = 0 with equal numbers of tensile and compressive forces.
The observed behavior of the exponents indicates a fundamental asymmetry between the effects of confining pressure and adhesive forces on the equilibrium of granular packing. This point is not trivial when a variable such as η is used as a control parameter, suggesting that the pressure p and compressive stress σc play identical roles with respect to the equilibrium of the force network. In fact, in the limit where the confining pressure p prevails (η ≪ 1), the PDF  of normalized normal forces is independent of p (i.e. β′ does not depend on p). When η ≫ 1 and the effect of adhesion prevails, fc is the relevant force scale and P(fn/fc) is independent of fc (i.e. β+ does not depend on fc). Statistically, the crossover from the regime ruled by p to the regime ruled by fc occurs when the probabilities for the two alternative normalizations are equal: P1(fn/pd2)δfn/pd2 = P(fn/fc)δfn/fc. Given the exponential form of the PDFs, this condition translates into
  , which implies
  . The value of β′ can be evaluated at η = 1, where fc = pd2 and therefore β+ = β′. Fig. 20 shows that at this point we have β+ ≃ 1, implying β′ ≃ 1. Since β′ does not depend much on p in this limit, we may assume that its value remains equal to 1 for lower values of η. Hence, at the crossover between the two regimes, we have β+ = ηβ′ ≃ η. Fig. 20(a) shows that this condition holds with a good approximation at β+ ≃ 0.2, which corresponds to the minimum of the curve.
5 Conclusions
Particle dynamics simulations were performed to investigate the scaling of porosity and structural characteristics with system parameters in cohesive granular materials assembled under the action of an isotropic compressive pressure. Spherical particles governed by linear elasto-adhesive and frictional interactions were used in the simulations for broad ranges of values of cohesive stress, contact stiffness, compressive pressure, and particle size. In contrast to previously reported simulations, the compaction process in our simulations is fully dynamic due to the action of the applied compressive pressure. Because of the initially non-overlapping configuration of particles, this process involves ballistic aggregation, dynamic jamming, and particle rearrangements before a stable packing in static equilibrium is reached. In this work, the adhesion force was assumed to represent the vdW interactions. However, the results hold also for other types of cohesive materials provided that the attraction force is short-ranged and localized at the contact point and the cohesive stress σc can be clearly defined from the nature of the interaction. For example, liquid-bonded contacts in the limit of low liquid volume fraction are characterized by a short debonding distance (nearly equal to the cubic root of liquid volume) and a maximum capillary force proportional to the liquid–gas surface energy at the contact point.76,77A key finding is the scaling of the relative porosity (or relative void ratio) with a new dimensionless parameter η* which combines pressure p, cohesive stress σc, and characteristic elastic stress σe. It was argued that this modified cohesion number arises naturally by considering that, as in fracture mechanics, particle rearrangements depend on the work supplied by the applied pressure as compared to the elastic energy stored in the contact network. This scaling was also related to the critical velocity of aggregation between colliding adhesive particles. Particle stiffness appears therefore as a control parameter of dynamic compaction as it was previously found for fluidization and shear banding in cohesive granular materials. We also found that the initial void ratio and wall mass have no influence on the void ratio obtained by compaction under constant pressure.
The scaling of void ratio e with system parameters is complex essentially due to the fact that there are three independent variables (p, σe, and σc) and the evolution of e is nonlinear with two plateaus involving the parameters emin, which is determined mainly by the geometry of the particles, and emax, which is itself a function of system parameters. It is therefore useful to formulate the dependence of e on system parameters as a “recipe”. The recipe is actually simple if we concentrate on only one variable. Let us consider, for example, the evolution of e with p for fixed values of σc and σe. As p increases from zero,  declines, but e remains constant and equal to emax until p = pcrit = σc2/σe is reached. For values of p exceeding pcrit, the void ratio e declines with increasing p (decreasing η*). When we plot er, defined from the value of emax obtained by this procedure, as a function of η*, we obtain a normalized plot as the one shown in Fig. 8(a) but restricted to the given values of σc and σe. Our main finding is that all the curves obtained by this procedure for all other values of σc and σe collapse on a master curve of sigmoidal shape. In each dataset, the values of σc, σe and emax are different. Hence, we must also clarify how emax depends on σc and σe.
For any given values of the two latter parameters, if a sufficiently low pressure is applied (below pcrit), we have e = emax. This dependence is expressed through the combination pcrit = σc2/σe. When emax is plotted as a function of pcrit, the data points nearly collapse as in Fig. 7. This is a decreasing function that has a nearly logarithmic form. However, we are not allowed to use a dimensional quantity such as pcrit inside the logarithm function. A possible solution for normalizing pcrit consists in using an arbitrary pressure pΔ as the reference point provided the fitting form is independent of its value. Eqn (15) represents emax as a function of pcrit/pΔ with pΔ = p0, which is the lowest value that we had used in the simulations. For this value, we have Δe ≃ 1. However, we showed that eqn (15) is invariant with respect to the choice of pΔ, each value of the latter corresponding to a unique value of Δe. Taking p0 as a reference point, we have C ≃ 0.24 and Δe = 1/[1 + C![[thin space (1/6-em)]](https://www.rsc.org/images/entities/char_2009.gif) ln(pΔ/p0)]. Any choice of the values of Δe and pΔ in eqn (15) satisfying this relation leads to the same value of emax for given values of σc and σe. In other words, the predicted value of emax by eqn (15) does not depend on the choice of p0 as the reference pressure.
ln(pΔ/p0)]. Any choice of the values of Δe and pΔ in eqn (15) satisfying this relation leads to the same value of emax for given values of σc and σe. In other words, the predicted value of emax by eqn (15) does not depend on the choice of p0 as the reference pressure.
The functional dependence of void ratio on η* was shown to be best fit by a general form involving two power laws for (1) the increase of void ratio from the lowest porosity in the limit ruled by pressure and (2) the asymptotic increase of void ratio towards its highest value in the limit ruled by adhesion forces. Furthermore, the asymptotic void ratio is a function of critical pressure depending on cohesive stress and elastic stress. We showed that the effect of the damping parameter on porosity depends on the level of adhesion and can not be included in a simple way in the general scaling proposed. We also discussed the origins of a few data points escaping the proposed scaling and showed that they stem either from a slow motion of the walls and full ballistic aggregation of the particles due to very low pressure applied or from a fast inward motion of the walls due to very high pressure applied, causing dynamic jamming and high porosity gradients inside the packing. In both cases, the presence of the walls and the finite size of the sample as compared with force correlations play a crucial role. An important finding of this work is that, despite such effects, the overall void ratio follows a well-defined scaling with η* within the limits that were discussed, clarified, and illustrated.
The bonding structure was analyzed in terms of contact network connectivity, tensile/compressive networks, and force PDFs. These features were found to scale with the cohesion number η = σc/p rather than η*. This implies the remarkable property that a given force distribution is compatible with a wide range of values of void ratio. This variability reflects the effect of the characteristic elastic stress σe on the assembling process and increases with η. For all values of η, the coordination number Z is only slightly above 4, which is the isostatic coordination number for frictional spheres, showing therefore the weak hyperstaticity of the packings generated by isotropic compaction. The PDFs of both tensile and compressive forces are generically exponential with exponents that vary unmonotonically with η, revealing a transition from the dense regime, characterized by the stabilizing effect of adhesion, to the loose regime, mainly controlled by adhesion forces. As η increases, the bond network tends to have a symmetrical structure with similar PDFs and equal numbers of tensile and compressive forces.
Our results prove that granular materials can be assembled by dynamic compaction in packings of high void ratio with only normal adhesion forces and no need for rolling resistance. Previous simulations have shown that high levels of void ratio can not be reached by quasi-static incremental compression without rolling friction or without allowing the particles to aggregate freely before the application of the compaction pressure.23 Our simulations may be considered as primary compaction to build a granular sample since the initial state is a granular gas. It will therefore be interesting to perform dynamic compaction simulations starting from a different state (e.g. the loosest state of our simulations or a packing obtained by ballistic aggregation) and investigate the relevance of the modified cohesion number to the scaling of porosity.
It is also important to consider the effect of Hertzian contacts for which the characteristic elastic stress explicitly depends on the pressure. It can be conjectured that the scaling proposed in this paper based on the elastic stress as an independent parameter will hold true by replacing the elastic stress with bulk modulus, which explicitly depends on the confining pressure in the case of a Hertz contact.78 This will then modify the expression of η*. Another significant parameter is the friction coefficient μ between particles. Its value was fixed to 0.4 throughout our parametric investigation. However, the effect of μ on the proposed scaling is nontrivial. In particular, it is interesting to see whether μ controls only the value of emax without modifying the scaling or whether it has a more extensive influence on the compaction process. The aggregation of particles and force correlations inside the packings and their link with finite size effects and deviating data points were discussed in this paper, but more simulations are needed with increasing number of particles or simulation cell size to quantify such effects. Finally, we investigated the shear response of the packings obtained in this work with a focus on the evolution of the void ratio. The results will be published in an upcoming paper.
Author contributions
Max Sonzogni: data curation, formal analysis, investigation, methodology, software, visualization, writing – original draft. Jean-Mathieu Vanson: methodology, software, investigation, data curation, resources, writing – review and editing, supervision. Katerina Ioannidou: data curation, investigation, resources, supervision, writing – review and editing. Yvan Reynier: data curation, investigation, validation, writing – review and editing. Sébastien Martinet: data curation, investigation, validation, writing – review and editing. Farhang Radjai: conceptualization, data curation, formal analysis, investigation, methodology, resources, supervision, writing – original draft.Conflicts of interest
The authors declare that they have no known competing financial interests or personal relationships that could have appeared to influence the work reported in this paper.Acknowledgements
The authors thank the CEA FOCUS program for funding and support and Lhassan Amarsid and Vincent Richefeu for fruitful discussions and help with the DEM code Rockable.Notes and references
- B. Andreotti, Y. Forterre and O. Pouliquen, Granular Media: Between Fluid and Solid, Cambridge University Press, 2013 Search PubMed.
- J. Mitchell and K. Soga, Fundamentals of Soil Behavior, Wiley, 3rd edn, 2005, p. 592 Search PubMed.
- J. C. Jaeger, N. G. W. Cook and R. Zimmerman, Fundamentals of Rock Mechanics, Wiley, 2007 Search PubMed.
- A. Adolfsson and C. Nyström, Int. J. Pharm., 1996, 132, 95–106 CrossRef CAS.
- M. Kadiri, A. Michrafy and J. Dodds, Powder Technol., 2005, 157, 176–182 CrossRef CAS.
- C.-Y. Wu, B. Hancock, A. Mills, A. Bentham, S. Best and J. Elliott, Powder Technol., 2008, 181, 121–129 CrossRef CAS.
- A. Mazor, L. Orefice, A. Michrafy, A. de Ryck and J. G. Khinast, Powder Technol., 2018, 337, 3–16 CrossRef CAS.
- G. Frenning, Powder Technol., 2007, 172, 103–112 CrossRef CAS.
- B. Saint-Cyr, J.-Y. Delenne, C. Voivret, F. Radjai and P. Sornay, Phys. Rev. E: Stat., Nonlinear, Soft Matter Phys., 2011, 84, 041302 CrossRef CAS PubMed.
- B. Saint-Cyr, F. Radjai, J.-Y. Delenne and P. Sornay, Phys. Rev. E: Stat., Nonlinear, Soft Matter Phys., 2013, 87, 052207 CrossRef PubMed.
- P. N. Davies, H. E. Worthington, F. Podczeck and J. M. Newton, Eur. J. Pharm. Biopharm., 2007, 67, 268–276 CrossRef CAS PubMed.
- O. Keles, N. P. Barcenas, D. H. Sprys and K. J. Bowman, AAPS PharmSciTech, 2015, 16, 1455–1464 CrossRef CAS PubMed.
- I.-H. Oh, N. Nomura, N. Masahashi and S. Hanada, Scr. Mater., 2003, 49, 1197–1202 CrossRef CAS.
- H. Shen, H. Li and L. Brinson, Mech. Mater., 2008, 40, 708–720 CrossRef.
- L. Reig, C. Tojal, D. J. Busquets and V. Amigó, Materials, 2013, 6, 4868–4878 CrossRef PubMed.
- N. Nitta, F. Wu, J. T. Lee and G. Yushin, Mater. Today, 2015, 18, 252–264 CrossRef CAS.
- H. Kang, C. Lim, T. Li, Y. Fu, B. Yan, N. Houston, V. De Andrade, F. De Carlo and L. Zhu, Electrochim. Acta, 2017, 232, 431–438 CrossRef CAS.
- H. Liu, X. Cheng, Y. Chong, H. Yuan, J.-Q. Huang and Q. Zhang, Particuology, 2021, 57, 56–71 CrossRef CAS.
- Y. Liu, R. Zhang, J. Wang and Y. Wang, iScience, 2021, 24, 102332 CrossRef CAS PubMed.
- E. N. Primo, M. Chouchane, M. Touzin, P. Vazquez and A. A. Franco, J. Power Sources, 2021, 488, 229361 CrossRef CAS.
- H. M. Jaeger, S. R. Nagel and R. P. Behringer, Phys. Today, 1996, 49, 32–38 CrossRef.
- P. G. Rognon, J.-N. Roux, D. Wolf, M. Naaïm and F. Chevoir, Europhys. Lett., 2006, 74, 644–650 CrossRef CAS.
- F. A. Gilabert, J.-N. Roux and A. Castellanos, Phys. Rev. E: Stat., Nonlinear, Soft Matter Phys., 2007, 75, 011303 CrossRef CAS PubMed.
- D. E. Wolf, T. Unger, D. Kadau and L. Brendel, Powders and Grains 2005, 2005, pp. 525–533 Search PubMed.
- V. Busignies, B. Leclerc, P. Porion, P. Evesque, G. Couarraze and P. Tchoreloff, Eur. J. Pharm. Biopharm., 2006, 64, 38–50 CrossRef CAS PubMed.
- A. Djemai and I. C. Sinka, Int. J. Pharm., 2006, 319, 55–62 CrossRef CAS PubMed.
- E. Andò, S. A. Hall, G. Viggiani, J. Desrues and P. Bésuelle, Géotechnique Lett., 2012, 2, 107–112 CrossRef.
- J. C. Quezada, P. Breul, G. Saussine and F. Radjai, PRE, 2012, 86, 031308 CrossRef PubMed.
- N. Roy, J. D. Frost and G. Viggiani, Granular Matter, 2022, 24, 63 CrossRef.
- A. Schofield and P. Wroth, Critical State Soil Mechanics, McGraw-Hill Inc.,US, 1968, p. 310 Search PubMed.
- J. B. Knight, C. G. Fandrich, C. N. Lau, H. M. Jaeger and S. R. Nagel, Phys. Rev. E: Stat., Nonlinear, Soft Matter Phys., 1995, 51, 3957–3962 CrossRef CAS PubMed.
- L. J. Budinski-Petkovi and S. B. Vrhovac, Eur. Phys. J. E: Soft Matter Biol. Phys., 2005, 16, 89–96 CrossRef PubMed.
- J. M. Valverde, A. Castellanos and M. A. Sanchez Quintanilla, PRL, 2001, 86, 3020–3023 CrossRef CAS PubMed.
- J. M. Valverde, A. Castellanos and P. K. Watson, Powder Technol., 2001, 118, 236–241 CrossRef CAS.
- J. M. Valverde and A. Castellanos, Granular Matter, 2007, 9, 19–24 CrossRef.
- R. Cabiscol, H. Shi, I. Wünsch, V. Magnanimo, J. H. Finke, S. Luding and A. Kwade, Adv. Powder Technol., 2020, 31, 1280–1289 CrossRef CAS.
- C. J. Ridgway, K. Ridgway and G. P. Matthews, J. Pharm. Pharmacol., 1997, 49, 377–383 CrossRef CAS PubMed.
- M. A. S. Quintanilla, J. M. Valverde, A. Castellanos and R. E. Viturro, PRL, 2001, 87, 194301 CrossRef CAS PubMed.
- F. Fichtner, A. Rasmuson and G. Alderborn, Int. J. Pharm., 2005, 292, 211–225 CrossRef CAS PubMed.
- E. Garzón, P. J. Sánchez-Soto and E. Romero, Appl. Clay Sci., 2010, 48, 307–318 CrossRef.
- H. Mohammed, B. J. Briscoe and K. G. Pitt, Powder Technol., 2006, 165, 11–21 CrossRef CAS.
- Q. Ku, J. Zhao, G. Mollon and S. Zhao, Powder Technol., 2023, 421, 118455 CrossRef CAS.
- S. Nezamabadi, F. Radjai, J. Averseng and J.-Y. Delenne, J. Mech. Phys. Solids, 2015, 83, 72–87 CrossRef.
- P. A. Cundall and O. D. L. Strack, Géotechnique, 1979, 29, 47–65 CrossRef.
- T. Pöschel and T. Schwager, Computational Granular Dynamics: Models and Algorithms, Springer, 2005 Search PubMed.
- C. Thornton, Granular Dynamics, Contact Mechanics and Particle System Simulations, Springer International Publishing, 2015 Search PubMed.
- P. G. Rognon, J.-N. Roux, M. Naaïm and F. Chevoir, J. Fluid Mech., 2008, 596, 21–47 CrossRef CAS.
- F. Radjai and F. Dubois, Discrete-element modeling of granular materials, ISTE, 2011 Search PubMed.
- F. A. Gilabert, J.-N. Roux and A. Castellanos, Phys. Rev. E: Stat., Nonlinear, Soft Matter Phys., 2008, 78, 031305 CrossRef CAS PubMed.
- V.-D. Than, J.-N. Roux, A.-M. Tang and J.-M. Pereira, E3S Web Conf., 2016, 9, 08008 CrossRef.
- V. D. Than, S. Khamseh, A. M. Tang, J.-M. Pereira, F. Chevoir and J.-N. Roux, J. Eng. Mech., 2017, 143, C4016001 CrossRef.
- S. Mandal, M. Nicolas and O. Pouliquen, Proc. Natl. Acad. Sci. U. S. A., 2020, 117, 8366–8373 CrossRef CAS PubMed.
- S. Mandal, M. Nicolas and O. Pouliquen, Phys. Rev. X, 2021, 11, 021017 CAS.
- R. Moreno-Atanasio, B. Xu and M. Ghadiri, Chem. Eng. Sci., 2007, 62, 184–194 CrossRef CAS.
- T. Kobayashi, T. Tanaka, N. Shimada and T. Kawaguchi, Powder Technol., 2013, 248, 143–152 CrossRef CAS.
- V. Richefeu and P. Villard, Modeling Gravity Hazards from Rockfalls to Landslides, Elsevier, 2016, p. 161 Search PubMed.
- M. P. Allen and D. J. Tildesley, Computer Simulation of Liquids, Oxford University Press, 2017 Search PubMed.
- K. L. Johnson, K. Kendall and A. D. Roberts, Proc. R. Soc. A, 1971, 324, 301–313 CAS.
- R. Moreno-Atanasio, S. Antony and M. Ghadiri, Powder Technol., 2005, 158, 51–57 CrossRef CAS.
- F. Radjaï, I. Preechawuttipong and R. Peyroux, in Cohesive granular texture, ed. P. A. Vermeer, H. J. Herrmann, S. Luding, W. Ehlers, S. Diebels and E. Ramm, Springer Berlin Heidelberg, Berlin, Heidelberg, 2001, pp. 149–162 Search PubMed.
- N. V. Brilliantov, N. Albers, F. Spahn and T. Pöschel, Phys. Rev. E: Stat., Nonlinear, Soft Matter Phys., 2007, 76, 051302 CrossRef PubMed.
- J. B. Burland, Géotechnique, 1990, 40, 329–378 CrossRef.
- D. M. Wood, Soil Behaviour and Critical State Soil Mechanics, Cambridge University Press, 1991 Search PubMed.
- A. Castellanos, Adv. Phys., 2005, 54, 263–376 CrossRef CAS.
- C. Song, P. Wang and H. Makse, Nature, 2008, 453, 629–632 CrossRef CAS PubMed.
- D. C. Vu, L. Amarsid, J.-Y. Delenne, V. Richefeu and F. Radjai, Granular Matter, 2023, 26, 6 CrossRef.
- N. Berger, E. Azéma, J.-F. Douce and F. Radjai, EPL, 2015, 112, 64004 CrossRef.
- H. Laubie, F. Radjaï, R. Pellenq and F.-J. Ulm, J. Mech. Phys. Solids, 2017, 105, 116–130 CrossRef.
- F. Radjai, D. E. Wolf, M. Jean and J.-J. Moreau, Phys. Rev. Lett., 1998, 80, 61–64 CrossRef CAS.
- T. S. Majmudar and R. P. Behringer, Nature, 2005, 435, 1079–1082 CrossRef CAS PubMed.
- V. Richefeu, F. Radjaï and M. S. El Youssoufi, Eur. Phys. J. E: Soft Matter Biol. Phys., 2006, 21, 359–369 CrossRef CAS PubMed.
- R. P. Behringer, K. E. Daniels, T. S. Majmudar and M. Sperl, Philos. Trans. R. Soc., A, 2008, 366, 493–504 CrossRef CAS PubMed.
- F. Fazelpour and K. E. Daniels, Soft Matter, 2023, 19, 2168–2175 RSC.
- V. Richefeu, M. S. El Youssoufi, E. Azéma and F. Radjaï, Powder Technol., 2009, 190, 258–263 CrossRef CAS.
- F. Radjai, S. Roux and J. J. Moreau, Chaos, 1999, 9, 544–550 CrossRef PubMed.
- G. Lian, M. J. Adams and C. Thornton, J. Fluid Mech., 1996, 311, 141 CrossRef CAS.
- V. Richefeu, M. S. El Youssoufi, R. Peyroux and F. Radjaï, Int. J. Numer. Anal. Methods Geomech., 2008, 32, 1365–1383 CrossRef.
- I. Agnolin and J.-N. Roux, Phys. Rev. E: Stat., Nonlinear, Soft Matter Phys., 2007, 76, 061304 CrossRef PubMed.
Footnote |
| † Electronic supplementary information (ESI) available. See DOI: https://doi.org/10.1039/d3sm01116j |
| This journal is © The Royal Society of Chemistry 2024 |

