
Construction of nano-silica particle clusters and their effects on the shear thickening properties of liquids
Xingmin
Zhang
a,
Jian
Zheng
a,
Jianjun
Pan
b,
Xiaoting
Zhang
b,
Jin
Fang
c,
Jie
Min
 *ad and
Chengbing
Yu
*e
*ad and
Chengbing
Yu
*e
aCollege of Chemistry and Chemical Engineering, Donghua University, Shanghai 201620, China. E-mail: minjie@dhu.edu.cn
bHuzhou Customs, Huzhou 313000, Zhejiang, China
cSchool of Textile and Garment, Anhui Polytechnic University, Wuhu 24100, Anhui, China
dKey Laboratory of Textile Science & Technology, Ministry of Education, Shanghai 201620, China
eSchool of Materials Science and Engineering, Shanghai University, Shanghai 201800, China. E-mail: ycb101@shu.edu.cn
First published on 30th November 2023
Abstract
It is of great research significance to prepare a new shear thickening fluid (STF) with a simple process, remarkable thickening effect and excellent impact resistance from the properties of the particles. Inspired by the shear thickening mechanism, nano-silica particle clusters (SPC) with different morphological structures were prepared by the reaction of amino-modified silica with polyethylene glycol diglycidyl ether (PEGDGE), and the structure models of particle clusters were designed through theoretical analysis. The structure of SPC was affected by the degree of amination modification and the molecular weight of PEGDGE, which was analyzed by DLS and TEM. The shear thickening behavior of the fluid was evaluated by steady-state rheology and dynamic-state rheology analysis. The shear thickening behavior of the fluid composed of SPC also changed greatly with the influence of the degree of amination modification and the molecular weight of PEGDGE. In addition, compared with the STF contained original silica, the STF contained SPC could produce a faster and stronger shear thickening response. Therefore, silica particle clusters are not only a promising candidate for the preparation of high-performance shear thickening fluids, but can also be better applied to industrial and scientific fields such as impact protection and shock absorption.
1. Introduction
In the early stage of industrial processing, the emergence of shear thickening hindered fluid movement, resulting in fluid blockage in narrow pipes and uneven coating on the surface of the material and other problems that limit the processing rate.1 Researchers have carried out a lot of experiments and studies on this phenomenon, and found that the rheological properties of shear thickening fluid (STF) change sharply under the impact of external force, and the apparent viscosity will increase rapidly and violently, even making it change from fluid state to solid-like state.2–4 Interestingly, the process is reversible, and STF can return to its initial viscous liquid state once the impact force is removed.5,6 This unique property of STF has been used in the development and design of protective materials,7–9 dampers,10 industrial polishing,11,12 battery safety13,14 and other fields.STF is usually referred to as a dense colloidal suspension formed by one or more particles dispersed in a solvent, consisting of a dispersed phase and a dispersing medium.15 At present, it is generally believed that the ‘particle cluster’ theory16–18 is more reasonable to explain the non-Newtonian fluid behavior of STF. When the shear rate is low, the disturbed dispersion system can quickly return to the initial state due to the Brownian motion between particles and intermolecular interaction, and the viscosity will not change obviously in consequence. With the increase of shear rate, the network structure of the system was gradually destroyed, and the fluid viscosity decreases significantly. When it reaches the critical shear rate, the hydrodynamic force overcomes the repulsive force between particles, prompting the unstable functional groups in the system to rapidly aggregate and form particle clusters. The particle clusters gradually become larger with the increase of hydrodynamic force, which makes the flow resistance increase. Accordingly, the apparent viscosity of the fluid increases rapidly, and eventually the shear thickening phenomenon occurs.
Silica is an inexpensive and environmentally friendly raw material. STF with silica as the dispersed phase has received extensive attention and research. Gong et al.19 combined silica STF with Kevlar fiber. When the knife penetrated the fabric, the reinforcement of SiO2 particles in the fabric could enhance the coupling between STF and fiber, inducing more yarns to participate in load sharing and energy absorption, and thus significantly improving the anti-penetration performance of the fabric. Compared with submicron silica STF, fumed silica STF with nano-sized particles exhibited shear thickening at low silica concentration.20,21 In terms of the shape of silica, it is found that irregular silica had a high length-diameter ratio, which was more likely to cause shear thickening behavior. STF based on spherical silica had a wider thickening range because spherical particles were easy to slide.6,22 Adding ceramic particles, carbon nanotubes, graphene sheets and other additives to the silica fluid to prepare multiphase shear thickening materials can also adjust the shear thickening behavior.23–26 In multi-walled carbon nanotubes with hydroxyl functional groups on the surface (MWCNTs) it was difficult for silica to form clusters because of their own network entanglement structure, which reduced the shear thickening behavior of the silica STF. The large surface area of graphene oxide sheets (GONPs) was beneficial to the formation of the network particle clusters of silica particles, making the shear thickening become fast and efficient.27 Prabhu et al.28 found that the carrier liquid played a crucial role in the process of shear thickening, and the increase of the molecular weight of the carrier liquid would reduce the critical shear rate.
Studying the factors affecting the shear thickening phenomenon is important for modifying and controlling the thickening fluids. The surface properties of silica determine the rheological behavior of dense suspensions. Moreover, it is easy to agglomerate and difficult to disperse uniformly in the organic phase due to the high surface energy of silica. Therefore, it is necessary to modify the surface of silica. Katiyar et al.29 used 3-(aminopropyl) triethoxysilane (APTES) to functionalize silica. The functionalized colloids showed greatly enhanced shear-thickening properties and exhibited an improved dynamic response with enhanced elastic behavior under varying strain and frequency conditions. Silica modified with different functional groups can change the interaction or frictional contact between particles by changing the surface interaction, thus affecting the rheological behavior of the fluid.30,31 Compared with the STF composed of silica modified by silane methyltrimethoxysilane (MTMS), the APTES-modified silica STF exhibited a higher peak viscosity and lower critical shear rate due to the enhanced interaction of particle–particle and particle–medium.32 Sahoo et al.33 synthesized organic modified silica using a one-step co-condensation method. They concluded that the degree of functionalization of silica particles can be controlled, thereby adjusting the shear thickening behavior.
Herein, we first aminated the surface of SiO2 using the silane coupling agent KH550 to increase the amino content and improve the dispersion effect. Then, the modified silica particles with different degrees of amination were mixed and reacted with the intermediate polyethylene glycol diglycidyl ether (PEGDGE). According to the amino content of the modified silica and the molecular weight of PEGDGE, the silica particle clusters with different morphologies and the model structures were obtained. STF was formed by dispersing silica particle clusters in polyethylene glycol (PEG). Combined with the change in the rheological properties of STF, the influence mechanism and law of silica particle clusters on the shear thickening of the system were studied.
2. Experimental
2.1. Materials
The precipitated silica was of industrial grade, and was purchased from Jiangsu Boan New Materials Co., Ltd, China. γ-Aminopropyl triethoxysilane (KH550) was purchased from Wuhan Lanabai Pharmaceutical Chemical Co., Ltd, China. Anhydrous ethanol, ethylene glycol, polyethylene glycol (PEG), polyethylene glycol diglycidyl ether (PEGDGE) and bromocresol green-methyl red indicator which was a compound solution were all provided by Sinopharm Chemical Reagent Co., Ltd, China. Hydrochloric acid was obtained from Shanghai Lingfeng Chemical Reagent Co., Ltd, China. Sodium hydroxide was purchased from Shanghai Titan Technology Co., Ltd, China.2.2. Surface modification of silica
As shown in Fig. 1(a), the hydrolysate of the coupling agent was prepared by mixing distilled water, KH550, and anhydrous ethanol in a mass ratio of 1![[thin space (1/6-em)]](https://www.rsc.org/images/entities/char_2009.gif) :1:10 with stirring. The dried SiO2 was added to ethylene glycol in batches and subjected to ultrasonic dispersion treatment. After the suspension was uniformly dispersed and stabilized, it was heated at 90 °C for 6 h. During the process, the hydrolysate of the coupling agent was slowly added dropwise, and the mass fraction was controlled to be 1 wt%, 5 wt% and 10 wt%. The ethoxy group on KH550 was hydrolyzed to the hydroxyl group in the alcohol–water system, which then reacted with the hydroxyl group on the surface of silica to complete the modification. The specific equation of the chemical modification reaction is shown in Fig. 1(b). After the reaction was finished, the product was centrifuged and washed several times and dried to obtain modified silica (MS). According to the mass fraction of the hydrolysate of the coupling agent, the different modified silica were named MS-x, where x represents the mass fraction of the hydrolysate of the coupling agent. A schematic diagram showing this is given in Fig. 1(c).
:1:10 with stirring. The dried SiO2 was added to ethylene glycol in batches and subjected to ultrasonic dispersion treatment. After the suspension was uniformly dispersed and stabilized, it was heated at 90 °C for 6 h. During the process, the hydrolysate of the coupling agent was slowly added dropwise, and the mass fraction was controlled to be 1 wt%, 5 wt% and 10 wt%. The ethoxy group on KH550 was hydrolyzed to the hydroxyl group in the alcohol–water system, which then reacted with the hydroxyl group on the surface of silica to complete the modification. The specific equation of the chemical modification reaction is shown in Fig. 1(b). After the reaction was finished, the product was centrifuged and washed several times and dried to obtain modified silica (MS). According to the mass fraction of the hydrolysate of the coupling agent, the different modified silica were named MS-x, where x represents the mass fraction of the hydrolysate of the coupling agent. A schematic diagram showing this is given in Fig. 1(c).
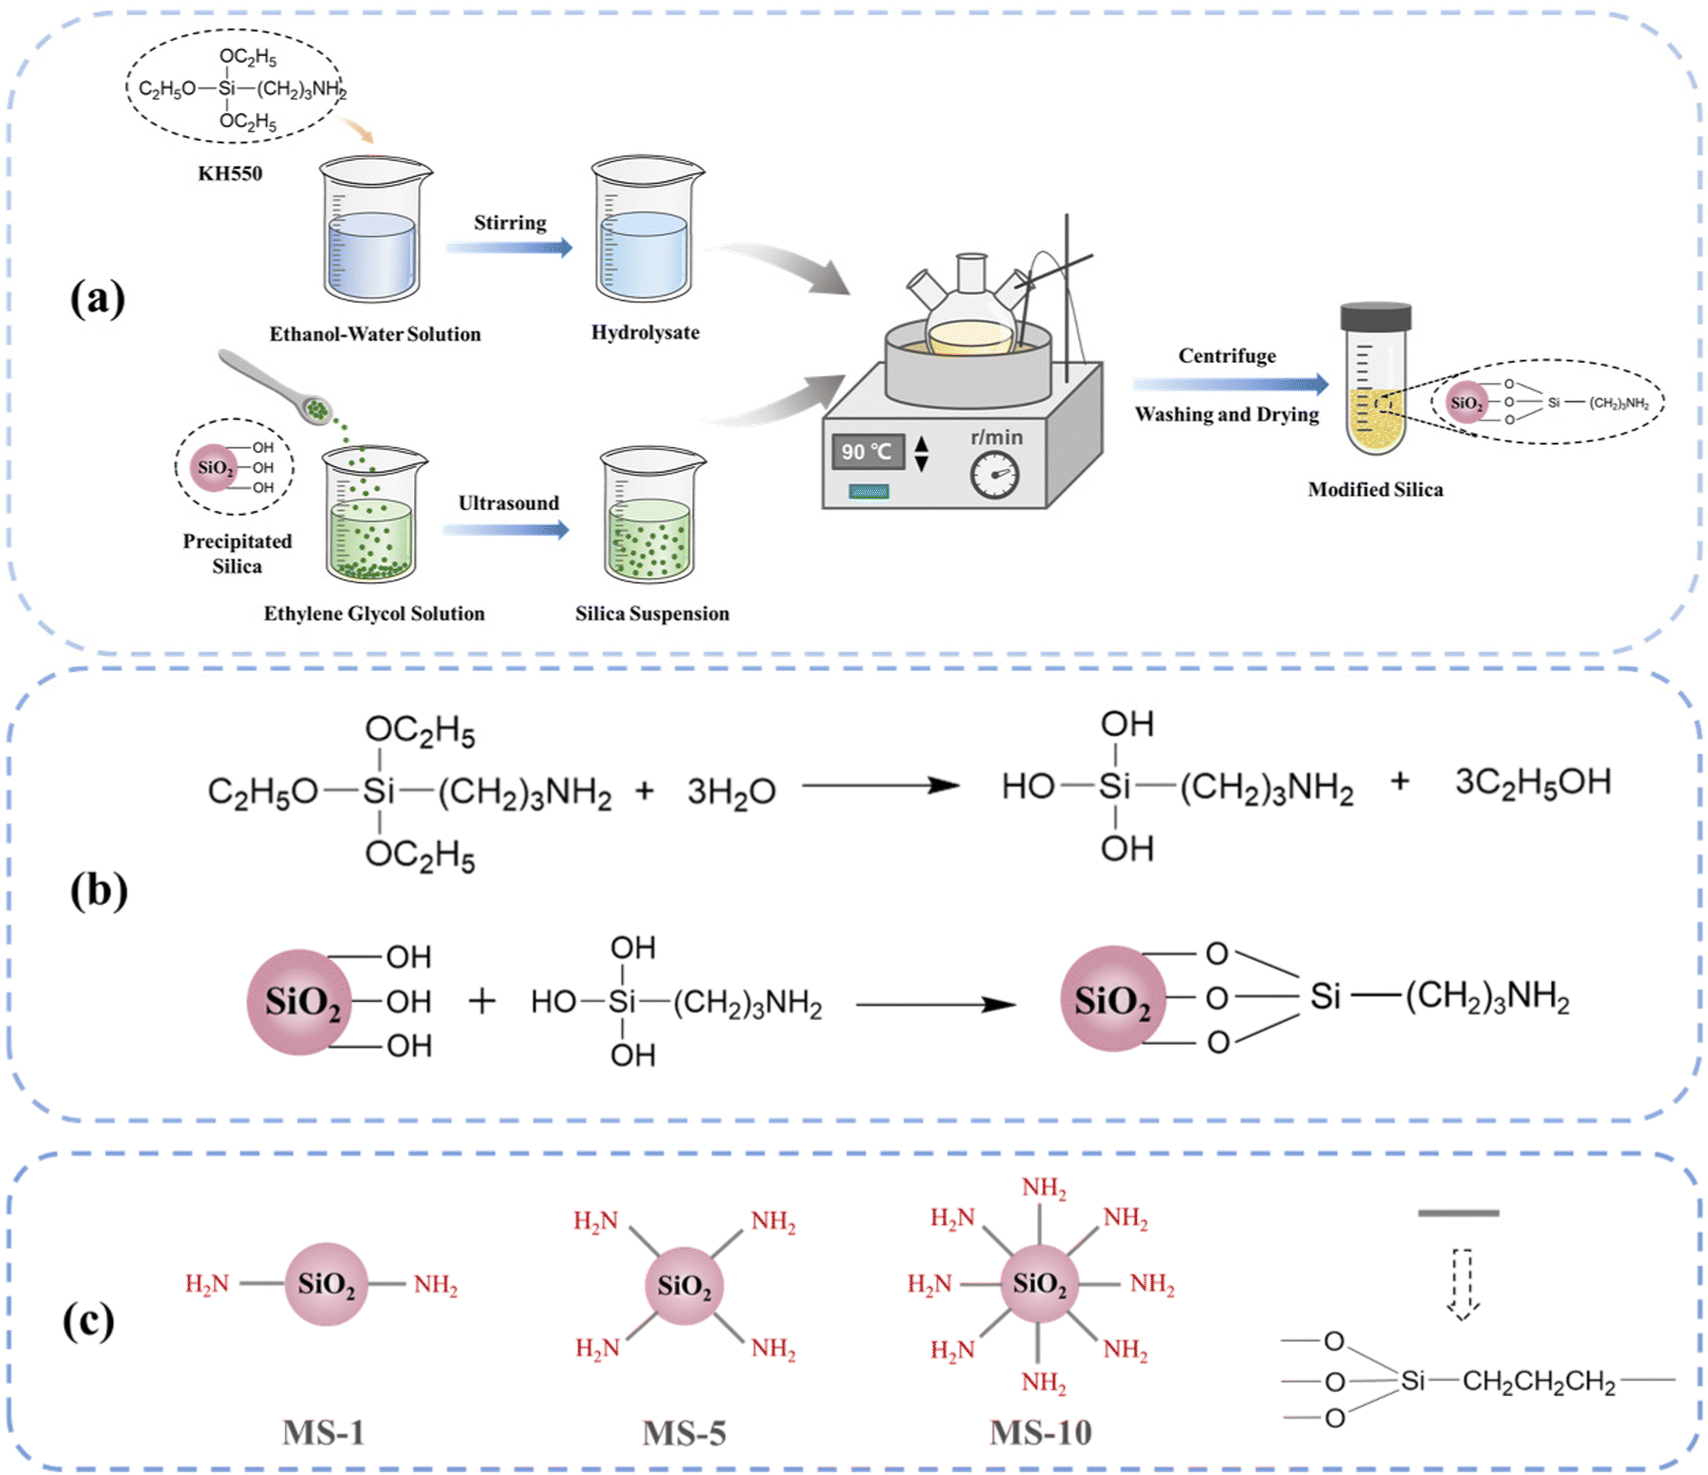 | ||
| Fig. 1 (a) Schematic diagram of the modification process of SiO2 nanoparticles by silane coupling agent KH550. (b) Modification reaction equation of the silica surface. (c) Schematic diagram of silica with different degrees of modification. | ||
2.3. Design and construction of silica particle clusters
MS-1, MS-5 and MS-10 were sequentially paired in a 3:1 molar ratio and then reacted with PEGDGE. Different forms of silica particle clusters (SPC) were formed depending on the amount of amino content of the MS particles. As shown in Fig. 2, three models of particle clusters X, Y and Z were designed. The MS particles with less amino content will undergo an epoxy ring-opening reaction with PEGDGE to form a chain-like particle cluster with a simple structure and linear arrangement, that is, the SPC of X model. With the increase of amino content, the ring-opening reaction between MS and the epoxy group will be intensified. The structure of SPC will change from a chain to a small network, which corresponds to the Y model. The MS particles with the highest amino group content will show significantly higher reactivity with the terminal epoxy group of PEGDGE, forming a SPC of the Z model with a complex structure and many dendritic structures.
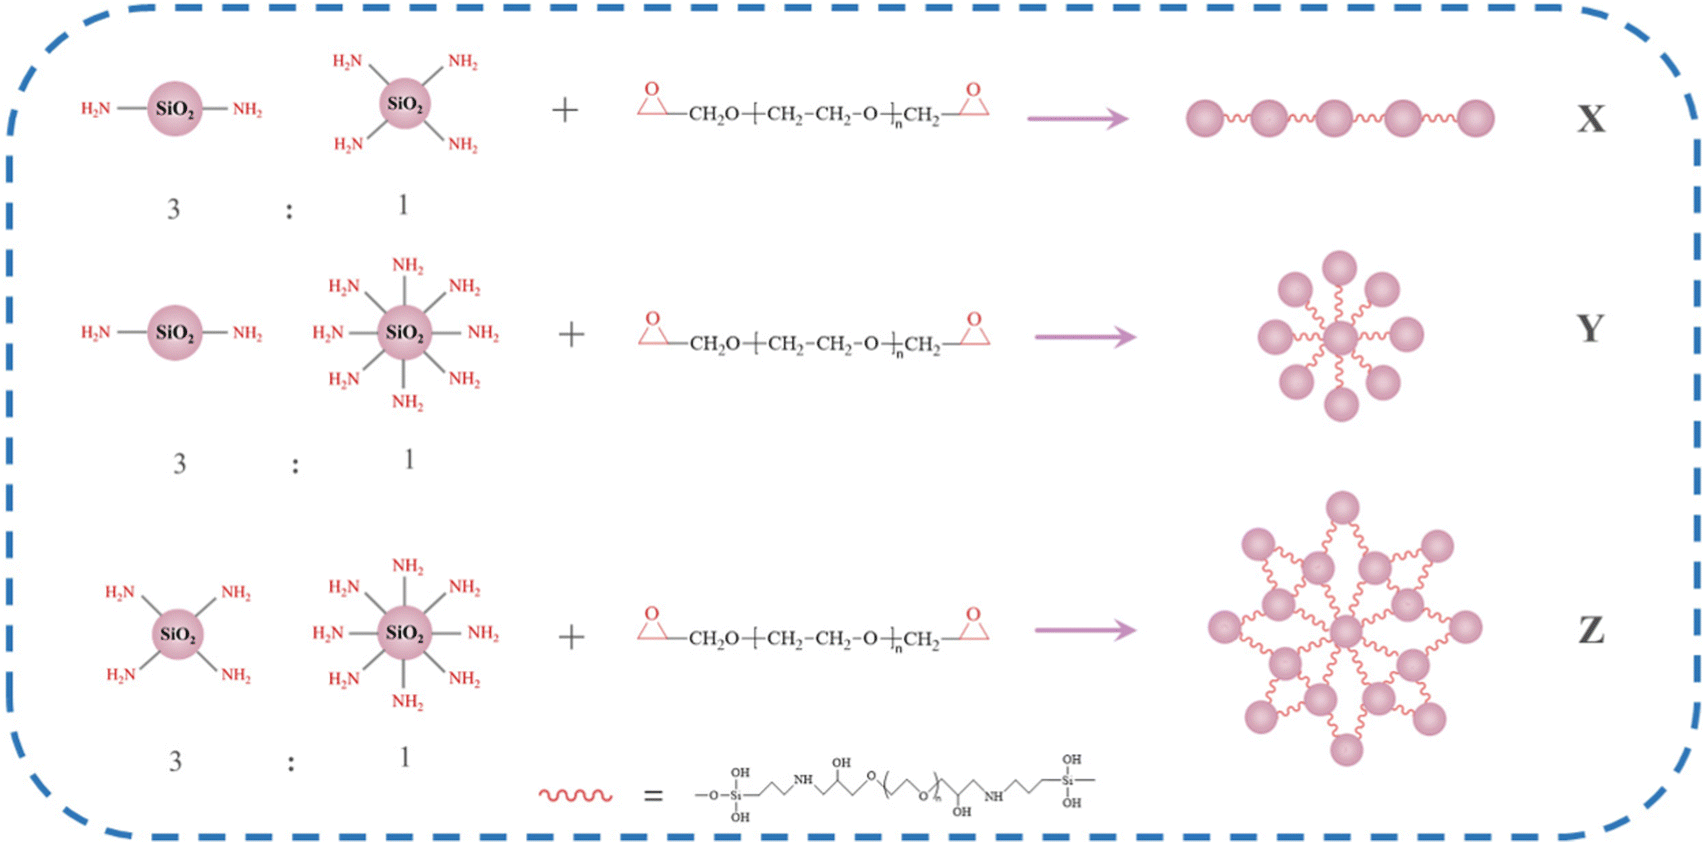 | ||
| Fig. 2 Design principle for particle clusters of different models. | ||
Six kinds of silica particle clusters, SPC-1, SPC-2, SPC-3, SPC-4, SPC-5 and SPC-6, were prepared by using the MS particles with different amino content and PEGDGE with molecular weights of 400 and 1000 (PEGDGE-400 and PEGDGE-1000) as experimental raw materials. The particle clusters were classified according to the theoretical models of X, Y and Z. The specific experimental process formula is shown in Table 1.
| Combination types of MS | Types of PEGDGE | Types of SPC | ||
|---|---|---|---|---|
| Molecular weight | Epoxy value (mmol g−1) | Name of SPC | Model of SPC | |
| MS-1:MS-5 = 3:1 |
400 | 3.0 | SPC-1 | X |
| MS-1:MS-10 = 3:1 |
SPC-2 | Y | ||
| MS-5:MS-10 = 3:1 |
SPC-3 | Z | ||
| MS-1:MS-5 = 3:1 |
1000 | 1.8 | SPC-4 | X |
| MS-1:MS-10 = 3:1 |
SPC-5 | Y | ||
| MS-5:MS-10 = 3:1 |
SPC-6 | Z | ||
In the experiment, PEGDGE and a specific MS combination were mixed in ethanol at a molar ratio of 1:1, and stirred magnetically at 85 °C for 3 h. After the reaction, the reaction product was centrifuged with anhydrous ethanol and dried for 6 h.
2.4. Preparation of silica-based fluids
The dried silica powder was slowly added to PEG, with mechanical stirring and ultrasonic treatment carried out simultaneously. After being uniformly dispersed, silica was continuously added until the required mass fraction was reached. Finally, the SiO2/PEG dispersion system was put into a vacuum drying oven for vacuum defoaming treatment.The preparation process of the MS/PEG system and SPC/PEG system were the same as above.
2.5. Characterization
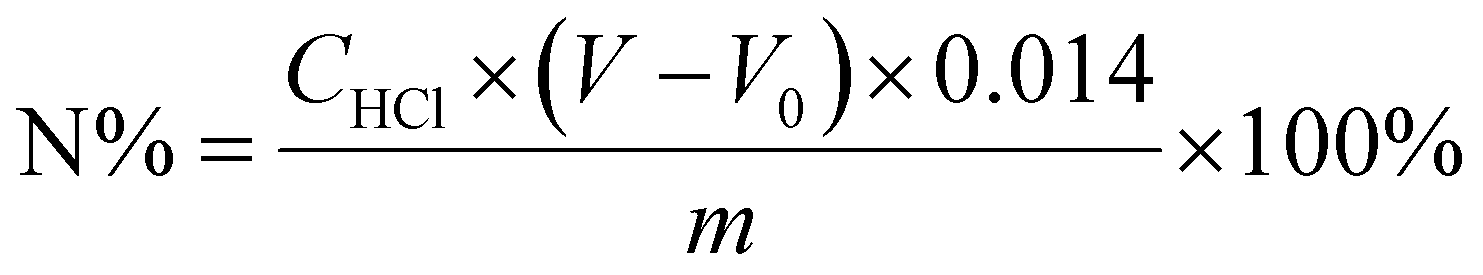 | (1) |
3. Results and discussion
3.1. Preparation of MS particles
The silica particles before and after amino modification were analyzed by infrared spectroscopy, as shown in Fig. 3(a). The absorption peaks at 1126 cm−1 and 851 cm−1 were the stretching vibration peaks of Si–O–Si.34,35 The peaks at 3421 cm−1 and 1627 cm−1 were attributed to the stretching vibration and deformation vibration of Si–OH, respectively.36 In the infrared spectra of silica particles modified with different concentrations of KH550, methylene peaks were observed at about 2944 cm−1 and 2877 cm−1.36 Meanwhile, the symmetric vibration peak of –N–H and the stretching peak of N–H appeared at 1467 cm−1 and at 3300 cm−1 respectively,37 indicating that the silica particles had been successfully modified.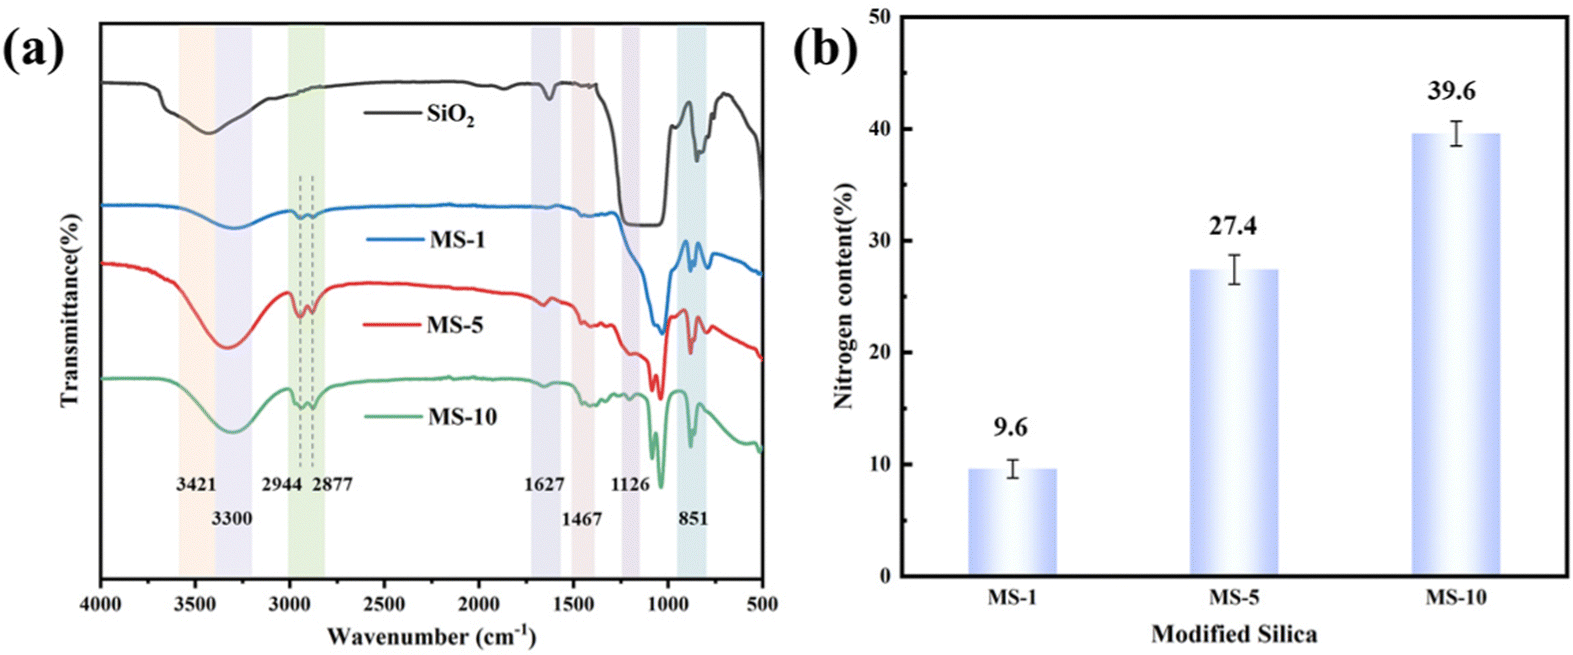 | ||
| Fig. 3 (a) IR spectra of SiO2 and MS and (b) the nitrogen content of different MS. | ||
In addition, the nitrogen content of MS was obtained by acid–base titration, and the data are shown in Fig. 3(b). It can be observed that the nitrogen content of MS particles increased gradually with the increase of the mass fraction of KH550. The nitrogen content reached 39.6% when KH550 was put in at 10 wt%. It is further demonstrated that the amino functionalization of silica nanoparticles was completed, and the degree of functionalization increased with the increase of the dosage of coupling agent.
The apparent morphologies of unmodified silica particles and silica particles modified by coupling agents with different mass fractions are shown in Fig. 4.
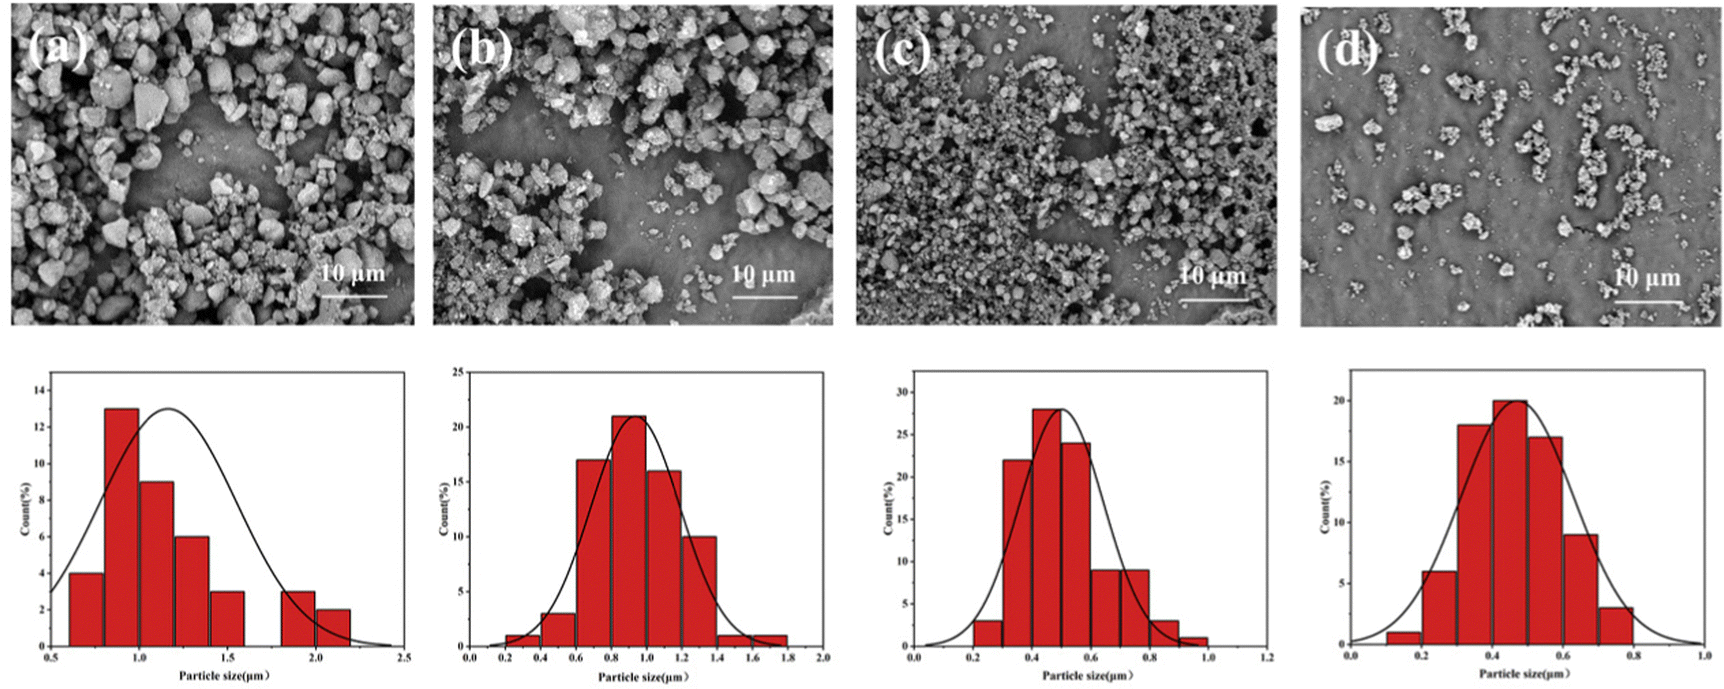 | ||
| Fig. 4 SEM images and distribution curves of unmodified silica (a), MS-1 (b), MS-5 (c) and MS-10 (d). | ||
At the same magnification, it can be observed that the unmodified silica particles had the largest particle size and the widest particle size distribution. This was because nano-silica was characterized in a large specific surface area and high surface energy. At the same time, there were a large number of hydroxyl groups on the surface of unmodified silica. Unmodified silica particles would agglomerate due to the condensation between hydroxyl groups. After the silica particles were modified by KH550, the number of hydroxyl groups on the surface of the particles decreased, while the number of amino groups increased. The amino group was hydrophilic, which would increase the adsorption of water molecules, easily forming a hydration layer on the surface of the particles. The amino group and the hydrogen ion were easily combined into positive ammonium ions, which made the hydration layer positively charged. Therefore, there was electrostatic repulsion between the different modified silica. Electrostatic repulsion38 prevented the agglomeration of particles and improved the stability of the system. In addition, the steric hindrance generated by the organic groups on the surface of the silica particles also improved the stability of the system. With the increase of the mass fraction of KH550, the modification degree of silica particles also increased. Therefore, it can be seen in Fig. 4(b)–(d) that the dispersion of the particles gradually became better, and the average particle size gradually decreased with the narrower size distribution.
3.2. Preparation of SPC
The particle size and particle size distribution of SPC were tested, and the experimental results are shown in Fig. 5.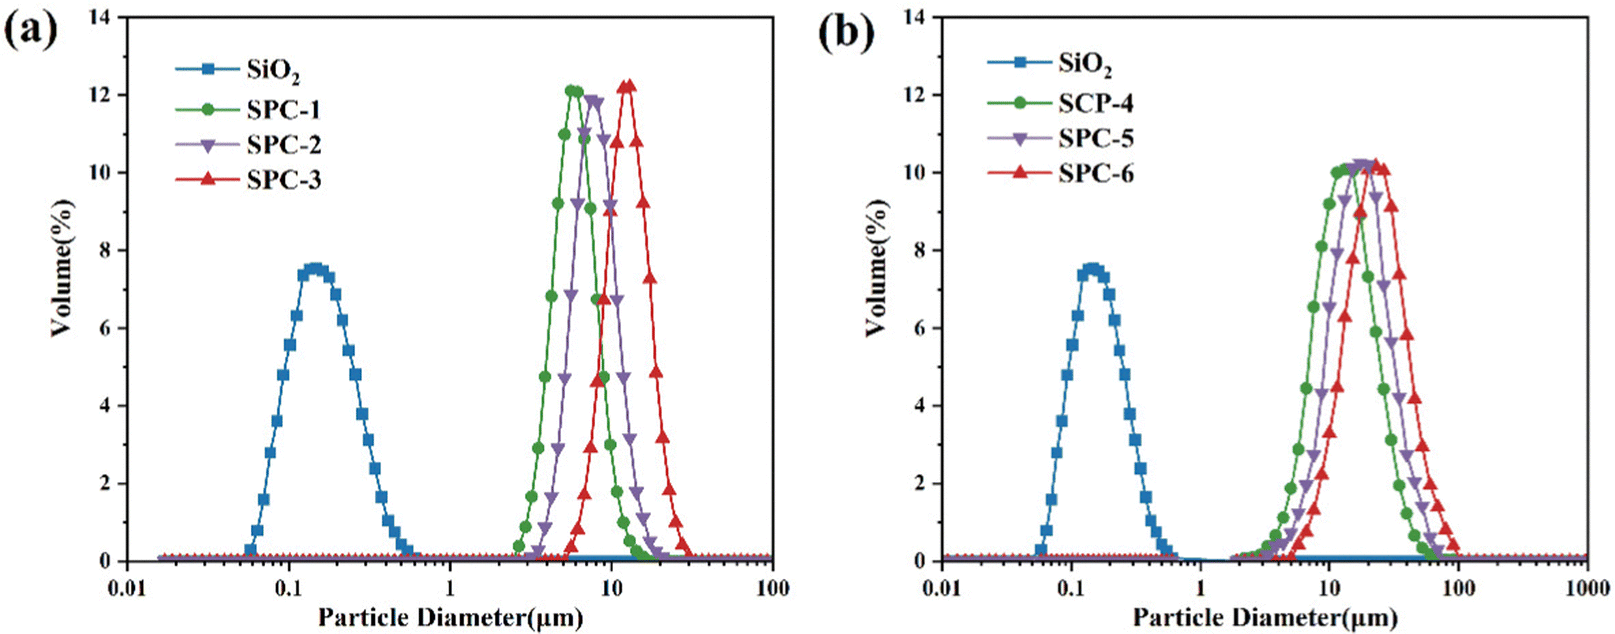 | ||
| Fig. 5 The particle size of SPC obtained from (a) PEGDEG-400 and (b) PEGDGE-1000. | ||
In Fig. 5(a), it was shown that the particle size of SPC-1, SPC-2 and SPC-3 synthesized by PEGDGE-400 was dozens of times larger than that of the unmodified SiO2. During the preparation of SPC-3, the amino content of the MS particle was the highest, which made it more reactive with the epoxy group of PEGDGE. Therefore, the average particle size of SPC-3 was the largest, reaching 13.08 μm, which was almost 73 times that of the unmodified particles. The sizes of SPC-1 and SPC-2 were correspondingly small, 6.26 μm and 8.21 μm, respectively, due to the relatively small number of reactive groups on the MS particle.
For the SPC particles synthesized using PEGDGE-1000, as shown in Fig. 5(b), the particle size of SPC-4, SPC-5 and SPC-6 increased by more than 100 times compared with the unmodified SiO2. Meanwhile, similar to the case of SPC-3 mentioned above, because the highest amino group content of the combination of MS particles made the MS particle with higher reactivity with PEGDGE during the preparation of SPC-6, the average particle size of SPC-6 was the largest which was 26.03 μm.
In fact, the six kinds of particle clusters formed a narrow particle size distribution with a large degree of particle size uniformity, and the particles all reached the micron level in size. Under the same reaction conditions, the size of SPC-4, SPC-5 and SPC-6 was further increased compared with SPC-1, SPC-2 and SPC-3 formed by PEGDGE-400, which could reach twice that of the former. This was mainly because the larger the molecular weight of PEGDGE, the longer the chain structure of the particle clusters, the more complex the structure of the particles, and the larger the particle clusters that would be formed.
To verify whether the structure of the synthesized particle cluster was consistent with the model of the particle cluster we designed and constructed, the morphologies of SPCs were observed using TEM. The observation results are shown in Fig. 6.
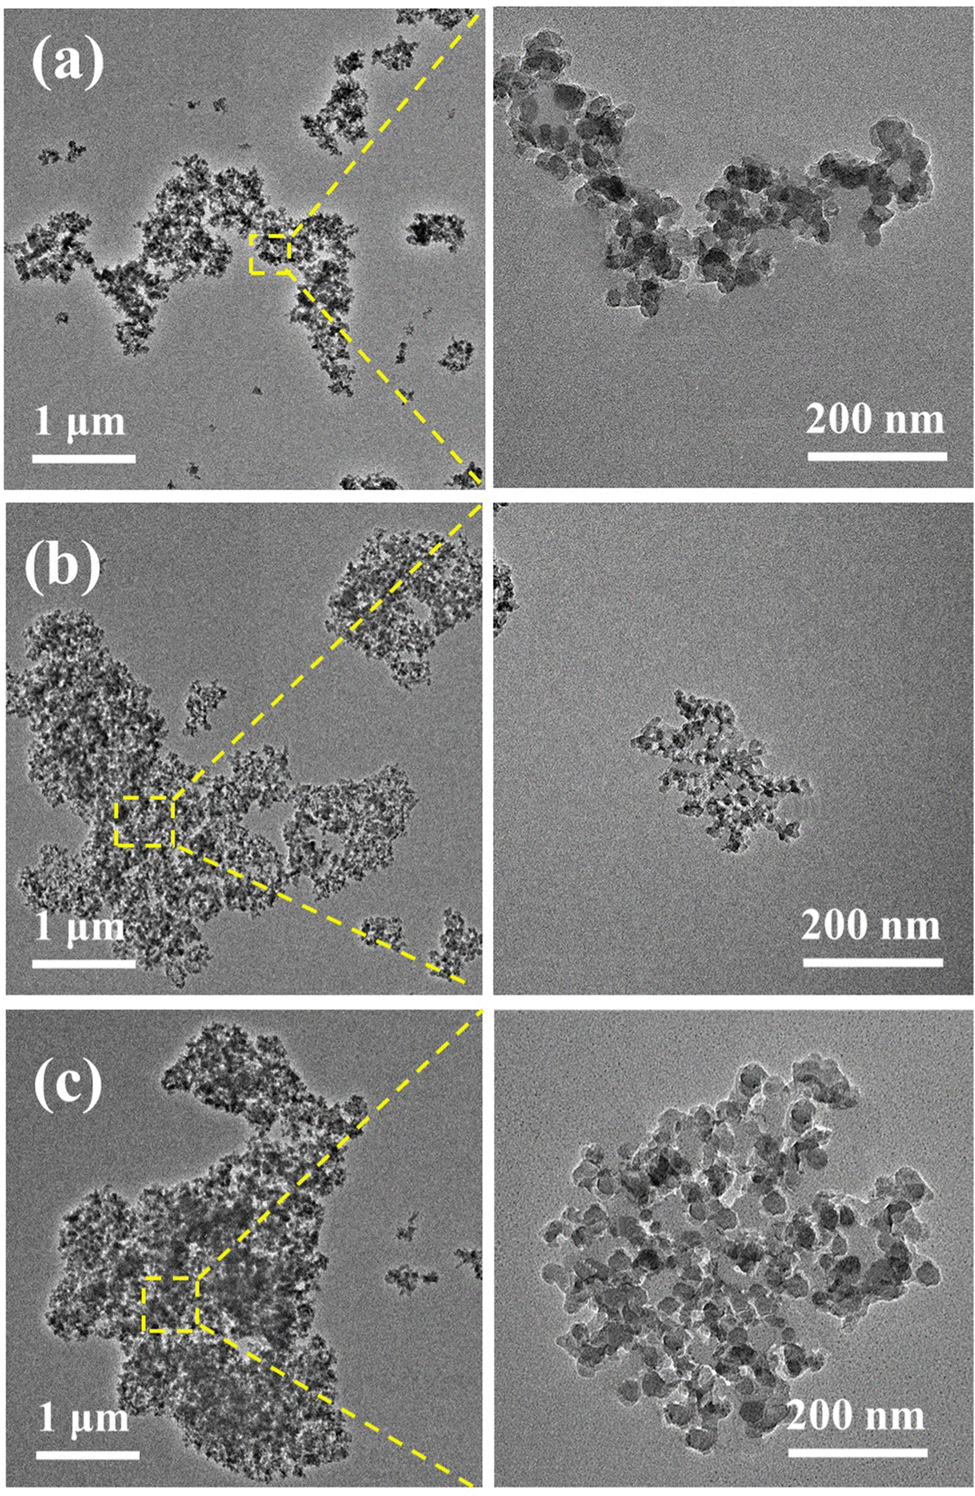 | ||
| Fig. 6 TEM images of SPC-1 (a), SPC-2 (b) and SPC-3 (c). | ||
As shown in Fig. 6(a), due to the relatively small number of reactive groups on the surface of MS particles, the particle cluster SPC-1 took the shape of a chain-like linear structure formed by silica particles connected by a long polyether chain, which was consistent with the X model. For SPC-2, as shown in Fig. 6(b), since it was obtained by the reaction of MS with moderate amino content and epoxy intermediate, it can be seen that the silica particles inside the SPC structure were dendritically connected, as we designed the Y model. In Fig. 6(c), the silica particles inside SPC-3 were connected to each other to form a more complex dendritic network structure, and the particle size of the particle cluster SPC-3 increased sharply, which was consistent with the designed Z model.
SPC-4, SPC-5 and SPC-6 formed by the reaction of PEGDGE-1000 with MS had a larger particle size, and a longer and more complex molecular chain structure than the first three particle clusters. Their apparent morphologies could not be clearly observed using TEM. However, according to the same reaction principle and feed ratio, SPC-4, SPC-5 and SPC-6 should also correspond to the X, Y and Z models respectively.
3.3. Analysis of the rheological properties of silica-based fluids
The critical point of shear thickening is the point where the external shear force is balanced with the Brownian motion of particles, the hydrogen bond and van der Waals forces between particles, the electrostatic force and the steric hindrance. The corresponding shear rate is defined as the critical shear rate (γc), which is an important parameter to characterize the shear thickening phenomenon.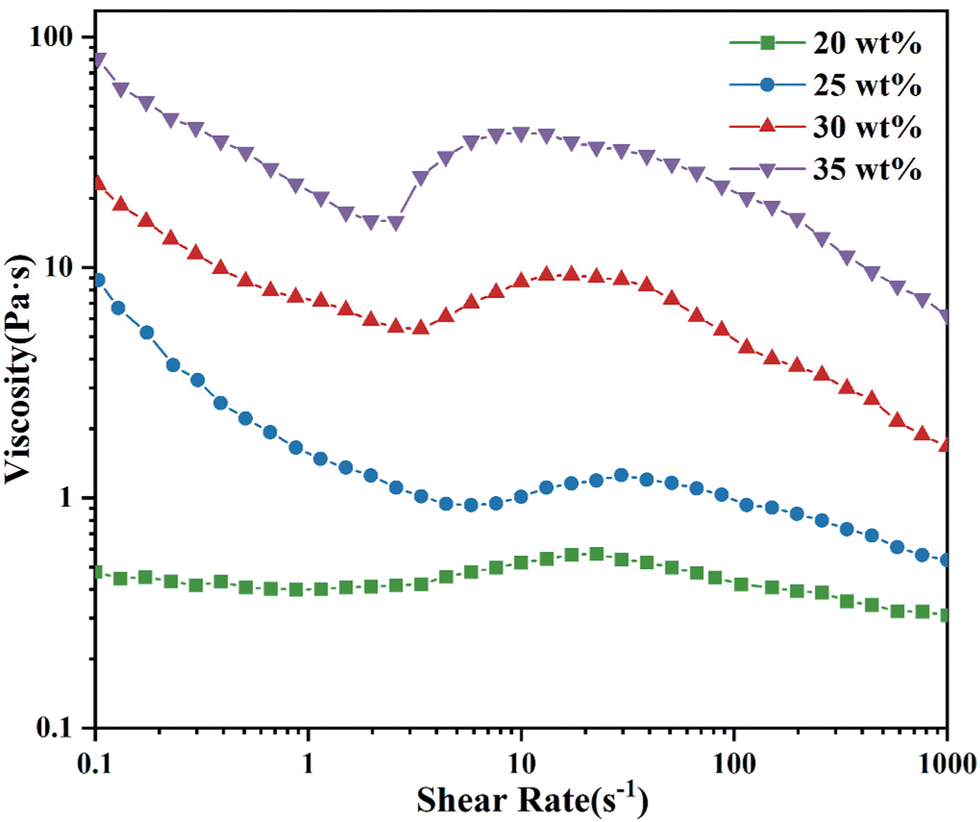 | ||
| Fig. 7 Steady-state shear rheological curves of SiO2/PEG systems with different mass fractions of SiO2. | ||
As shown in Fig. 7, the viscosity of the SiO2/PEG system did not change significantly and fluctuated around 0.50 Pa s at a SiO2 mass fraction of 20 wt%. It was close to a Newtonian fluid. When the mass fraction of SiO2 increased to 25 wt% and above, the viscosity of the fluid gradually reduced with the increase of shear rate at a low shear rate, showing the phenomenon of shear thinning. After that, with the increase of shear rate, the SiO2/PEG system gradually reached the critical point of shear thickening and exhibited a certain shear thickening. It is worth noting that the greater the amount of SiO2, the more easily the system reached the critical thickening point. The SiO2/PEG fluid with a mass fraction of dispersed phase of 35 wt% had the smallest γc of 2.57 s−1, and the viscosity increased from 15.89 Pa s to 38.48 Pa s after it reached the critical point. Therefore, the mass fraction of the dispersed phase of the fluid system mentioned below was set to 35 wt%.
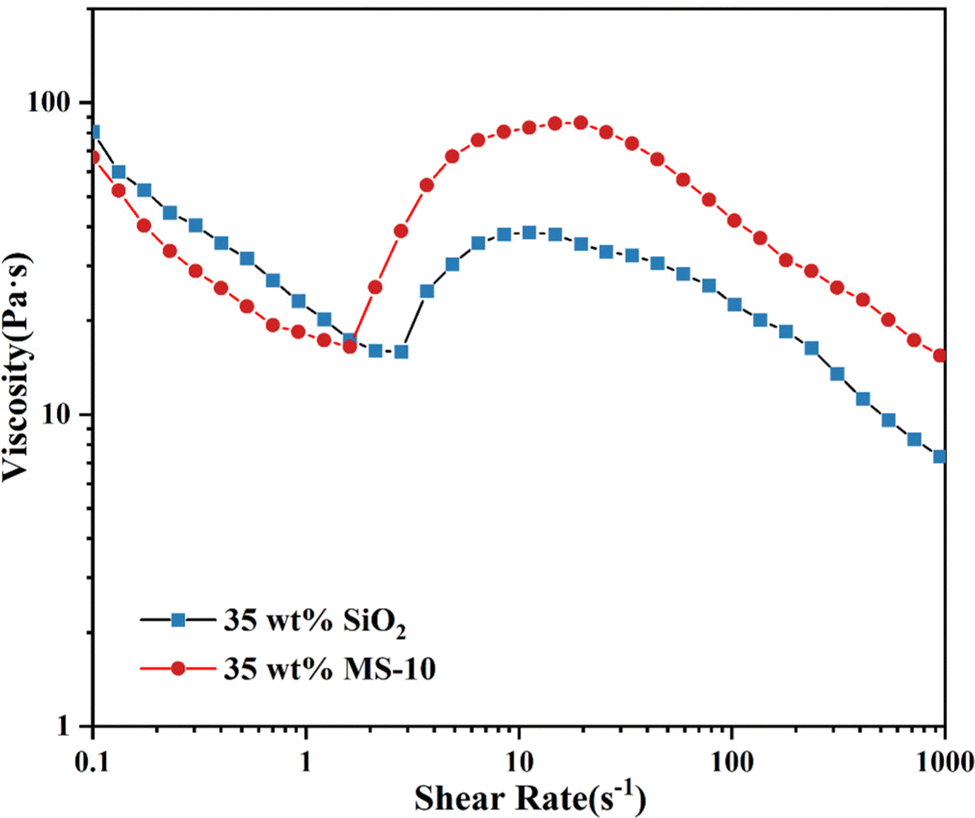 | ||
| Fig. 8 Steady-state shear rheological curves of SiO2/PEG and MS/PEG fluids at a dispersed phase concentration of 35 wt%. | ||
It can be seen from Fig. 8 that the γc of the MS/PEG fluid was smaller than that of the SiO2/PEG fluid, and the peak viscosity after shear thickening was higher. It is considered to be related to the number of hydroxyl groups on the particle surface and the particle size distribution.
There were a large number of silanol hydroxyl groups on the surface of unmodified SiO2 particles, so there was a strong hydrogen bond attraction between particles and the suspending media. In contrast, most of the hydroxyl groups on the surface of the MS particles had reacted, and the hydrogen-bond density was reduced, so that the network structure formed between the particles and medium in suspension could be destroyed by a small shear force.39 There were layers with a change of velocity gradient inside the fluid. The silica particles were bound to obtain a higher speed of motion when they were in the path of high-speed deformation of the fluid. In the unmodified silica system, the dispersed phase contained monodispersed particles and secondary aggregates, with wide and non-uniform particle size distribution. Some silica particles with a small particle size would squeeze into the gap between the silica aggregates with a large particle size under the action of shear force, resulting in soft aggregation. The particle size uniformity of the modified silica was improved. In the velocity field of the fluid, hard agglomerates were more likely to generate between the particles. Therefore, the difference in peak viscosity between the two fluid systems can be observed in the figure for this reason.
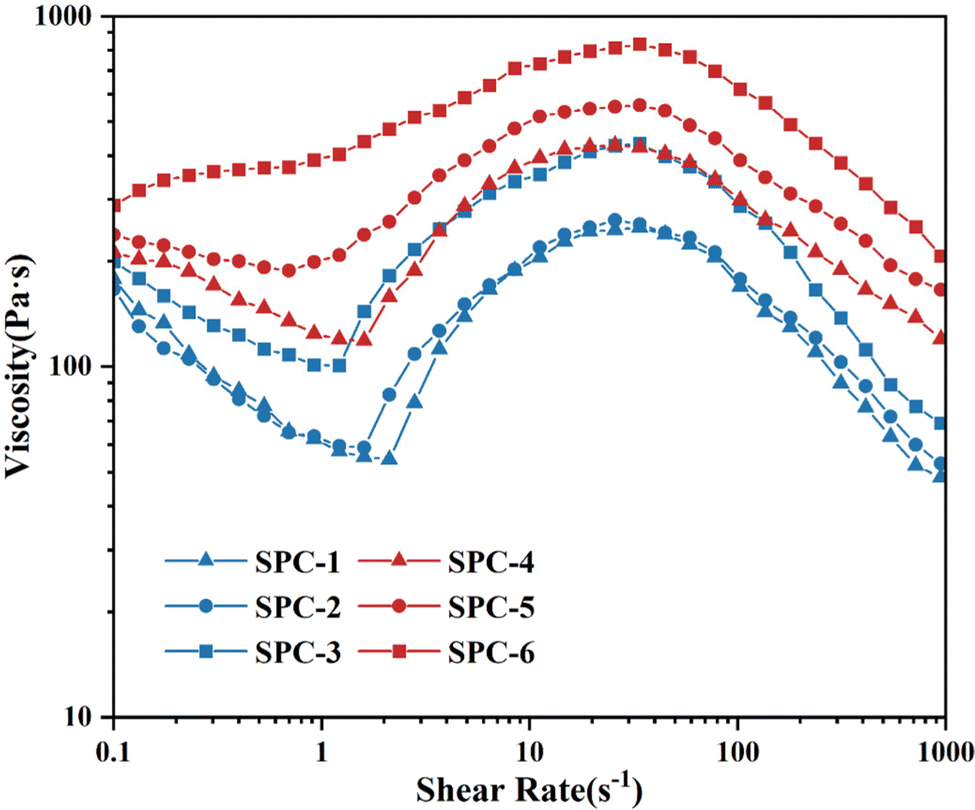 | ||
| Fig. 9 Steady-state shear rheological curves of the SPC/PEG system. | ||
As shown in Fig. 9, SPC-1 and SPC-2 underwent more obvious shear thinning at a low shear rate, and the peak viscosity was weaker than that of SPC-3 after reaching γc. The fluid viscosity of the SPC-3 sample increased from 100.05 Pa s to 433.29 Pa s after γc = 1.21 s−1, and the thickening effect was remarkable.
Fig. 10 outlines the possible reasons for the above phenomenon. Under the action of shear, there was always a certain velocity gradient between each liquid layer. The particles at the position with a larger shear force collided rapidly and formed small cluster aggregates, while the particles at the position with a smaller shear force moved slowly and were not easily aggregated. Different from SiO2/PEG or MS/PEG fluid, the nano-silica particles in SPC in the SPC/PEG fluid were connected by polyether long chains. When subjected to external shear force, in addition to van der Waals forces, hydrogen bonds between particles and the hydrodynamic forces in the system, there was also the attraction of covalent bond forces in the long chain of polyether, which would comprehensively overcome the repulsive forces such as the steric repulsion and Brownian motion between particles. Therefore, the SPC/PEG system required weaker hydrodynamic forces to form particles into cluster aggregates than SiO2/PEG or even MS/PEG systems, and its shear thickening occurred faster, resulting in smaller γc.
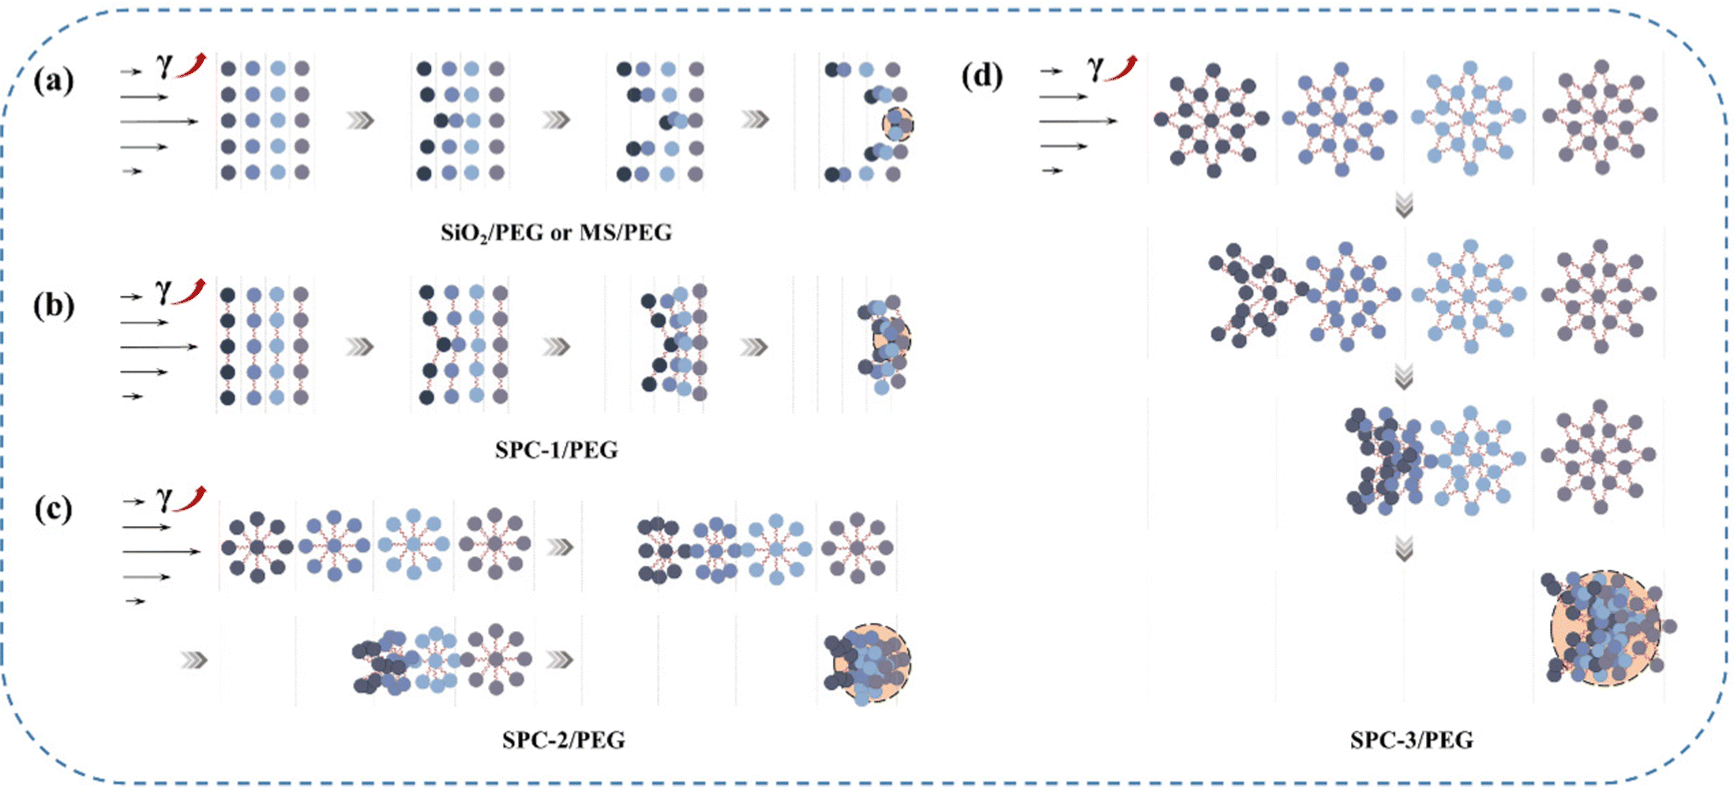 | ||
| Fig. 10 Thickening process of SiO2/PEG or MS/PEG fluid (a) and the SPC/PEG fluid with SPC-1 (b), SPC-2 (c) and SPC-3 (d) as dispersed phases under shear. | ||
In addition, the nano-silica particles in the SPC did not simply move in parallel with the direction that follows the shear impact in each fluid layer in a short time, but moved in a gradual oblique motion under the combined effect of shear force and covalent bond force in the long chain of polyether, entering the fluid layer with different flow rates. The result of this movement was that it was easy to make more particles contact quickly, and the particles continued to aggregate to form larger clusters. Finally, the bonding effect of particle cluster aggregates was stronger, the fluid flow was more easily blocked, and the shear thickening effect was remarkable. Obviously, the solvent viscosity of the SPC/PEG fluid was also increased.
The shear thickening effect of the SPC/PEG fluid composed of different models of SPC also varied with the structure of particle clusters. SPC-1, SPC-2 and SPC-3 corresponded to X, Y and Z models, respectively. Their structures were chain-like, spherical-like and star-like, which were more complex with more dendritic structures and shorter distances between some adjacent particles in turn. With the increase of shear rate, the particles in the fluid would squeeze the solvent layer faster and contact and collide with each other. The final aggregates of particle clusters would be larger. The results show (Fig. 9) that for SPC/PEG fluids with SPC-1, SPC-2 and SPC-3 as dispersion phases, their critical shear rate decreased and peak viscosity increased in turn. SPC-4, SPC-5 and SPC-6 corresponding to X, Y and Z models also had the same rule. The critical shear rate of fluid composed of SPC-6 with the most complex structure was the smallest and the peak viscosity was the largest.
Fig. 9 also compares the effect of the difference in molecular weight of PEGDGE on SPC/PEG fluids. The hydrogen bond network structure formed by simple particle clusters and dispersion medium was more likely to be destroyed with the increase of shear rate. After reaching the critical thickening point, the friction contact network structure formed by agglomeration was simple, and the effect of blocking fluid flow was not significant. For the two SPCs of the same model, although their structural shapes were similar, the increase in PEGDGE molecular weight would increase the length of polyether long chain in the particle cluster, resulting in the aggregates of particle clusters being more complex and easier to form due to the winding effect. Therefore, the shear thickening effect of the fluid would increase, and the shear thinning effect before the critical shear thickening point would gradually weaken. The fluid composed with SPC-6 did not even undergo a shear thinning phenomenon. The viscosity gradually increased from 288.10 Pa s to 833.30 Pa s when the shear rate increased from 0.10 s−1 to 88.30 s−1.
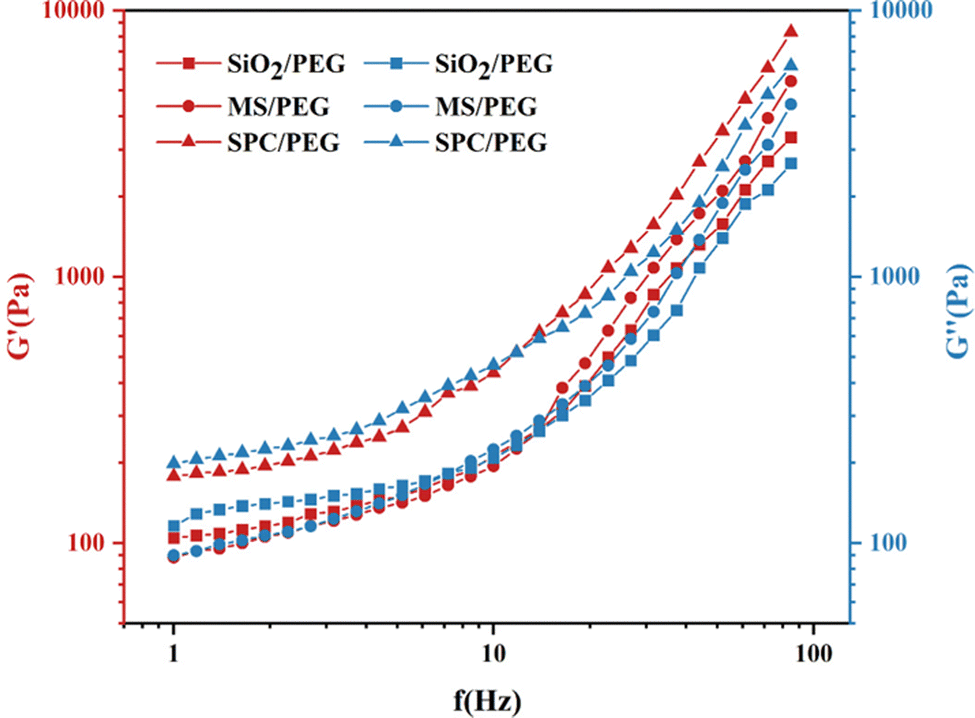 | ||
| Fig. 11 The relationship curves of G′ and G′′ with shear frequency for fluid systems of SiO2/PEG, MS/PEG and SPC/PEG. | ||
As shown in Fig. 11, the curves of G′ and G′′ of the SiO2/PEG fluid, MS/PEG fluid and SPC/PEG fluid with frequency were similar. The G′ and G′′ of the three fluids increased slowly and then increased sharply with the shear frequency. At low frequencies, the G′′ of the fluid was higher than G′, indicating that the fluid was dominated by viscous properties. With the increase of frequency, the hydrodynamic force overcame the repulsion between particles to promote the formation of particle cluster aggregates. Therefore, G′ and G′′ of the fluid also increased rapidly, and then G′ exceeded G′′. In this case, the materials showed elasticity. These phenomena indicated that with the increase of frequency, these three fluids tended to gradually change from liquid-like to solid-like. At the same time, the shear properties of different samples were quite different. In the whole frequency scanning range, the G′ of SiO2/PEG only increased by 228.46 Pa, while it increased by 5329.87 Pa and 8111.78 Pa for MS/PEG and SPC/PEG respectively. For SPC/PEG fluid, due to its pre-clustering, a more compact particle agglomeration structure was formed inside the fluid under the stimulation of external high-frequency conditions. Therefore, the storage modulus of the SPC/PEG system was the largest, making the shear hardening performance the strongest.
3.4. Shear thickening process and mechanism of silica particle clusters
The shear thickening process of the fluid composed of SPC was analyzed, as shown in Fig. 12.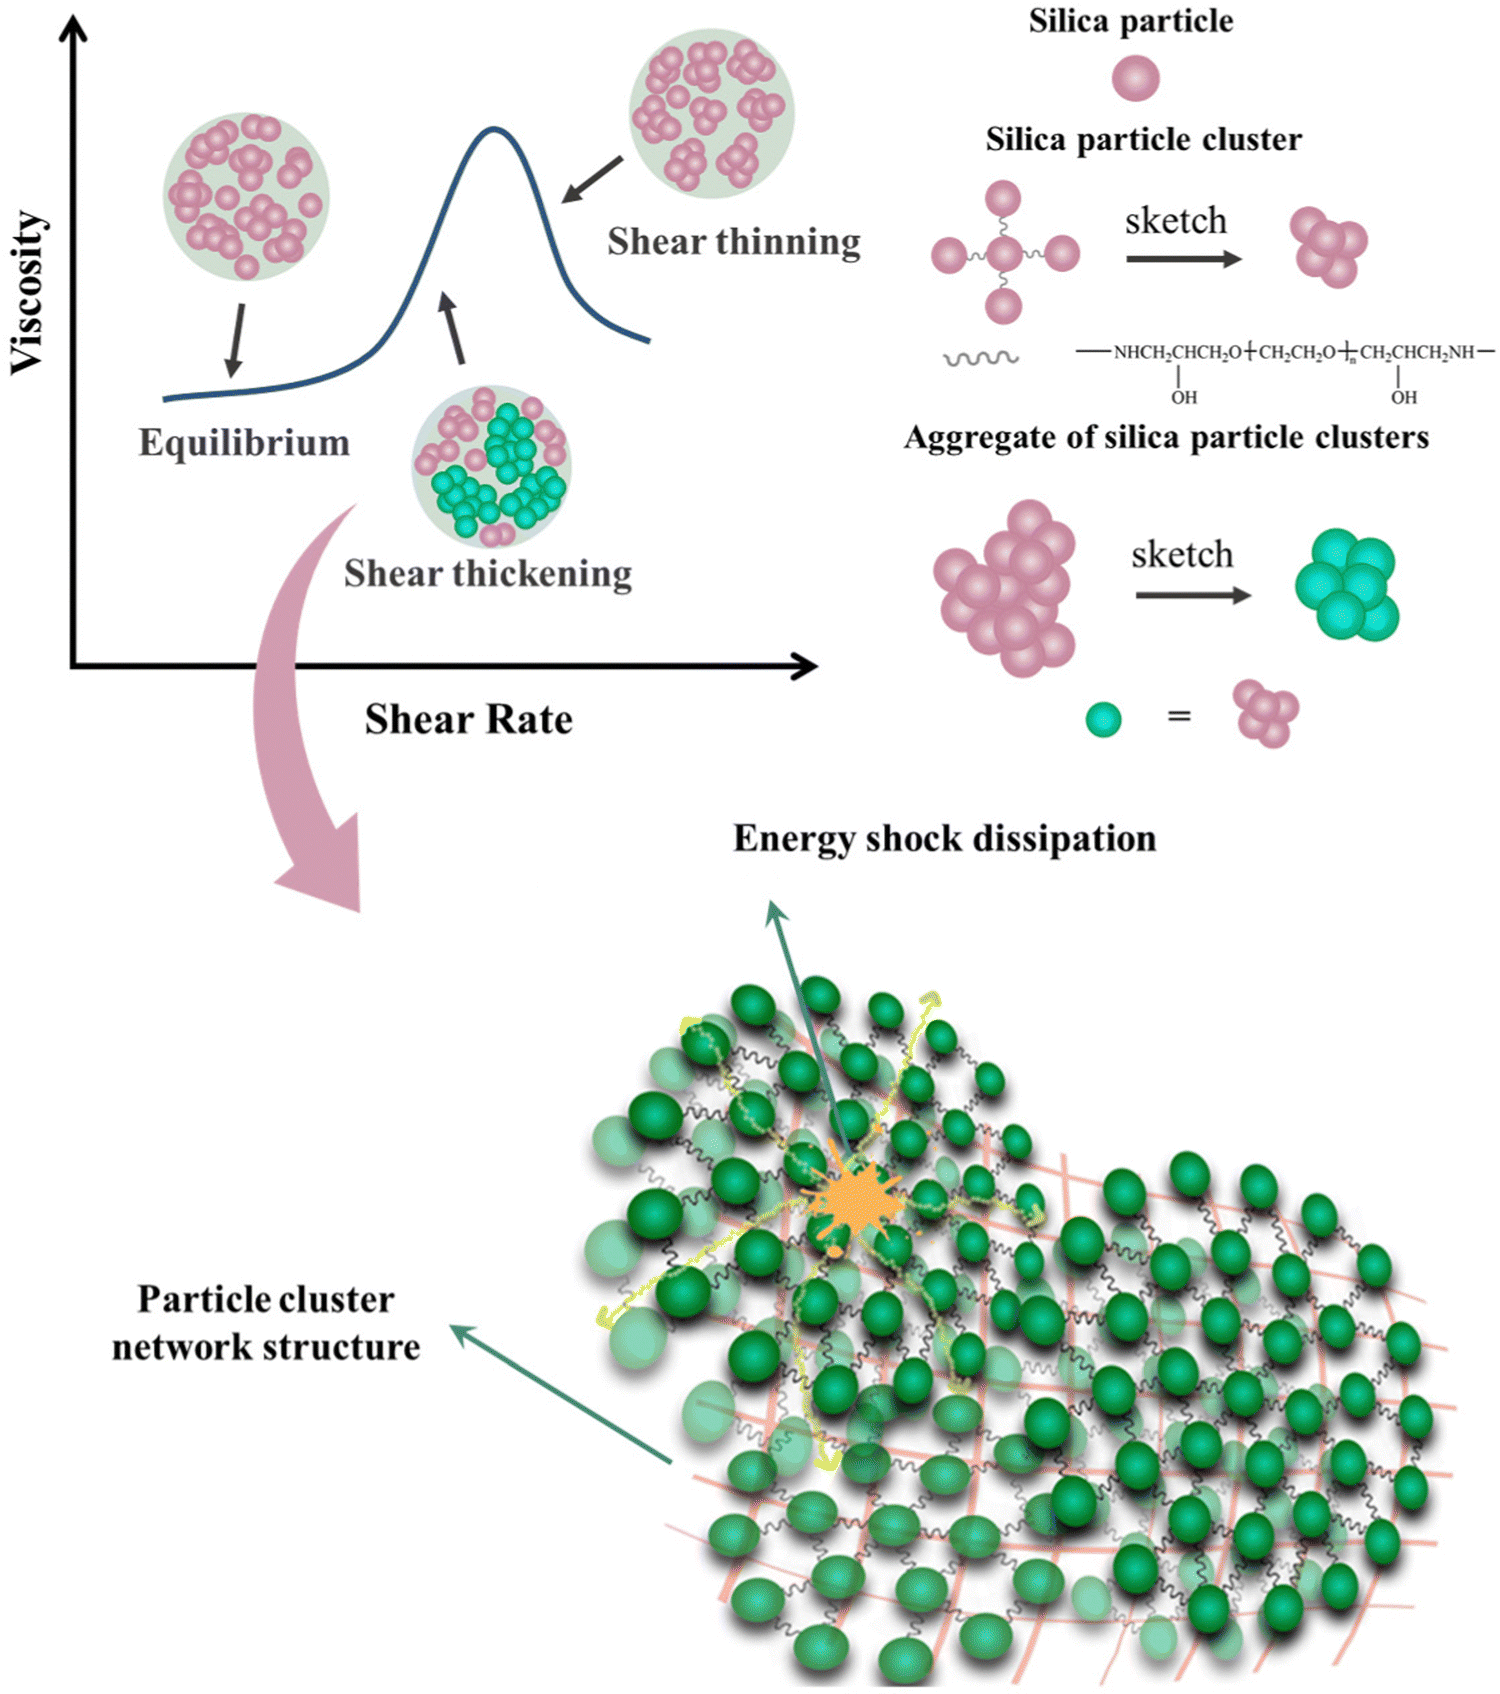 | ||
| Fig. 12 The process of aggregating and shear thickening of particles in the SPC/PEG system. | ||
Unlike the monodisperse particles, the hydroxyl groups on the surface of nano-silica particles in micron-sized SPC were relatively fewer. Nano-silica particles were connected to each other through polyether chains, making it easier to form large particle aggregation structures under certain external forces. Shear thinning was weak or even did not occur under a low shear rate or low frequency conditions. After reaching the critical shear rate, the electrostatic repulsion and Brownian force between particles were completely overcome under the action of external force. The particles continued to aggregate to form a large cluster structure, forming a friction contact network, which reduced the fluidity of the fluid and increased the viscosity instantaneously.
In the fluid, the formation of large-sized particle clusters and the re-aggregation between particle clusters increased the frictional force between the fluid flow layers, increased the ability of the fluid to resist shear deformation, and improved the ability to resist external force impact deformation. The particles in the SPC were connected by long chains of polyether with a certain spatial structure and flexibility. The polyether chains between silica particles had stable chemical properties, and could also provide a certain degree of ductility and flexibility for the particle cluster. The STF system composed of silica particle clusters had a more stable structure of particle aggregates and a more significant thickening effect, which could improve the storage modulus and loss modulus of the system. With the growth of polyether long chains and the extension of network structure, the energy transferred from the outside to the STF system could be more effectively converted into frictional internal energy between particle clusters and dissipated. These extended dendritic structures exhibited superior special shear deformation resistance in STF systems compared to single particle dispersion systems. They could effectively transmit loads, participate in load sharing and energy absorption, and play a role in impact resistance.
4. Conclusion
In this study, different forms of silica particle cluster structure SPC were obtained by ring-opening reaction of different amino-modified silica nanoparticles with PEGDGE. The experimental results indicated that the shear thickening behavior of the fluid could be regulated by controlling the degree of amino modification of nano-silica and the molecular weight of PEGDGE. With the increase of the amino content of the MS particles, the structure of SPC became more complex, resulting in a more significant shear thickening effect of the STF fluid formed with PEG. For MS particles with the same amino content, the molecular weight of PEGDGE did not affect the structural type of SPC, but rather changed the shear thickening behavior of STF by changing the length of the polyether chain inside the particle clusters. The increase in the molecular weight of PEGDGE resulted in longer polyether chains in the particle cluster. The cluster structure composed of particles increased, making it easier for particles to aggregate, thus enhancing the shear thickening effect of the fluid. In addition, the peak viscosity of the SPC/PEG system was higher, reaching 833.30 Pa s, which was 20 times and 8.7 times higher than that of the SiO2/PEG system and MS/PEG system, respectively. The SPC/PEG system also had the highest loss modulus and storage modulus, exhibiting good shear deformation resistance. This study verifies that the rheological behavior of STF systems can be adjusted by changing the chemical properties of silica particles themselves and the interaction relationship between particles, providing a new idea for researchers to design and prepare impact resistant STFs and related applications.Conflicts of interest
There are no conflicts to declare.Acknowledgements
This research did not receive any specific grant from funding agencies in the public, commercial, or not-for-profit sectors.References
- H. A. Barnes, J. Rheol., 1989, 33, 329–366 CrossRef CAS.
- Y. S. Lee and N. J. Wagner, Rheol. Acta, 2003, 42, 199–208 CrossRef CAS.
- W. H. Boersma, J. Laven and H. N. Stein, AIChE J., 1990, 36, 321–332 CrossRef CAS.
- S. Gürgen, M. C. Kuşhan and W. Li, Prog. Polym. Sci., 2017, 75, 48–72 CrossRef.
- S. R. Waitukaitis and H. M. Jaeger, Nature, 2012, 487, 205–209 CrossRef CAS PubMed.
- R. Zurowski, P. Falkowski, J. Zygmuntowicz and M. Szafran, Materials, 2021, 14, 6585 CrossRef CAS PubMed.
- S. Gürgen and T. Yıldız, Compos. Struct., 2020, 235, 111812 CrossRef.
- A. Khodadadi, G. Liaghat, S. Vahid, A. R. Sabet and H. Hadavinia, Composites, Part B, 2019, 162, 643–652 CrossRef CAS.
- X. Zhang, T.-T. Li, Z. Wang, H.-K. Peng, C.-W. Lou and J.-H. Lin, Prog. Org. Coat., 2021, 151, 106088 CrossRef CAS.
- K. Lin, H. Liu, M. Wei, A. Zhou and F. Bu, Smart Mater. Struct., 2019, 28, 025007 CrossRef CAS.
- M. Li, B. Lyu, J. Yuan, W. Yao, F. Zhou and M. Zhong, Int. J. Mach. Tools. Manuf., 2016, 108, 113–126 CrossRef.
- M. Li, B. Karpuschewski, H. Ohmori, O. Riemer, Y. Wang and T. Dong, Int. J. Mach. Tools. Manuf., 2021, 160, 103651 CrossRef.
- K. Liu, C.-F. Cheng, L. Zhou, F. Zou, W. Liang, M. Wang and Y. Zhu, J. Power Sources, 2019, 423, 297–304 CrossRef CAS.
- G. M. Veith, B. L. Armstrong, H. Wang, S. Kalnaus, W. E. Tenhaeff and M. L. Patterson, ACS Energy Lett., 2017, 2, 2084–2088 CrossRef CAS.
- M. Zarei and J. Aalaie, J. Mater. Res. Technol., 2020, 9, 10411–10433 CrossRef.
- J. F. Brady and G. Bossis, J. Fluid Mech., 1985, 155, 105–129 CrossRef.
- G. Bossis and J. F. Brady, J. Chem. Phys., 1989, 91, 1866–1874 CrossRef CAS.
- M. Wei, K. Lin and L. Sun, Mater. Des., 2022, 216, 110570 CrossRef CAS.
- X. Gong, Y. Xu, W. Zhu, S. Xuan, W. Jiang and W. Jiang, J. Compos. Mater., 2013, 48, 641–657 CrossRef.
- X. Feng, S. Li, Y. Wang, Y. Wang and J. Liu, Mater. Des., 2014, 64, 456–461 CrossRef CAS.
- M. Yu, X. Qiao, X. Dong and K. Sun, Colloid Polym. Sci., 2018, 296, 1119–1126 CrossRef CAS.
- R. Wei, B. Dong, F. Wang, J. Yang, Y. Jiang, W. Zhai and H. Li, J. Appl. Polym. Sci., 2020, 137, 48809 CrossRef CAS.
- S. Gürgen and M. C. Kuşhan, Polym. Test., 2017, 64, 296–306 CrossRef.
- P. Nakonieczna-Dąbrowska, R. Wróblewski, M. Płocińska and M. Leonowicz, Mater., 2020, 13, 3870 CrossRef.
- F.-F. Wang, Y. Zhang, H. Zhang, L. Xu, P. Wang and C.-B. Guo, RSC Adv., 2018, 8, 5268–5279 RSC.
- S. Gürgen, M. A. Sofuoğlu and M. C. Kuşhan, Smart Mater. Struct., 2019, 28, 035027 CrossRef.
- M. Zabet, K. Trinh, H. Toghiani, T. E. Lacy, C. U. Pittman, Jr. and S. Kundu, ACS Omega, 2017, 2, 8877–8887 CrossRef CAS PubMed.
- T. A. Prabhu and A. Singh, Rheol. Acta, 2021, 60, 107–118 CrossRef CAS.
- A. Katiyar, T. Nandi, P. Katiyar, P. Dhar and N. E. Prasad, Soft Matter, 2019, 15, 2092–2102 RSC.
- W. Yang, Y. Wu, X. Pei, F. Zhou and Q. Xue, Langmuir, 2017, 33, 1037–1042 CrossRef CAS.
- M. Yu, X. Qiao, X. Dong and K. Sun, Colloid Polym. Sci., 2018, 296, 1767–1776 CrossRef CAS.
- K. Talreja, I. Chauhan, A. Ghosh, A. Majumdar and B. S. Butola, RSC Adv., 2017, 7, 49787–49794 RSC.
- S. K. Sahoo, S. Mishra, E. Islam and L. Nebhani, Mater. Today Commun., 2020, 23, 100892 CrossRef CAS.
- C. Wang, F. Xu, M. He, L. Ding, S. Li and J. Wei, Polym. Compos., 2018, 39, E1800–E1806 CAS.
- H. Wang, X. Li, X. feng, Y. Liu, W. Kang, X. Xu, X. Zhuang and B. Cheng, J. Solid State Electrochem., 2018, 22, 3475–3484 CrossRef CAS.
- R. Zhou, Y. Jiang, H. Zhao, B. Ye, L. Wang and Z. Hou, Fuel, 2021, 291, 120207 CrossRef CAS.
- H. Zhang, D. Ke, L. Cheng, X. Feng, X. Hou, J. Wang, Y. Li and S. Han, Prog. Nat. Sci.: Mater. Int., 2019, 29, 1–9 CrossRef CAS.
- W. Yan, Z. Zhang, X. Guo, W. Liu and Z. Song, ECS J. Solid State Sci. Technol., 2015, 4, P108 CrossRef CAS.
- J. Warren, S. Offenberger, H. Toghiani, C. U. Pittman, Jr., T. E. Lacy and S. Kundu, ACS Appl. Mater. Interfaces, 2015, 7, 18650–18661 CrossRef CAS.
| This journal is © The Royal Society of Chemistry 2024 |