 Open Access Article
The effect of functional groups on the glass transition temperature of atmospheric organic compounds: a molecular dynamics study†
Panagiota
Siachouli
ab,
Katerina S.
Karadima
 ab,
Vlasis G.
Mavrantzas
 *abc and
Spyros N.
Pandis
 *ab
*ab
aDepartment of Chemical Engineering, University of Patras, Patras, GR 26504, Greece. E-mail: vlasis@chemeng.upatras.gr; spyros@chemeng.upatras.gr
bInstitute of Chemical Engineering Sciences (ICE–HT/FORTH), Patras, GR 26504, Greece
cParticle Technology Laboratory, Department of Mechanical and Process Engineering, ETH Zürich, CH-8092 Zürich, Switzerland
First published on 28th May 2024
Abstract
Organic compounds constitute a substantial part of atmospheric particulate matter not only in terms of mass concentration but also in terms of distinct functional groups. The glass transition temperature provides an indirect way to investigate the phase state of the organic compounds, playing a crucial role in understanding their behavior and influence on aerosol processes. Molecular dynamics (MD) simulations were implemented here to predict the glass transition temperature (Tg) of atmospherically relevant organic compounds as well as the influence of their functional groups and length of their carbon chain. The cooling step used in the simulations was chosen to be neither too low (to supress crystallization) nor too high (to avoid Tg overprediction). According to the MD simulations, the predicted Tg is sensitive to the functional groups as follows: carboxylic acid (–COOH) > hydroxyl (–OH) and (–COOH) > carbonyls (–C![[double bond, length as m-dash]](https://www.rsc.org/images/entities/char_e001.gif) O). Increasing the number of carbon atoms leads to higher Tg for the linearly structured compounds. Linear compounds with lower molecular weight were found to exhibit a lower Tg. No clear correlation between O
O). Increasing the number of carbon atoms leads to higher Tg for the linearly structured compounds. Linear compounds with lower molecular weight were found to exhibit a lower Tg. No clear correlation between O![[thin space (1/6-em)]](https://www.rsc.org/images/entities/char_2009.gif) :
:![[thin space (1/6-em)]](https://www.rsc.org/images/entities/char_2009.gif) C and Tg was observed. The architecture of the carbon chain (linear, or branched, or ring) was also found to impact the glass transition temperature. Compounds containing a non-aromatic carbon ring are characterized by a higher Tg compared to linear and branched ones with the same number of carbon atoms.
C and Tg was observed. The architecture of the carbon chain (linear, or branched, or ring) was also found to impact the glass transition temperature. Compounds containing a non-aromatic carbon ring are characterized by a higher Tg compared to linear and branched ones with the same number of carbon atoms.
1. Introduction
Atmospheric organic particulate matter contains tens of thousands of complex compounds exhibiting an array of functionalities such as alcohols, carboxyl groups, ketones, etc.1,2 The existence of glassy,3–5 semi-solid6,7 and liquid8–11 organic aerosols has been widely reported sparking interest in understanding their phase state in various atmospheric conditions. The phase state of particles affects a variety of related atmospheric physicochemical processes such as their ice nucleation ability, water uptake, heterogeneous chemistry, oxidation kinetics, etc.2,12,13The phase state of organic compounds can be inferred indirectly by examining their glass transition temperature (Tg). However, determining the Tg of the thousands of atmospheric organic aerosol components is a daunting task. The first definition of Tg was proposed by Tammann14 in the early ‘30s suggesting that the glass transition is the temperature at which brittleness disappears.15 Some studies suggest that it can be determined indirectly via viscosity, with Tg being defined as the temperature at which the zero shear rate viscosity reaches the value of 1012 Pa s.15–17 In some other studies, Tg is defined as the temperature of the intersection of the liquid and vitreous portions of the specific volume versus temperature curve.16 Another problem that arises is the disagreement regarding the nature of the glass transition. Some studies assume that the glass transition is a first-order phase transition while others suggest that its nature is kinetic, a view that is the most widely accepted nowadays.5,15
Despite the difficulty of understanding the fundamentals of Tg, it remains a key property of atmospheric aerosols.18 The discrepancies of measurements and predictions are vast across the scientific literature15 and there are even cases in which the methodology to determine Tg is not explained in detail causing difficulties in reproducing or verifying the results.15,19,20 Moreover, the synthesis and purification of atmospheric organic aerosol components is challenging.21–23 There have been several experimental studies on the Tg determination of organic compounds and their mixtures5,23,24 as well as predictions based on parametrizations.25–27 Semi-empirical equations such as the Gordon–Taylor equation28 are widely used to predict the Tg of mixtures2,27,29 even though this approach has been reported to fail frequently.2 Koop et al. (2011) created a big database of glass transition temperatures for organic compounds2 and implemented the semi-empirical Boyer–Kauzmann rule30 which relates the glass transition temperature to the melting point through a proportionality constant g, namely, Tg = gTm, with the value of g varying between 0.5 and 0.8.16,30,31 For several polymers as well as organic and inorganic compounds, a value of g equal to 0.7 is widely used.32,33 Koop et al. (2011) used the Boyer–Kauzmann rule in a dataset of Tg and Tm values and found good correlation (R2 = 0.955) using g = 0.7 for the organic compounds. Using such a rule to obtain Tg requires only knowledge of the melting temperature which is readily available.34–38 In a recent study, Galeazzo and Shiraiwa (2022)39 proposed predicting Tg through machine learning by implementing molecular embeddings providing details on molecular structure, functionality, molecular length, etc. Armeli et al. (2023) have also introduced a machine learning approach to determine the glass transition temperature of organic compounds containing carbon, hydrogen, oxygen, nitrogen, and halogen atoms, based on molecule-derived properties.40 They implemented two approaches, one using as input the number of selected functional groups present in the compound, and another generating descriptors from a simplified molecular input line entry system (SMILES) string. Results from the two approaches showed a similar mean absolute error of about 12–13 K, with the SMILES-based method performing slightly better.
In this work, we exploit the power of molecular dynamics (MD) simulations to predict the glass transition temperature of atmospherically relevant organic compounds starting directly from their chemical composition and architecture. Since the study of the glass transition temperature as well as the synthesis of the organic compounds are challenging in an experimental environment, the implementation of MD provides an alternative and quite friendly way as they can offer reliable predictions of the key physicochemical properties of materials in soft matter41,42 with relatively low cost compared to actual experiments. Considering, in particular, recent progress in obtaining accurate parameterizations of experimentally verified force fields, the method can be thought of as providing an exact solution to the corresponding statistico-mechanical problem compared to approximate solutions or empirical correlations accounting in a mechanistic way for details of molecular structure, the presence of functional groups and their position along the molecule. It has been used very successfully to predict Tg in polymers;43 however, and to the best of our knowledge, this is one of the very first efforts that atomistic MD simulations are utilized to predict Tg of atmospherically relevant organic compounds. Combined with advances in force-field development for complex liquids, our scope is to use the method as a powerful predictive tool for correlating the detailed molecular structure and inter-atomic interactions with the Tg, thus outperforming other methods which, despite the use of vectorized molecular descriptors and variability, fail to perform well when they are applied to other more complex molecules beyond those for which they were used to derive the corresponding correlation. For example, as will be discussed later in this work, the MD simulations predict that the Tg is highly sensitive not only to the nature and number of functional groups present in the molecule but also to their exact location within the molecule; moreover, the Tg is sensitive to the detailed molecular architecture of the compound (linear versus branched or ring-like). MD is the ideal tool to capture all these fine dependencies, since the corresponding computational experiment plays the role of a virtual laboratory in which understanding is achieved by monitoring microscopic dynamics and behaviour as precisely and accurately as possible.
The compounds chosen in this study are based on their atmospheric relevance as well as on the availability of experimental data for the evaluation of the simulation predictions. We focus on the effect of functional groups, carbon chain length, O![[thin space (1/6-em)]](https://www.rsc.org/images/entities/char_2009.gif) :
:![[thin space (1/6-em)]](https://www.rsc.org/images/entities/char_2009.gif) C ratio, molecular weight, and type of structure on Tg. We also explore and address some important methodological issues, such as the effect of the cooling step and the number of independent simulations needed to reliably estimate Tg considering that the simulated organic compounds have crystallization points that lie between the highest and lowest temperatures spanned in the course of the cooling MD runs for determining Tg.
C ratio, molecular weight, and type of structure on Tg. We also explore and address some important methodological issues, such as the effect of the cooling step and the number of independent simulations needed to reliably estimate Tg considering that the simulated organic compounds have crystallization points that lie between the highest and lowest temperatures spanned in the course of the cooling MD runs for determining Tg.
2. Methodology
2.1 MD approach for Tg prediction
Our MD protocol to predict Tg entails the following steps: (1) choice of the force field, systems preparation and equilibration, (2) execution of cooling runs in the isothermal–isobaric statistical ensemble using an appropriate cooling step, and (3) post-processing and analysis of the accumulated trajectories to compute specific observables and monitor their temperature variation to extract the glass transition temperature. In step 1, initial configurations were generated for all compounds of interest in this work, by using the materials and processes simulations platform (MAPS).44 We included 2000 molecules in a cubic simulation box whose initial size was estimated based on the density of the organic compound at ambient temperature and pressure. The all-atom OPLS (optimized potentials for liquid simulations, OPLS-AA)44 force field was implemented and the platform LigParGen45,46 was used as an OPLS parameter generator (mentioned LigParGen OPLS or similarly hereinafter). OPLS is one of the most widely used force fields45 for small organic molecules, proteins and nucleic acids, and it is being improved and updated continuously over the years by its developers (research team of Prof. William L. Jorgensen), with the most recent release being the OPLS/202046 one based on the full set of parameters as proposed by Jorgensen et al.47 Before this version, the developers had provided the LigParGen web server,48 which allows for the generation of OPLS parameters, including corrected atomic charges,49 to improve the reproducibility of experimental properties. The importance of electrostatic interactions in MD simulations is widely recognized, especially in cases where polarization effects are present.50 An approach often referred to as non-bonded fix (NBfix), proposed for overcoming the overestimations of solute–solute interactions observed in aqueous solutions of carbohydrates by typical force fields such as OPLS and CHARMM36 etc., includes scaling (with different factors) of the Lennard-Jones energy parameters and atomic charges.51,52 In the past, other OPLS-AA versions had also been proposed (independently from the updates provided by its developers) to correct for problems observed with the prediction of properties for small organic molecules in the liquid phase or for quite long hydrocarbons (L-OPLS).53–55 Further OPLS modifications for specific organic molecules and functional groups or properties have also appeared in the literature,56–58 but, in general, the above mentioned modifications do not involve molecule-based atomic charges such as the ones provided by the LigParGen web server.47In the present study, we employed the OPLS version based on the LigParGen platform45,46 for defining the OPLS bonded and Lennard-Jones non-bonded parameters, as well as the atomic charges. The latter were not treated as transferable parameters (unlike the typical practice in the field) but for every single molecule examined here they were provided separately by the LigParGen platform.45,46 The atomic charges generated by the web server45,46 were thoroughly validated by test simulations with two test molecules, octane and 1,2,6-hexanetriol, for which several experimental properties are available. Furthermore, these molecules belong to the two wider categories of linear alkanes and alcohols, respectively, for which modifications to the OPLS force field were deemed necessary over the years. Apart from the two OPLS versions (classical OPLS and LigParGen OPLS), the OPLS NBFix version and as well as the one described by Damm et al.59 were also examined. LigParGen OPLS was the one which reproduced most adequately experimental properties such as the density, the viscosity and the diffusivity of the examined liquids, followed next by the OPLS NBFix and then by the typical OPLS force field, with the Damm et al.59 version performing the least satisfactorily. The LigParGen OPLS version was further compared to the L-OPLS version which has been reported to handle even more adequately the crystallization of liquid alcohols at ambient temperatures.53,54 The simulations included the calculation of Tg for 1-hexanol following the protocol adopted in this work (see ESI,† Section S1 and Table S1). The simulations indicated similar Tg predictions between the LigParGen OPLS version and the L-OPLS one, with the values from L-OPLS being slightly higher. Further validation was performed by comparing densities of a few compounds to the available experimental ones (see ESI,† Fig. S1). Most of the predicted densities were within 1% the experimentally measured values; however, we should keep in mind that OPLS-AA has been optimized around standard conditions, thus the accuracy of the force field at much lower temperatures (and correspondingly higher densities) should not be taken for granted a priori.
Following the choice and validation of the force field, the next step was to equilibrate each system at a high enough temperature (above the melting point) to come up with a representative system configuration for the subsequent simulations. The equilibration was confirmed by examining the evolution of density and time autocorrelation function of the end-to-end distance vector of the molecule under consideration. All simulations were conducted using cubic simulation cells subject to periodic boundary conditions along all three space directions. The isothermal–isobaric (NpT) statistical ensemble was chosen with the help of the Nosé–Hoover thermostat-barostat60 and the velocity-Verlet algorithm61 for the integration of the equations of motion with a time step equal to 1 fs. The simulations were conducted using the open-source large-scale atomic/molecular massively parallel simulator (LAMMPS).62 In the final step of our approach, we chose a temperature range that was relevant for each compound (based on reported or estimated melting temperatures) and conducted simulation runs on the order of 2 ns at each temperature before stepwise reducing it by 20 K and initiating the next simulation run.
A change of slope in the density versus temperature curve was detected in most of the MD simulations with almost all compounds examined. This change (which was particularly evident in the case of the linear alcohols) was close to the experimental melting point of the simulated organic compound, suggesting that upon cooling, the employed force field was accurate enough to simulate crystallization (spontaneous phase transition from a purely amorphous and isotropic structure to a highly ordered one). Given that the glass transition phenomenon refers to kinetic arresting of the pure amorphous phase, we had to supress density variations in the simulation cell due to incipient nucleation and crystallization at temperatures in the vicinity of the crystallization point. To this, we performed new relaxation runs slightly above the crystallization temperature and started performing relatively fast cooling runs from that temperature down for the determination of Tg. After experimenting with several cooling steps, we found that the lowest cooling rate for which the tendency for self-assembly or local ordering (thus, also for crystallization) is suppressed for almost all compounds studied here is around 20 K per 2 ns, and this was chosen as the basis for Tg determination. We also mention here that for cooling rates higher than that, as the cooling rate decreased, the estimated Tg was also found to decrease, which agrees with our expectations. Once the temperature range of interest was spanned with the above cooling rate, new simulations were conducted starting from a totally different initial configuration and the process was repeated. We averaged over 3 configurations to get reliable predictions of Tg. By “totally different” initial configuration, we mean a “statistically independent” configuration, in the sense that the starting structure was taken from a very distant point along the accumulated MD trajectory compared to the previous one, at a high enough temperature for which complete decorrelation of the system was not a problem.
To obtain Tg, there is a variety of properties that one can monitor as a function of temperature. It is common to use volumetric, mechanical as well as structural properties for its determination. These properties usually include the density, the radial distribution function, the non-bonded energy, the specific volume, the modulus of elasticity, etc.63 Here we chose to compute Tg based on the density, which is the most commonly selected property for the prediction,18,63 and the potential energy of the system due to non-bonded interactions. We note here that the density, in particular, is a physical quantity (an observable) which equilibrates quite fast in MD (within a few ns or a few tens of ns) even at very low temperatures. In both cases, to determine Tg, the property is monitored, and its values are analysed as a function of temperature. The glass transition is identified as the point of intersection of the bilinear fit applied to the data (see ESI,† Section S2) before and after the change in the slope of the curve. To find the optimal bilinear fit for each set of data, we split them into two different linear fits. We detect first at which point the properties of interest exhibit an abrupt change in their mean value. Then, we try fitting the data well before and well after that point and ultimately choose the optimal combination based on the R2 of the two lines. An example of the procedure can be found in ESI† (Section S3).
2.2 Systems examined
The organic compounds chosen varied in terms of molecular architecture (linear versus non-linear), length of carbon chain, and type and number of functional groups present. The selection aimed at evaluating first our MD-based methodology for predicting the Tg against experimental data, before applying it next to several organic compounds of atmospheric interest.In the group of linearly structured compounds we selected linear alcohols (because of readily available experimental data) and acids. Initially, we examined alcohols having three carbon atoms along their main backbone: 1-propanol and 2-propanol (containing 1 hydroxyl group), 1,2-propanediol and 1,3-propanetriol (containing 2 hydroxyl groups), and 1,2,3-propanetriol (containing 3 hydroxyl groups). Next, and in order to investigate the effect of the length of the carbon chain, we examined compounds with 6 carbon atoms on the main chain: 1-hexanol (containing 1 hydroxyl group), 1,6-hexanediol (containing two hydroxyl groups) and 1,2,6-hexanetriol (containing three hydroxyl groups). In another series of simulations, we investigated the impact of the number of carboxyl groups present for compounds containing 1 up to 6 carbon atoms along their main backbone and several carboxyl groups. More specifically, we simulated propionic acid (3 carbon atoms, 1 carboxyl group), malonic acid (3 carbon atoms, 2 carboxyl groups), hexanoic acid (6 carbon atoms, 1 carboxyl group), adipic acid (6 carbon atoms, 2 carboxyl groups) and tricarballylic acid (6 carbon atoms, 3 carboxyl groups).
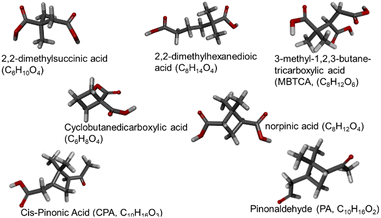
Two categories of non-linear compounds were investigated: (a) with branches in their main carbon chain and (b) with non-aromatic carbon rings (Fig. 1). The branched category contains 2,2-dimethylsuccinic acid (2 carboxyl groups, 6 carbon atoms), 2,2-dimethylhexanedioic acid (2 carboxyl groups, 8 carbon atoms) and 3-methyl-1,2,3-butanetricarboxylic acid or MBTCA (3 carboxyl groups, 8 carbon atoms). The examined compounds that have carbon rings are cyclobutanedicarboxylic acid (2 carboxyl groups, 6 carbon atoms), norpinic acid (2 carboxyl groups, 8 carbon atoms), pinonaldehyde or PA (2 ketone groups, 10 carbon atoms) and cis-pinonic acid or CPA (1 ketone group and one carboxyl group, 10 carbon atoms). All the larger compounds have been detected in atmospheric particles.
2.3 Effect of cooling step
The cooling step is important in both experimental23,29 and modelling studies64 of Tg, since the glass transition temperature is sensitive to the material's thermal history.15 Different cooling steps will most likely lead to different Tg predictions. It is known29,65 that the higher the cooling step the higher the value of Tg measured. In our simulations, in some cases we found the opposite behaviour, i.e., that higher cooling steps led to slightly lower predicted Tg values (see Table S2 of the ESI†). We examined this issue further and as already mentioned in Section 2.1, we realized that it had to do with the fact that the compounds examined here have crystallization points that fall within the regime of temperatures spanned in the course of the MD cooling runs. We discovered that by decreasing the cooling step below a certain rate, molecules in the simulation cell are given the time needed to self-assemble locally forming small nuclei that can initiate crystallization; these nuclei are characterized by higher density values than the amorphous regions in the simulation cell, and this can lead next to a fictitious Tg.30 At the same time, this was also a sign that the employed force field is quite accurate, since it can follow the corresponding phenomenon (crystallization) quite closely. This observation is different from that reported in ref. 55 where premature crystallization was observed at temperatures many degrees above the experimental melting temperatures, and which was circumvented by the authors by adopting a hybrid force field (L-OPLS for the hydrocarbon tail and the original OPLS-AA for the hydroxyl head group). Given that Tg refers to the transition from the pure amorphous phase to a kinetically arrested one, special attention was therefore placed in our work here to identify the lowest cooling step for which crystallization is suppressed. As already mentioned above, this was determined by trial-and-error and was 20 K per 2 ns (see also ESI,† Section S4).2.4 Dependency on the initial configuration
The Tg for each molecular system was estimated by repeating the cooling MD runs with three different independent configurations. There were no significant changes in the average value of Tg upon further sampling. More results about the variation of the predicted Tg as a function of initial configuration can be found in the ESI† (Section S5).3. Results and discussion
3.1 MD-predicted Tg values
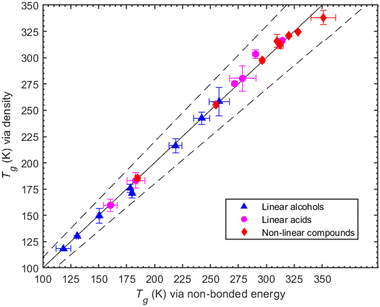
To illustrate our method, we use as an example the determination of Tg for MBTCA. For this system, the MD-obtained density versus temperature curve is reported in Fig. S2 (ESI†). The MD-predicted Tg values for all compounds studied in this work (obtained based on the variation with temperature of either the density or of the non-bonded potential energy) are shown in Table 1. The two values are consistent as they differ only by a few degrees while, overall, the results of the two methods differ by less than 7% (Fig. 2). Of interest in the MD data reported in Fig. 1 and Table 1 is the small size of the error bars. The reason for this two-fold: first, at each temperature, the density is quite-well equilibrated, thus the uncertainty in the corresponding average value is quite small (less than about 3%). This also implies small uncertainties in the fitting procedure used to determine Tg. Second, we observed that MD simulations that were started from completely different (statistically uncorrelated) initial configurations produced practically similar density-vs.-temperature curves. One the other hand, if we compare results from different cooling rates (see, e.g., Table S2 in the ESI†), we observe differences up to 6.5 K. The error bars reported in this work have been obtained by analysing the Tg predictions from the three different initial configurations utilized for each system. In the third column of Table 1, we also report some experimentally measured Tg values. When more than one Tg value is reported there, we provide the mean value and the standard deviation as found in Rothfuss et al. (2017).13 The symbol N/A in the same Table indicates that no value (to the best of our search) was found.| Organic compound | T g (K) | ||
|---|---|---|---|
| Based on density | Based on non-bonded potential energy | Experimental | |
| 1-Propanol | 118.2 ± 0.4 | 118.5 ± 6.5 | 100 ± 713 |
| 2-Propanol | 130.2 ± 0.4 | 130.9 ± 1 | 119 ± 413 |
| 1-Hexanol | 149.6 ± 7.1 | 150.7 ± 0.8 | 134 ± 1113 |
| 1,2-Propanediol | 171.2 ± 4.6 | 180 ± 0.5 | 170 ± 313 |
| 1,3-Propanediol | 175.9 ± 3.8 | 178.4 ± 0.3 | 148 ± 813 |
| 1,6-Hexanediol | 242.4 ± 5.7 | 242.2 ± 7.1 | N/A |
| 1,2,3-Propanetriol | 216.2 ± 6.5 | 218.9 ± 5.8 | 189 ± 713 |
| 1,2,6-Hexanetriol | 258.3 ± 13.4 | 271.7 ± 0.6 | 204 ± 613 |
| Propionic acid | 159.6 ± 5.9 | 160.6 ± 6.2 | N/A |
| Hexanoic acid | 183.2 ± 7.2 | 183.3 ± 8 | N/A |
| Malonic acid | 275.3 ± 2 | 271.7 ± 0.6 | N/A |
| Adipic acid | 280.2 ± 12.2 | 278.8 ± 11.9 | N/A |
| Suberic acid | 303.4 ± 4.1 | 290.5 ± 0.7 | N/A |
| Tricarballylic acid | 316.2 ± 1.1 | 314.2 ± 0.5 | N/A |
| 2,2-Dimethylsuccinic acid | 309.7 ± 3.6 | 312.3 ± 2.7 | N/A |
| 2,2-Dimethylhexanedioic acid | 297.3 ± 1.7 | 296.5 ± 1.4 | N/A |
| Cyclobutanedicarboxylic acid | 315.9 ± 6.2 | 309.5 ± 0.6 | N/A |
| Norpinic acid | 320.7 ± 0.7 | 320.4 ± 1 | N/A |
| cis-Pinonic acid | 255.1 ± 2.2 | 255 ± 0.9 | N/A |
| Pinonaldehyde | 185.1 ± 1.9 | 184.7 ± 2.2 | N/A |
| 3-Methyl-1,2,3-butanetricarboxylic acid | 338.7 ± 6.7 | 351.2 ± 11.1 | 305 ± 223 |
3.2 Evaluation of the results of the MD simulations
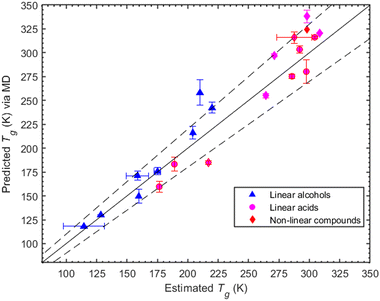
Here we investigate the consistency of our predictions with the Boyer–Kauzmann rule using a collection of melting temperatures available for the organic compounds of interest (see ESI,† Section S6). The MD-predicted Tg values are based on the density measurements and are within 10% of the estimated Tg values. The list of melting point temperatures used for the Boyer–Kauzmann rule predictions can be found in Table S3 (ESI†). The value of the g constant was chosen to be equal to 0.7, which appears to be a good choice for organic compounds.32,33 In Fig. 4, a comparison between predicted Tgvia MD simulations and estimated Tgvia the Boyer–Kauzmann rule is shown. An interesting case appears for 1,6-hexanediol where the MD prediction is 242.4 K while the Boyer–Kauzmann rule gives 220 K. Overall, the above comparison indicates that, in the absence of any experimental data, the use of Boyer–Kauzmann rule could provide a rough estimate of Tg.
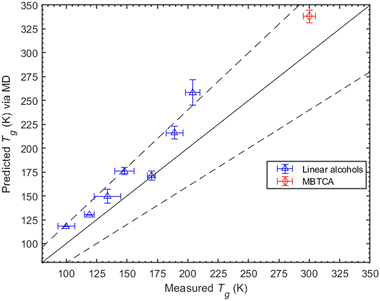
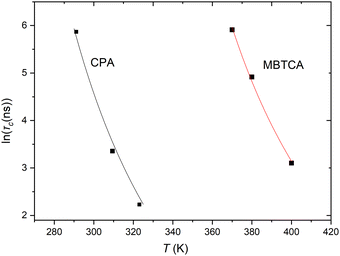
Experimentally, segmental relaxation is probed with techniques such as dielectric spectroscopy, quasi-elastic neutron scattering and nuclear magnetic resonance. In simulations, segmental relaxation is probed by performing MD simulations at progressively lower temperatures, typically less than 100 K above the expected Tg, to obtain the segmental relaxation time τc as a function of temperature and fit the data to the WLF (Williams–Landell–Ferry) equation.70 We opted to utilize this method for the compounds MBTCA and CPA, as they are the only complex atmospherically relevant organic compounds that have been experimentally examined for their Tg or mixtures thereof to the best of our knowledge. To obtain the segmental relaxation time τc, we examined the time autocorrelation function of the unit end-to-end vector along a short segment (typically a side group or a branch) of the molecule. The characteristic segmental relaxation time τc is then obtained by fitting the simulation curve with the Kohlrausch–Williams–Watts (KWW)71 stretch exponential function  where τKWW denotes the characteristic time and β the characteristic stretching component; then, the characteristic relaxation time is obtained analytically as
  . Once the relaxation times have been obtained, the values are fitted with the Williams–Landel–Ferry (WLF) equation,
  , where C1 and C2 are numerical constants equal to 17.44 K and 51.6 K, commonly called global WLF parameters. The results obtained by this procedure can be seen in Fig. 5 where the optimal fits used for the determination of Tg are presented. The predicted Tg value for CPA is 265.1 K and for MBTCA 337.5 K. These are in a good agreement with the methodology of monitoring the density and the non-bonded energy, as the two estimates differ by about 10 K. Note that the finding of Dette et al.23 diverges from this, as the experimental Tg value for MBTCA is reported to be 305 K.
3.3 Effect of functional groups
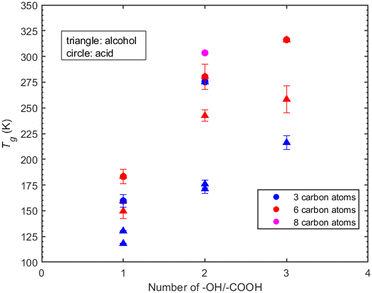
Atmospheric organic particulate matter consists of thousands of complex compounds for many of which there is little or no available information to estimate their Tg. Understanding the effect that specific molecular characteristics (such as the number and type of functional groups and the length of the carbon chain) have on their properties can lead to better understanding and improved prediction approaches. In the following sections we discuss the MD predictions for the effect of various functional groups on the Tg of several of the compounds (linear and branched) studied here.Hydroxyl groups. The compounds examined in this section have been selected based on the number of hydroxyl groups. The corresponding compounds are divided into two groups: the first includes compounds whose chain contains three carbon atoms, namely 1-propanol, 2-propanol, 1,2-propanediol, 1,3-propanediol, 1,2,3-propanetriol. The second group includes compounds whose chain contains six-carbon atoms, namely 1-hexanol, 1,6-hexanediol and 1,2,6-hexanetriol. In the three-carbon atom chain group, the addition of one hydroxyl group increases the Tg by approximately 40 K (Fig. 6). A similar linear trend is observed for the effect of the –OH functional group on viscosity by Rothfuss et al. (2017).13 However, the Tg of 1-propanol and 2-propanol differ by almost 10 K. The difference in their Tg's can be explained by the influence of the position of –OH group within the molecular structure. The position of the –OH group can impact the number of hydrogen bonds formed, thus also the thermodynamic properties around the glass transition regime. A characteristic example is given in the work of Talón et al.72
Similarly, the Tg's of 1,2-propanediol and 1,3-propanetriol differ by approximately 5 K, further emphasizing the impact of the –OH group's position.
In the case of compounds that are six-carbon atoms long, Tg increases as the number of hydroxyl groups present in the molecule increases (Fig. 6). Contrary to the three-carbon chain group, the addition of a second hydroxyl group in a carbon chain length of six atoms, i.e., 1,6-hexanediol, leads to an increase of approximately 110 K in Tg compared to the approximately 40 K increase for 1,2-propanediol and 1,3-propanetriol. The addition of a third hydroxyl group in the six-carbon atom chain results in an increase of 16 K whereas for 1,2,3-propanetriol the increase is almost 40 K. The predicted Tg is systematically higher for compounds with six carbon atoms compared to compounds with three-carbon atoms.
Carboxyl groups. The compounds examined in this section are linear carboxylic acids with one up to three carboxyl groups present as well as three up to eight carbon atoms in the chain length. In the case of three carbon atoms, propionic acid with one –COOH has the lowest predicted Tg. The addition of a second carboxylic group (malonic acid) leads to an increase of Tg by approximately 115 K. Moving on to the case of six carbon atoms, hexanoic acid (1-COOH) has the lowest predicted Tg whereas upon addition of a second carboxylic group there is an increase of almost 100 K (adipic acid). A further increase in Tg is observed in the case of tricarballylic acid (3-COOH) reaching a value of 316.2 K. The increase from a second to a third carboxylic group is not as significant as in the case of hexanoic and adipic acid. Finally, a distinct case is presented for suberic acid (2-COOH and 8-C) for which the predicted Tg is 303.4 K, indicating a difference of only 10 K less than that of tricarballylic acid. This suggests that further addition of carbon atoms in a dicarboxylic acid can increase the glass transition temperature bringing it closer to that of tricarboxylic acid with fewer carbon atoms.
The number of carbon atoms seems to play an important role, however not as prominent as the number of functional groups. Specifically, the compounds containing six carbon atoms have higher Tg compared to those with three carbon atoms. For instance, the Tg of malonic acid (2-COOH and 3-C) differs only by 5 K from that of adipic acid (2-COOH and 6-C), whereas suberic acid (2-COOH and 8-C) shows an almost 25 K difference with adipic acid. The addition of both a hydroxyl and a carboxyl group increase the predicted Tg. However, the Tg seems more sensitive to the addition of carboxyl than hydroxyl groups which can be attributed to the enhanced ability of –COOH to form hydrogen bonds compared to –OH. In Fig. 6, carboxylic acids, regardless of the number of functional groups or carbon atoms, exhibit consistently higher predicted Tg values.
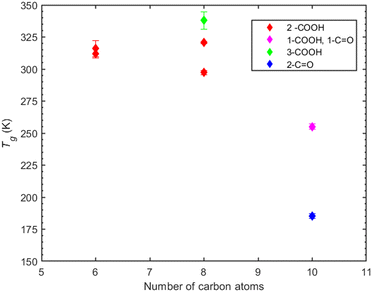
In the case of MBTCA, the effect of multiple carboxyl groups is evident, as there is an abrupt increase in the predicted Tg despite the decrease in the number of carbon atoms to eight. Notably, the structure shifts from a non-aromatic carbon ring (CPA and PA) to branches of carbons.
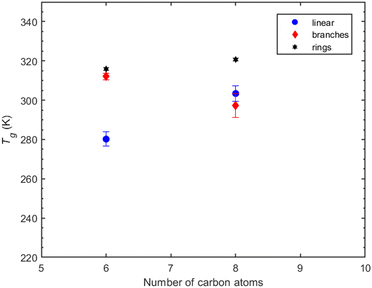
Compounds with 6 carbon atoms (i.e., 2,2-dimethylsuccinic and cyclobutanedicarboxylic acid) are characterized by a higher predicted Tg indicating that not only the functional group but also the molecular structure plays a significant role on Tg. This conclusion is further corroborated by the predicted Tg of norpinic acid (2-COOH) which is the closest one to that of MBTCA (3-COOH).
Suberic acid, with a linear structure and eight carbon atoms, has a predicted Tg that is almost 10 K higher than that of 2,2-dimethyl-hexanedioic acid, which has a branch-like structure with eight carbon atoms. The shift from the linear structure having the lowest Tg at six carbon atoms to surpassing the Tg of the branched structure at eight carbon atoms suggests the need for a more systematic investigation to decipher the effect of branching on Tg.
3.4 Effects of molecular weight and oxygen to carbon ratio
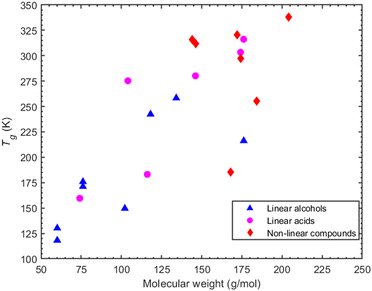
A parameter commonly considered as an indicator of Tg is the molecular weight. The molecular weight of the compounds considered here can be increased: (a) by increasing the carbon atoms, or (b) by increasing the oxygen content which is indicative of the oxidation state of an organic compound. A correlation (R2 = 0.58 for alcohols and R2 = 0.7 for acids -corresponding graphs can be found in ESI,† Section S7) between higher molecular weight and higher Tg can be seen for the linear compounds, i.e., both alcohols and acids (Fig. 9). However, in the case of non-linear compounds there seems to be a complex relationship between predicted Tg and molecular weight. A characteristic example of this is seen in cyclobutanedicarboxylic acid and dimethylsuccinic acid which, despite having a lower molecular weight than PA or CPA, exhibit a higher Tg.The oxygen to carbon ratio (O![[thin space (1/6-em)]](https://www.rsc.org/images/entities/char_2009.gif) :
:![[thin space (1/6-em)]](https://www.rsc.org/images/entities/char_2009.gif) C) indicates the degree of oxygenation of the organic compound and is known to affect Tg.2 Less oxygenated organic compounds tend to have lower Tg while as the O
C) indicates the degree of oxygenation of the organic compound and is known to affect Tg.2 Less oxygenated organic compounds tend to have lower Tg while as the O![[thin space (1/6-em)]](https://www.rsc.org/images/entities/char_2009.gif) :
:![[thin space (1/6-em)]](https://www.rsc.org/images/entities/char_2009.gif) C ratio increases so does the Tg.2,25 Upon examination of the O
C ratio increases so does the Tg.2,25 Upon examination of the O![[thin space (1/6-em)]](https://www.rsc.org/images/entities/char_2009.gif) :
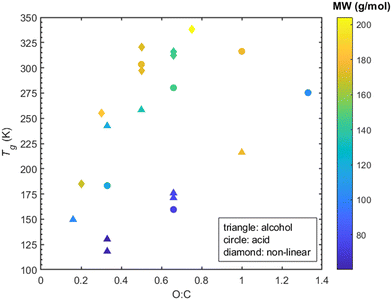
:![[thin space (1/6-em)]](https://www.rsc.org/images/entities/char_2009.gif) C, the linear compounds exhibit a weak correlation (R2 ≈ 0.1 for both alcohols and acids -corresponding graphs in ESI,† Section S7) between O
C, the linear compounds exhibit a weak correlation (R2 ≈ 0.1 for both alcohols and acids -corresponding graphs in ESI,† Section S7) between O![[thin space (1/6-em)]](https://www.rsc.org/images/entities/char_2009.gif) :
:![[thin space (1/6-em)]](https://www.rsc.org/images/entities/char_2009.gif) C and Tg. Note that contrary to this, a correlation (R2 ≈ 0.8, see ESI,† Section S7) between higher O
C and Tg. Note that contrary to this, a correlation (R2 ≈ 0.8, see ESI,† Section S7) between higher O![[thin space (1/6-em)]](https://www.rsc.org/images/entities/char_2009.gif) :
:![[thin space (1/6-em)]](https://www.rsc.org/images/entities/char_2009.gif) C and higher Tg for the non-linear compounds is evident in Fig. 10.
C and higher Tg for the non-linear compounds is evident in Fig. 10.
4. Conclusions
Molecular dynamics simulations were carried out to examine the glass transition temperature of atmospherically relevant organic compounds. Most of our predictions are within 20% of the few available experimental measurements. The Tg estimates based on different properties chosen for the Tg determination were in good agreement (7%) with each other for all compounds. The cooling step was also shown to play a role in the prediction of Tg. The higher cooling step prohibits the molecules from self-assembling locally which can initiate crystallization that would lead to a fictitious Tg.For linear alcohols, the predicted Tg increases with the addition of hydroxyl groups following an almost linear relationship, particularly for the smaller carbon chain (3 carbon atoms). The addition of carbon atoms further increases Tg. Linear acids show a similar behavior regarding the dependence of Tg on the number of hydroxyl groups, i.e., the addition of a carboxyl group increases Tg. However, Tg is more sensitive to the number of carboxyl groups than to the number of hydroxyl ones, a characteristic attributed to the increased ability of the former to form more hydrogen bonds. Additionally, similar to linear alcohols, the carbon chain length in the case of linear acids is seen to increase Tg.
The predicted Tg exhibits a higher sensitivity to carboxyl groups compared to ketone groups. MBTCA (a non-linear compound with 3-COOH) has the highest predicted glass transition temperature. Dicarboxylic acids with a complicated ring structure such as norpinic acid have a predicted Tg close to MBTCA, indicative of a strong structural effect. Dicarboxylic acids containing a non-aromatic carbon ring attached to the main carbon chain had a higher Tg compared to linear and branch-like structured compounds. In the case of branch-like dicarboxylic acids the conclusions remain unclear. 2,2-Dimethylsuccinic acid has a higher Tg than adipic acid, while 2,2-dimethylhexanedioic acid shows a lower Tg than suberic acid. The varied behavior of branched compounds in the case of six and eight carbon atoms regarding the effect of structure remains elusive and requires more systematic investigation. It is important to note that the contribution of polar group content is known to affect the Tg,73 whereas methyl groups do not contribute considerably. However, it is evident that the existence of non-aromatic rings increases Tg.
Molecular weight is found to have a correlation with Tg especially for the linear compounds (either alcohols or acids). Lower molecular weight in linear compounds corresponds to a lower Tg, and conversely, an increase in molecular weight is associated with an increase in Tg. This observation aligns well with existing literature. In the case of non-linear compounds, the molecular weight seems to have little correlation with the predicted Tg. There is no clear correlation between higher O![[thin space (1/6-em)]](https://www.rsc.org/images/entities/char_2009.gif) :
:![[thin space (1/6-em)]](https://www.rsc.org/images/entities/char_2009.gif) C and higher Tg for the linear organic compounds which is in contrast with the case of non-linear compounds.
C and higher Tg for the linear organic compounds which is in contrast with the case of non-linear compounds.
Most of the above conclusions can be rationalized by considering that Tg is directly connected with local (segmental) mobility. Thus, molecular factors that in principle prohibit local dynamics (such as long branches, presence of stiffer moieties, stereo-chemical constraints, presence of specific interactions such as those due to hydrogen bonding, etc.) are likely to force the system to freeze at a higher temperature, thereby causing an increase in Tg. This can explain why an increase in the number of functional groups increases Tg and the same with an increase in chain length. It also explains why Tg is higher when carboxyl groups are present compared to hydroxyl ones: carboxyl groups tend to form more hydrogen bonds and thus to constrain local mobility more than hydroxyl ones. On the other hand, functional groups or stiff moieties close to the two ends of the chain are in general characterized by higher mobility than groups inside the chain, due to the higher (excess) free volume of chain-like molecules near their ends.74–78 Thus, one would expect that functional groups deeper along the chain would cause an increase in the Tg compared to the same groups being located near the ends, which is exactly what we observe in the MD simulations.
In the future, we plan to use MD to study the Tg of mixtures of atmospherically relevant organic compounds. We also plan to use the information and knowledge gained from these studies to establish correlations that can offer reliable estimates of the Tg for a broad spectrum of atmospheric compounds, thus minimizing the necessity for experimental efforts. In conjunction with recently-proposed machine-learning and data-processing approaches, our effort (which aims to fill the observed gaps in Tg measurement for secondary organic aerosol compounds and mixtures with high quality datasets) can substantially help in the direction of developing more accurate and more robust Tg models characterized by smaller errors, lower uncertainties than existing ones, and enhanced generalizability and transferability as far as their predictive capability is concerned when they are utilized for compounds or mixtures beyond the set used for their initial parameterization.
Author contributions
PS contributed to the design of the study, conducted the simulations, analysed the results, and wrote the paper. KSK contributed to the design of the study, the analysis of the results and the writing of the paper. VGM contributed to the design of the study, the analysis of the results and the writing of the paper. SNP was responsible for the design and coordination of the study and the synthesis of the results.Conflicts of interest
There are no conflicts to declare.Acknowledgements
The study was supported by the Hellenic Foundation for Research and Innovation project “Chemical evolution of gas and particulate-phase organic pollutants in the atmosphere” (CHEVOPIN) (grant agreement HFRI-FM17C3-1819). The authors acknowledge the computational time granted by the Greek Research & Technology Network (GRNET) in the national HPC facility ARIS under projects GlaSOA (pr011020) and GlaSOA II (pr013016). The authors are grateful to Dr Loukas D. Peristeras (National Centre for Scientific Research “Democritos”, Athens, Greece) for very fruitful discussions.References
- A. H. Goldstein and I. E. Galbally, Environ. Sci. Technol., 2007, 41, 1514–1521 CrossRef CAS PubMed
.
- T. Koop, J. Bookhold, M. Shiraiwa and U. Pöschl, Phys. Chem. Chem. Phys., 2011, 13, 19238–19255 RSC
.
- B. Wang, T. H. Harder, S. T. Kelly, D. S. Piens, S. China, L. Kovarik, M. Keiluweit, B. W. Arey, M. K. Gilles and A. Laskin, Nat. Geosci., 2016, 9, 433–437 CrossRef CAS
.
- A. Virtanen, J. Joutsensaari, T. Koop, J. Kannosto, P. Yli-Pirilä, J. Leskinen, J. M. Mäkelä, J. K. Holopainen, U. Pöschl, M. Kulmala, D. R. Worsnop and A. Laaksonen, Nature, 2010, 467, 824–827 CrossRef CAS PubMed
.
- B. Zobrist, C. Marcolli, D. A. Pedernera and T. Koop, Atmos. Chem. Phys., 2008, 8, 5221–5244 CrossRef CAS
.
- M. Song, P. F. Liu, S. J. Hanna, Y. J. Li, S. T. Martin and A. K. Bertram, Atmos. Chem. Phys., 2015, 15, 5145–5159 CrossRef CAS
.
- L. Renbaum-Wolff, J. W. Grayson, A. P. Bateman, M. Kuwata, M. Sellier, B. J. Murray, J. E. Shilling, S. T. Martin and A. K. Bertram, Proc. Natl. Acad. Sci. U. S. A., 2013, 110, 8014–8019 CrossRef CAS PubMed
.
- M. Song, P. F. Liu, S. J. Hanna, R. A. Zaveri, K. Potter, Y. You, S. T. Martin and A. K. Bertram, Atmos. Chem. Phys., 2016, 16, 8817–8830 CrossRef CAS
.
- Y. Cheng, H. Su, T. Koop, E. Mikhailov and U. Pöschl, Nat. Commun., 2015, 6, 1–7 Search PubMed
.
- C. D. Cappa, E. R. Lovejoy and A. R. Ravishankara, Direct, 2008, 105, 18687–18691 CAS
.
- C. Marcolli, B. Luo and T. Peter, J. Phys. Chem. A, 2004, 108, 2216–2224 CrossRef CAS
.
- J. W. Grayson, E. Evoy, M. Song, Y. Chu, A. Maclean, A. Nguyen, M. A. Upshur, M. Ebrahimi, C. K. Chan, F. M. Geiger, R. J. Thomson and A. K. Bertram, Atmos. Chem. Phys., 2017, 17, 8509–8524 CrossRef CAS
.
- N. E. Rothfuss and M. D. Petters, Environ. Sci. Technol., 2017, 51, 271–279 CrossRef CAS PubMed
.
-
G. A. Tammann, Scopola Voss, 1933, p.12 Search PubMed
.
- O. V. Mazurin, Glass Phys. Chem., 2007, 33, 22–36 CrossRef CAS
.
- P. G. Debenedetti and F. H. Stillinger, Nature, 2001, 410, 259 CrossRef CAS PubMed
.
- D. Champion, M. Le Meste and D. Simatos, Trends Food Sci. Technol., 2000, 11, 41–55 CrossRef CAS
.
- C. Wen, B. Liu, J. Wolfgang, T. E. Long, R. Odle and S. Cheng, J. Polym. Sci., 2020, 58, 1521–1534 CrossRef CAS
.
- O. V. Mazurin and Y. V. Gankin, Glass Technol.: Eur. J. Glass Sci. Technol., Part A, 2008, 49, 229–233 CAS
.
- A. Newman and G. Zografi, AAPS PharmSciTech, 2020, 21, 1–13 CrossRef PubMed
.
- A. Kołodziejczyk, P. Pyrcz, K. Błaziak, A. Pobudkowska, K. Sarang and R. Szmigielski, ACS Omega, 2020, 5, 7919–7927 CrossRef PubMed
.
- A. Kołodziejczyk, P. Pyrcz, A. Pobudkowska, K. Błaziak and R. Szmigielski, J. Phys. Chem. B, 2019, 123, 8261–8267 CrossRef PubMed
.
- H. P. Dette, M. Qi, D. C. Schröder, A. Godt and T. Koop, J. Phys. Chem. A, 2014, 118, 7024–7033 CrossRef CAS PubMed
.
- H. P. Dette and T. Koop, J. Phys. Chem. A, 2015, 119, 4552–4561 CrossRef CAS PubMed
.
- M. Shiraiwa, Y. Li, A. P. Tsimpidi, V. A. Karydis, T. Berkemeier, S. N. Pandis, J. Lelieveld, T. Koop and U. Pöschl, Nat. Commun., 2017, 8, 1–7 CrossRef PubMed
.
- W. S. W. DeRieux, Y. Li, P. Lin, J. Laskin, A. Laskin, A. K. Bertram, S. A. Nizkorodov and M. Shiraiwa, Atmos. Chem. Phys., 2018, 18, 6331–6351 CrossRef
.
- Y. Li, D. A. Day, H. Stark, J. L. Jimenez and M. Shiraiwa, Atmos. Chem. Phys., 2020, 20, 8103–8122 CrossRef CAS
.
- J. S. Taylor and M. Gordon, J. Appl. Chem., 1952, 2, 9493–9500 CrossRef
.
- Y. Zhang, L. Nichman, P. Spencer, J. I. Jung, A. Lee, B. K. Heffernan, A. Gold, Z. Zhang, Y. Chen, M. R. Canagaratna, J. T. Jayne, D. R. Worsnop, T. B. Onasch, J. D. Surratt, D. Chandler, P. Davidovits and C. E. Kolb, Environ. Sci. Technol., 2019, 53, 12366–12378 CrossRef CAS PubMed
.
- R. F. Boyer, Rubber Chem. Technol., 1963, 36, 1303–1421 CrossRef CAS
.
- L. M. Wang, C. A. Angell and R. Richert, J. Chem. Phys., 2006, 125, 074505 CrossRef PubMed
.
- R. G. Beaman, J. Polym. Sci., 1952, 9, 470–472 CrossRef CAS
.
- S. Sakka, J. Non-Cryst. Solids, 1971, 6, 145–162 CrossRef CAS
.
-
C. L. Yaws, Yaws Handbook of Thermodynamic Properties for Hydrocarbons and Chemicals, Gulf Publishing Company, first edit., 2007 Search PubMed
.
-
D. R. Lide, CRC Handbook of Chemistry and Physics, Standard thermodynamic properties of chemical substances, 86th edn, 2006 Search PubMed
.
- Chemeo, https://www.chemeo.com/.
- Chemspider, https://www.chemspider.com/.
- Chemical Book, https://www.chemicalbook.com/.
- T. Galeazzo and M. Shiraiwa, Environ. Sci. Atmos., 2022, 2, 362–374 CAS
.
- G. Armeli, J. H. Peters and T. Koop, ACS Omega, 2023, 8, 12298–12309 CrossRef CAS PubMed
.
- K. S. Karadima, V. G. Mavrantzas and S. N. Pandis, Phys. Chem. Chem. Phys., 2017, 19, 16681–16692 RSC
.
- K. S. Karadima, V. G. Mavrantzas and S. N. Pandis, Atmos. Chem. Phys., 2019, 19, 5571–5587 CrossRef CAS
.
- S. Napolitano, E. Glynos and N. B. Tito, Rep. Prog. Phys., 2017, 80, 036602 CrossRef PubMed
.
-
Scienomics SARL, version 3.4.2, MAPS platform, France, 2015 Search PubMed
.
- C. Caleman, P. J. Van Maaren, M. Hong, J. S. Hub, L. T. Costa and D. Van Der Spoel, J. Chem. Theory Comput., 2012, 8, 61–74 CrossRef CAS PubMed
.
- M. M. Ghahremanpour, J. Tirado-Rives and W. L. Jorgensen, J. Phys. Chem. B, 2022, 126, 5896–5907 CrossRef CAS PubMed
.
- W. L. Jorgensen, M. M. Ghahremanpour, A. Saar and J. Tirado-Rives, J. Phys. Chem. B, 2024, 128, 250–262 CrossRef CAS PubMed
.
- L. S. Dodda, I. C. De Vaca, J. Tirado-Rives and W. L. Jorgensen, Nucleic Acids Res., 2017, 45, W331–W336 CrossRef CAS PubMed
.
- D. J. Cole, J. Z. Vilseck, J. Tirado-Rives, M. C. Payne and W. L. Jorgensen, J. Chem. Theory Comput., 2016, 12, 2312–2323 CrossRef CAS PubMed
.
- L. S. Dodda, J. Z. Vilseck, J. Tirado-Rives and W. L. Jorgensen, J. Phys. Chem. B, 2017, 121, 3864–3870 CrossRef CAS PubMed
.
- S. H. Jamali, T. Van Westen, O. A. Moultos and T. J. H. Vlugt, J. Chem. Theory Comput., 2018, 14, 6690–6700 CrossRef CAS PubMed
.
- J. Yoo and A. Aksimentiev, Phys. Chem. Chem. Phys., 2018, 20, 8432–8449 RSC
.
- S. W. I. Siu, K. Pluhackova and R. A. Böckmann, J. Chem. Theory Comput., 2012, 8, 1459–1470 CrossRef CAS PubMed
.
- K. Pluhackova, H. Morhenn, L. Lautner, W. Lohstroh, K. S. Nemkovski, T. Unruh and R. A. Böckmann, J. Phys. Chem. B, 2015, 119, 15287–15299 CrossRef CAS PubMed
.
- R. Zangi, ACS Omega, 2018, 3, 18089–18099 CrossRef CAS PubMed
.
- D. Kony, W. Damm, S. Stoll and W. F. Van Gunsteren, J. Comput. Chem., 2002, 23, 1416–1429 CrossRef CAS PubMed
.
- N. D. Kondratyuk, J. Phys. Conf. Ser., 2019, 1385, 012048 CrossRef CAS
.
- S. P. Šerbanovic, M. L. J. Mijajlović, I. R. Radović, B. D. Djordjević, M. L. J. Kijevčanin, E. M. Djordjević and A. Ž. Tasić, J. Serb. Chem. Soc., 2005, 70, 527–539 CrossRef
.
- W. Damm, A. Frontera, J. Tirado-Rives and W. L. Jorgensen, J. Comput. Chem., 1997, 18, 1955–1970 CrossRef CAS
.
- W. G. Hoover, Phys. Rev. A: At., Mol., Opt. Phys., 1985, 31, 1695–1697 CrossRef PubMed
.
-
M. P. Allen and D. J. Tildesley, Computer Simulation of liquids, Oxford University Press, New York, 1991 Search PubMed
.
- S. Plimpton, J. Comput. Phys., 1995, 117, 1–19 CrossRef CAS
.
- Q. Yang, X. Chen, Z. He, F. Lan and H. Liu, RSC Adv., 2016, 6, 12053–12060 RSC
.
- J. Buchholz, W. Paul, F. Varnik and K. Binder, J. Chem. Phys., 2002, 117, 7364–7372 CrossRef CAS
.
- J. T. Cornelius, T. Moynihan, A. J. Easteal and J. Wilder, J. Chem. Phys., 1974, 78, 2673–2677 CrossRef
.
- G. G. Vogiatzis and D. N. Theodorou, Macromolecules, 2014, 47, 387–404 CrossRef CAS
.
- A. F. Behbahani, S. M. V. Allaei, G. H. Motlagh, H. Eslami and V. A. Harmandaris, Macromolecules, 2018, 51, 7518–7532 CrossRef CAS
.
- N. Ch Karayiannis, V. G. Mavrantzas and D. N. Theodorou, Macromolecules, 2004, 37, 2978–2995 CrossRef CAS
.
- F. Puosi, A. Tripodo and D. Leporini, Int. J. Mol. Sci., 2019, 20, 5708 CrossRef PubMed
.
- M. L. Williams, R. F. Landel and J. D. Ferry, J. Am. Chem. Soc., 1955, 77, 3701–3707 CrossRef CAS
.
- G. Williams and D. C. Watts, Trans. Faraday Soc., 1970, 66, 80–85 RSC
.
- C. Talón, M. A. Ramos, S. Vieira, I. Shmyt’ko, N. Afonikova, A. Criado, G. Madariaga and F. J. Bermejo, J. Non-Cryst. Solids, 2001, 287, 226–230 CrossRef
.
- Y. L. Li, X. M. Jia, X. Z. Zhang, Z. Y. Lu and H. J. Qian, Soft Matter, 2022, 19, 128–136 RSC
.
- G. Tsolou, V. A. Harmandaris and V. G. Mavrantzas, J. Chem. Phys., 2006, 124, 084906 CrossRef PubMed
.
- G. Tsolou, V. A. Harmandaris and V. G. Mavrantzas, J. Non-Newtonian Fluid Mech., 2008, 152, 184–194 CrossRef CAS
.
- G. Tsolou, V. A. Harmandaris and V. G. Mavrantzas, Macromol. Theory Simul., 2006, 15, 381–393 CrossRef CAS
.
- V. A. Harmandaris, D. Angelopoulou, V. G. Mavrantzas and D. N. Theodorou, J. Chem. Phys., 2002, 116, 7656–7665 CrossRef CAS
.
- O. Alexiadis, V. G. Mavrantzas, R. Khare, J. Beckers and A. R. C. Baljon, Macromolecules, 2008, 41, 987–996 CrossRef CAS
.
Footnote |
| † Electronic supplementary information (ESI) available. See DOI: https://doi.org/10.1039/d4sm00405a |
| This journal is © The Royal Society of Chemistry 2024 |

