 Open Access Article
All-atom molecular dynamics simulation of solvent diffusion in an unentangled polystyrene film†
Javad
Tamnanloo
 and
Mesfin
Tsige
 *
*
School of Polymer Science and Polymer Engineering, The University of Akron, Akron, Ohio 44325, USA. E-mail: mtsige@uakron.edu
First published on 10th June 2024
Abstract
The diffusion behavior of low molecular weight solvents within an unentangled polystyrene film below and above its glass transition temperature is investigated. The diffusion behavior in the glassy state exhibits a distinct behavior known as case II or class II diffusion, noticeably diverging from conventional Fickian diffusion observed above the glass transition temperature of the polymer film. In the context of case II diffusion, the primary experimental observation entails the emergence of a well-defined concentration front moving at a constant speed, delineating a swollen, rubbery region from a glassy region within the polymer system. Despite the prevalence of this phenomenon in experimental settings, simulating case II diffusion has posed a significant challenge, primarily due to the computationally intensive nature of the diffusion process. To address this, we have developed an all-atom molecular dynamics simulation approach for the observation of case II diffusion in glassy polymers. This method aims to unravel the intricacies of the diffusion process, providing valuable insights into the dynamic interactions between solvents and the polymer matrix.
Introduction
Numerous glassy polymers undergo significant swelling upon exposure to low molecular weight solvents, a phenomenon distinct from the typical Fickian diffusion observed in rubbery systems where no adsorbent deformation occurs.1 In glassy polymers, the interaction between diffusion and swelling exhibits distinctive characteristics, marked by the penetration of the solvent resulting in the formation of a sharp advancing front.2 This front distinctly separates the outer swollen, rubbery shell from the intact glassy core,3 giving rise to a diffusion behavior commonly referred to as case II or class II diffusion.4Distinguishing between these two types of diffusion behaviors provides insights into the underlying transport mechanisms governing molecular motion in glassy polymers.5 Case II diffusion is relevant in various practical applications involving glassy polymers, such as in the pharmaceutical industry for controlled drug release from polymer matrices,6,7 in packaging materials to understand barrier properties,8–10 and in polymer membranes for gas separation processes.11,12 Understanding which diffusion mechanism predominates under specific conditions allows for the optimization of material properties to meet desired performance criteria, such as controlled release profiles, enhanced barrier properties, or improved separation efficiency.13
Case II diffusion is characterized by several distinctive features. In contrast to Fickian behavior, which is characterized by a random walk without significant interactions, case II diffusion involves strong interactions between the solvent and the polymer, resulting in polymer swelling.14 The deformation provides a significantly larger space for solvent molecules to diffuse, resulting in a substantial increase in the diffusion coefficient by several orders of magnitude in the swollen region compared to the glassy region. This differential diffusion gives rise to a sharp front, a necessary but not sufficient condition for case II diffusion, delineating the two distinct regions of the polymer. Preceding this sharp front, a Fickian precursor emerges due to the initial exposure of the glassy region to solvent molecules. Following an induction time necessary for the full development of the sharp front, the mass uptake exhibits a linear dependence on time, in stark contrast to typical Fickian diffusion where mass uptake is proportional to the square root of time. This linear relationship is also reflected in the movement of the sharp front over time. Behind the sharp front, the concentration gradient of the solvent is initially negligible but gradually increases until it reaches an equilibrium state.4,15,16
Several experimental studies4,17–26 have contributed to the understanding of case II diffusion. Notably, Kramer and colleagues investigated the diffusion of iodoalkanes into polystyrene (PS) using the Rutherford backscattering technique.1,15,16,22 Their work has provided comprehensive insights into the initial formation and subsequent movement of the sharp front associated with case II diffusion, revealing the existence of a Fickian tail ahead of the moving front, and highlighting conditions for the dominance of the Fickian tail. Additionally, Kramer and co-workers studied the impact of temperature27 and solvent molecular size28 on the diffusion behavior. Their findings show a thermal activation trend in the front velocity of case II diffusion with varying temperatures. They also observed a decrease in velocity and diffusion coefficient as the solvent molecular size increased. These insights offer a more detailed perspective on the factors influencing this distinctive diffusion phenomenon.
Early endeavors to model case II diffusion involved the incorporation of variable material properties or the introduction of a two-stage diffusion process to effectively capture the quantitative impacts of structural changes and polymer swelling.28–31 However, these attempts fell short of providing a satisfactory justification for the constant velocity of the diffusion front. Subsequent efforts, including those by Thomas and Windle,32 successfully modeled the linear penetration of the diffusion front by incorporating osmotic pressure into the equations.2,15 Despite this success, the predicted front velocity lacked quantitative accuracy. More recent modeling approaches have enhanced the precision by integrating a diffusional Deborah number, signifying the ratio of the mechanical relaxation time of the solid to the diffusional relaxation time of the solvent.33 Notably, Miao, Tsige, and Taylor have recently pioneered a generalized kinetic model capable of describing various types of small molecule diffusion in polymers, offering a comprehensive framework for understanding and predicting case II behavior.34 Similarly, Lyu et al. recently proposed a model for studying the swelling properties of glassy polymers. The model reveals the different stages of the swelling where the case II diffusion is identified as an intermediate stage.35
Molecular dynamics (MD) simulation of case II diffusion poses significant computational challenges mainly because of the computationally demanding nature of the diffusion process. Previous MD studies have primarily focused on diffusion into polymer melts or the early stages of diffusion into glassy polymers. Tsige and Grest36 conducted investigations into the dependence of the diffusion coefficient on concentration and the development of the Fickian precursor diffusing into a glassy polymer matrix. Grest and colleagues37 investigated the interdiffusion of oligomers into entangled and unentangled polymer films, both above and below the glass transition temperature, utilizing bead-spring MD simulations. They identified the formation of a solid, polymer-rich region and a swollen, oligomer-rich region, yet they did not observe case II behavior. Recently, Lin et al.9 utilized coarse-grained MD simulations to explore the interdiffusion of small aldehyde molecules into unentangled glassy hetero-polymer films mainly consisting of poly(methyl acrylate) and poly(ethylene-co-acrylate). Their study examined the effects of temperature, aldehyde molecule size, and the presence of water. Interestingly, they observed that the mass uptake increased almost linearly with time for all solvents, contrary to the square root of the time trend typically associated with Fickian diffusion. However, the dominance of the Fickian precursor persisted in solvent diffusion profiles, exhibiting a scaling factor of t0.5 for overlaying density profiles.
The impetus for the current study stems from a preceding all-atom simulation exploration conducted by Marcon et al.38 on the initial stages of swelling in a 10-mer glassy polystyrene (PS) film induced by toluene, along with the dissolution of PS chains into the solvent. Their findings revealed the emergence of a swollen layer featuring a Fickian precursor and a sharp front—crucial indicator for case II diffusion. Additionally, they noted an anisotropic effect of the solvent on the mobility of polymer chains in the surface layer, augmenting their movement parallel to the interface. While the observation of a sharp front is indicative, it is imperative to establish that the front moves at a constant velocity over an extended period to conclusively affirm case II behavior. Hence, the necessity for prolonged simulations is underscored, ensuring a comprehensive confirmation of toluene diffusion through the PS oligomer as indeed being consistent with case II diffusion.
Simulation details
To address our objective, we conducted an in-depth investigation into the diffusion dynamics of acetone, toluene, and a blend of the two solvents into a 10-mer polystyrene (PS) film employing all-atom molecular dynamics simulations.First, we equilibrated a bulk polystyrene system, which consisted of 150 chains of 10-mer PS, in the NPT ensemble at 550 K for 10 ns. This was performed using the OPLS force field39 and the LAMMPS40 software. We then cooled the system to 100 K at a rate of 20 K per 5 ns under atmospheric pressure. The bulk density of the system was computed as a function of temperature to determine its glass transition temperature (Tg). As the polymer system transitions from the melt state to the glassy state, the reduced mobility of the polymer chains affects various physical properties such as density, molar volume, viscosity, and specific heat. The glass transition is marked by a noticeable change in the slope of the density versus temperature curve obtained from the simulations.41,42
Fig. 1 illustrates the relationship between the bulk density of PS and temperature, showing two fitted lines that minimize the mean absolute deviation (MAD) error. By identifying the intersection points of these lines, we determined the glass transition temperature for the 10-mer PS system to be 358 K. It should be noted that the cooling rates employed in our simulations are significantly faster than those typically used in experiments, potentially leading to an overestimation of the glass transition temperature by approximately 3 K for each order of magnitude difference in the cooling rate.43,44 This observation is consistent with experimentally derived data for short chain PS, which typically have a Tg around 310 K.45,46
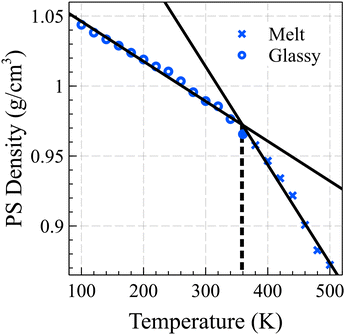 | ||
| Fig. 1 The estimated glass transition temperature of the PS bulk is 358 K, determined by the intersection of the linear fits of density vs. temperature curves for the glassy and melt states. | ||
Based on the simulated Tg value, two free-standing PS films were generated by removing the periodicity in the z-direction at the end of 300 K and 450 K cooling rate runs, i.e., below and above the Tg of our PS system, respectively. The films were then equilibrated for 10 ns at their respective temperatures. The equilibrated films featuring a surface area of approximately 54 Å × 51 Å and film thickness of more than 110 Å were brought into contact with a 200 Å-thick solvent layer. Our design, with a smaller film thickness and reduced surface area compared to a previous work,38 aimed to shorten the otherwise significantly longer simulation times. To understand the effect of the state of the polymer (glassy or rubbery) on the solvent diffusion behavior, the PS/solvent systems were run between 298 K and 450 K (well below and well above the glass transition temperature of the film). To prevent solvent molecules from escaping the system especially at high temperatures, a reflecting wall was used. Furthermore, to gain an in-depth understanding of the diffusion process far below Tg, the 298 K cases were run for over 500 ns.
Throughout the long simulation, we observed instances where several PS chains dissolved into a solvent, only to be reabsorbed over time, thus affecting the nature of the diffusion process. In response, we conducted additional simulations at 298 K where PS chains moving at least 20 Å from the interface and diffusing into the solvent were permanently excluded from the simulations. Subsequently, we distinguish between these two approaches as concentrated solution and dilute solution, respectively, in the following discussions. This refinement ensures a more accurate depiction of the diffusion dynamics, minimizing the impact of reabsorbed PS chains on the overall simulation.
Results and discussion
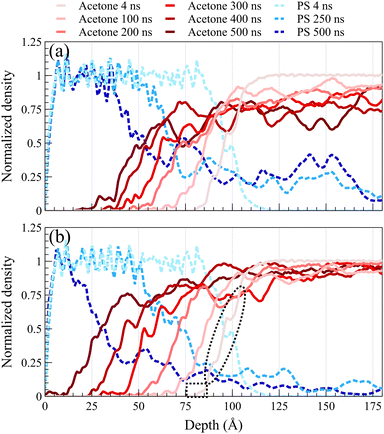
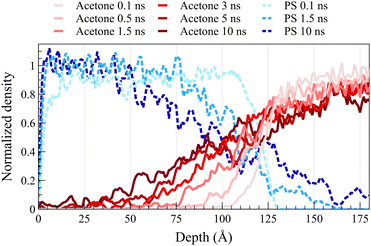
Fig. 2 illustrates density profiles, normalized by their bulk density, for the acetone/PS case at 298 K in both concentrated and dilute solutions, with each profile representing an average of 1.0 ns of data. Comparable density profiles are observed for toluene and the equimolar mixture of acetone and toluene (refer to Fig. S1 and S2 in the ESI,† respectively). In a dilute solution, a more uniform spacing between the fronts is evident, contrasting with the concentrated solution where the front propagation slows down over time, leading to a decrease in spacing between fronts. This trend is consistent in the density profiles of PS. PS density profiles in Fig. 2a depict the accumulation of PS chains within the solvent. The concentration of dissolved PS chains increased throughout the solvent in the concentrated system, as illustrated in Fig. 2a. Conversely, it gradually diminishes close to zero deeper into the solvent in the dilute system, as shown in Fig. 2b. In both concentrated and dilute cases, following the initial exposure of the polymer film to the solvent, the solvent density profiles exhibit a similar shape characterized by a sharp front preceded by a Fickian precursor. As depicted in Fig. 2b, the Fickian precursor emerges as solvent molecules close to the PS surface diffuse into the polymer matrix, resulting in a gradual increase in solvent density. In contrast, the sharp front creates an almost vertical change in the solvent density.As anticipated, the diffusion behavior observed at temperatures exceeding the glass transition lacks the necessary and sufficient conditions for case II diffusion. Fig. 3 shows normalized density profiles of acetone and PS at 450 K for the concentrated solution system. Each profile represents an average over 0.1 ns of data. At this elevated temperature, PS film transitions into a melt state, exhibiting significantly faster dynamics compared to those at 298 K as depicted in Fig. 2. While the acetone profile undergoes minimal change over 10 ns at 298 K, it diffuses the entire length of a 100-Å PS film within the same duration of exposure at 450 K. Distinct from case II behavior observed at the glassy state, melt state diffusion shows a Fickian behavior lacking the sharp front and the linear propagation of the front. A similar behavior was observed at 400 K (refer to ESI† Fig. S3 for density profiles at 400 K).
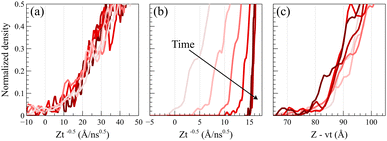
To validate the Fickian diffusion behavior above Tg, we constructed a master curve of density profiles as a function of Zt−0.5. As depicted in Fig. 4a, density profiles collapse into a singular master curve at 450 K, affirming the Fickian diffusion characteristics.47 This serves as a distinguishing test, as density profiles collected at temperatures below the glass transition fail the criterion. As shown in Fig. 4b, applying Zt−0.5 as the shifting function systematically changes the slopes of the density profiles based on the time and separates them while shifting confirming that the diffusion process is not Fickian.
Alternatively, as shown in Fig. 4c, a master curve for case II diffusion profiles can be generated by linearly shifting density profiles as a function of Z − vt, where v denotes the linear propagation velocity of the front. This shifting function keeps the slopes of density profiles unchanged and only shifts their relative positions based on the corresponding time. The formation of the master curve further corroborates the observation of case II diffusion behavior at 298 K.
To investigate the factors that result in a sharp solvent front, we quenched the PS film/toluene system prepared at 450 K down to 298 K and ran it for tens of nanoseconds. We observed a sharp front similar to the one in the film prepared directly at 298 K, but the front moved at a slightly faster rate in the quenched film. The film prepared at 450 K exhibited a higher free volume compared to the film prepared at 298 K, leading to faster solvent diffusion in the former case. Our preliminary investigation suggests that the glassy state, characterized by frozen polymer chains compared to the dynamics of the solvent molecules, is the determining factor for the observed solvent sharp front at 298 K. Given that the 10-mer PS chain is relatively short compared to the entanglement length of a PS chain (which is in excess of 130-mers48), future investigations should focus on identifying the role of polymer chain entanglement in the behavior of solvent diffusion in polymeric systems. This would provide deeper insights into how chain length and entanglement influence solvent dynamics and could potentially lead to improved control over solvent diffusion processes in various applications.
Based on our discussion, a sharp solvent front is a unique property of a solvent diffusing into a glassy polymer system, which is a necessary condition for case II diffusion. Understanding how this sharp front moves within the polymer film is crucial for confirming that the diffusion process qualifies as case II.
To determine the position of the solvent front in the glassy state (at 298 K), we employed a straightforward approach where the sharp front part of the density profile, featuring normalized density values ranging from 0.15 to 0.45, was subjected to averaging. The resulting average value was then recorded as the position of the front. Notably, we observed that a simple arithmetic average performed similar to or better than more complicated methods, such as fitting linear or nonlinear functions to the front, resulting in a smoother movement profile (refer to Table S1 in the ESI†).
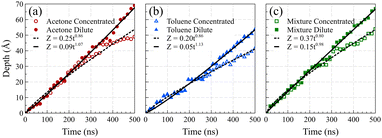
Fig. 5 presents the front positions at 298 K for all cases, accompanied by fitted models employing the equation Z = vtn, where Z denotes the front position (in Å), t is the elapsed time (in ns), and v and n are fitting parameters. Typically, models for Fickian diffusion exhibit an n value of 0.5, indicating a square root proportionality to time;49 however, the shape of density fronts in Fickian diffusion changes over time focusing solely on individual features, like a specific concentration introduces arbitrary criteria.50 In contrast, the shape of density fronts in case II diffusion stays unchanged, which enables us to assign a single value for the position of each density front. For a typical case II diffusion, n value close to 1 is expected.15,22,27,51,52 Our simulation cases for concentrated solutions displayed n values of 0.86 for acetone, 0.82 for toluene, and 0.78 for the mixture. This concave-down decreasing pattern aligns with findings in other studies.9 We attribute this deviation from linear behavior to the fact that dissolved PS molecules are reabsorbed on the PS surface. This phenomenon introduces complexities in the diffusion dynamics, contributing to the observed deviations in the n values from the anticipated case II behavior. We are of the opinion that, had the authors of ref. 38 extended the duration of their simulations, they would have obtained similar n value for the toluene case. The front positions in the dilute solution systems exhibit a more accelerated rate of movement compared to their concentrated solution counterparts, characterized by n values of 1.07, 1.13, and 0.98 for acetone, toluene, and mixture solutions at 298 K, respectively. This observation supports the conclusion that, in the absence of PS chain reabsorption, the solvent profile advances at a constant rate, satisfying the sufficient condition for case II diffusion. The consistent n values of around 1 (slightly higher for toluene) affirm the adherence to the characteristic behavior of case II diffusion in these dilute solution systems.
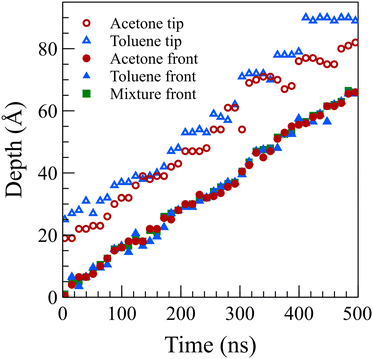
To facilitate a comparison of front propagation velocities across different cases at 298 K, we applied a linear fit to the front position of solvents, though it is far from linear especially for the concentrated case, resulting in Z = vt. The fitted parameters are presented in Table 1. Notably, the smaller molecules of pure acetone exhibited a faster diffusion into the polymer film compared to toluene molecules.53 As shown in Fig. 6, in the mixture case, the density profiles of acetone and toluene moved in tandem, with a movement pace more akin to the pure acetone case. Additionally, in the mixture case, we observed that toluene dominated the Fickian precursor section of the front, while acetone and toluene moved together as part of the front. This nuanced understanding of the front dynamics provides insights into the differential behaviors of individual solvents and their interplay in the mixture case.
| Solvent | v (Å ns−1) | Goodness of fit (R2) |
|---|---|---|
| Acetone concentrated | 0.1126 ± 0.0017 | 0.9672 |
| Acetone dilute | 0.1323 ± 0.0010 | 0.9933 |
| Toluene concentrated | 0.0864 ± 0.0011 | 0.9747 |
| Toluene dilute | 0.1025 ± 0.0013 | 0.9802 |
| Mixture concentrated | 0.1147 ± 0.0018 | 0.9639 |
| Mixture dilute | 0.1342 ± 0.0008 | 0.9947 |
Experimental studies frequently implement mass uptake or weight gain measurements to determine the diffusion type. While experimental measurement of weight gain in polymers undergoing swelling due to solvent diffusion is generally manageable, it poses a formidable challenge in molecular simulation studies, as the dynamic swelling or dissolution of the polymer introduces complexities in defining boundaries for the polymer film. To address this challenge, researchers limit the weight gain studies up to a degree that swelling is negligible.37 Alternatively, researchers may employ a fixed-point reference for the polymer boundary to facilitate weight gain measurements. This approach involves designating a predetermined point as the reference for tracking solvent molecules, disregarding the evolving polymer boundaries.9 For example, in cases where the polymer undergoes dissolution, the fixed boundary, initially delineating the outermost layer of the polymer film, may become submerged within the solvent bulk. Consequently, this fixed boundary methodology deviates significantly from the actual polymer configuration, compromising its alignment with experimental measurements. Despite its limitations, the fixed boundary technique remains viable for the quantification of solvent molecules passing the defined boundary, offering a means to analyze the diffusion process and observe the emergence of the solvent front.
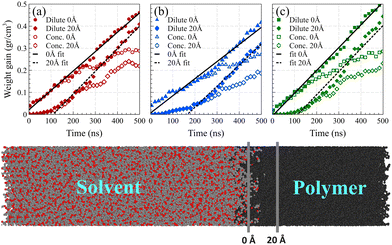
As shown in Fig. 7, we considered two fixed points as the boundaries of the polymer film and quantified the mass of solvent molecules passing beyond these predetermined reference points and normalized it by the volume of the polymer film beyond that point. The first fixed point denoted the polymer film's surface position before solvent exposure, while the second fixed point was positioned at 20 Å from the surface into the polymer film, where no solvent molecules had reached within the initial 4 ns of the simulation.
The observed induction time, i.e., the time needed for a fully developed front to form, at the surface reference point was markedly shorter than that at 20 Å. This is caused by the significantly greater motional freedom of polymer chains located at the surface of the polymer film compared to those residing deeper within the polymer bulk.54 Consequently, surface chains could readily rearrange to accommodate solvent molecules into their free spaces, rendering the induction time at the surface indiscernible. In both reference points, following the establishment of the main density front, a linear weight gain was observed, confirming case II behavior.
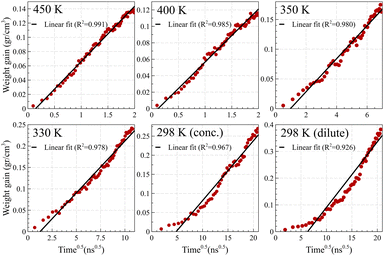
In contrast, Fickian diffusion exhibits a decelerating weight gain, which emerges linearly when plotted against the square root of time. As shown in Fig. 8, diffusion at temperatures higher than the glass transition temperature (i.e., 450 K and 400 K for Fig. 8a and Fig. 8b, respectively) exhibits a typical linear weight gain versus square root of time.14,55–57 However, at temperatures well below the glass transition temperature, the weight gain does not pass the linearity test. The deviation is maximized for the dilute case at 298 K, which is aligned with the weight gain behavior of case II, showing a linear behavior against time (and not against the square root of time). A similar trend was observed for weight gain of the mixture case (refer to Fig. S4, ESI†).
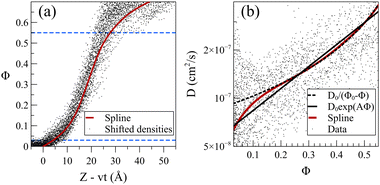
The steady front motion allows for generating a master curve for the density profiles by shifting them using Zshifted = Z − vt. Fig. 9a shows the shifted density profiles and the resulting master curve for dilute acetone case at 298 K. To create the master curve, the normalized density was divided into 30 equal sections. This number of sections provided reasonable resolution without sacrificing the smoothness. Subsequently, the average value of Z − vt in each section was calculated and assigned as the shifted position of that section. The presented master curve is a fitted spline to these 30 points. In the resulting shifted density curve, the dispersity of the data points is not uniform. Specifically, the points are less scattered for normalized densities within the range of 0.03 < Φ< 0.55, as observed in Fig. 9a. The wider distribution of data points below this section can be attributed to the presence of the Fickian precursor due to the hopping movement of solvent molecules between the cages of chains in the glassy polymer. Conversely, the scattering of data points above this range is attributed to the dissolution and possible reabsorption of the PS chains close to the polymer film surface, introducing additional complexities into the density profiles.
The exploration of how the diffusion coefficients of solvent molecules correlate with their concentration profiles represents an interesting topic, often investigated to comprehend the diffusion behavior of small molecules into glassy polymers. It was shown that one can derive a general expression of diffusivity D = D(Φ) from the non-linear diffusion equation.34 For the dilute systems at 298 K, we calculated solvent diffusion coefficients by utilizing density data points and developing a master curve within the specified section (demarcated by dashed blue lines in Fig. 9a). The solid dots in Fig. 9b represent the diffusion coefficient of acetone/PS derived from the density data points (more details in eqn (S1)–(S3) in the ESI†). Given the high sensitivity of the diffusion coefficient to changes in density with respect to time and position, even minor fluctuations in density can induce significant variations in the resultant diffusion values.
To address this challenge, we utilized the master curve in Fig. 9a, incorporating a constant propagation velocity (v from Table 1). This approach facilitated the derivation of a smoothed curve for the diffusion coefficient, illustrated by the solid red line in Fig. 9b. Analogous analyses were conducted for toluene and the mixture (refer to Fig. S5 and S6, ESI,† respectively). Note that in the low concentration region, the diffusion coefficient of acetone at 298 K is notably 2–3 orders of magnitude lower than the self-diffusion of pure acetone (which is around 3.2 × 10⁻⁵ cm2 S−1 from our pure acetone simulation). This is in agreement with experimental observation wherein the diffusion coefficient of small molecules in glassy polymers has been noted to be 2–4 orders magnitude smaller.58 Our results nullify the presence of any sudden change or discountinuity59–61 in D(Φ), demonstrating that D is a monotonically increasing function of Φ, with a turning point at a normalized density of around 0.15. Researchers suggested various dependencies of D on Φ,50,58,62,63 and here we examined the exponential (D0eAΦ)64–66 and inversely proportional (D0/(Φ0 − Φ))34 functions for D(Φ). Our results indicate that, while the overall fit is deemed acceptable, noticeable deviations become pronounced, particularly for lower Φ values. The inversely proportional model perfectly aligns with the data except for Φ values below the turning point of Φ = 0.15, leading to an overestimation of diffusivities at low solvent concentrations. On the other hand, the exponential model offers a more accurate approximation for lower concentrations but fails to capture the curvature evident in the data when displayed on a logarithmic scale. Our observations suggest that while acceptable, these models lack the flexibility for matching the actual data.
Conclusions
Our study employed all-atom molecular dynamics simulations to investigate the diffusion behavior of toluene, acetone, and their mixture within a short-chain polystyrene (PS) film above and below its glass transition temperature (Tg). Robust observations below Tg required run times of at least 400 ns. Our findings demonstrated that the diffusion of acetone, toluene, and their mixture into the glassy PS polymer adhered to case II diffusion behavior while Fickian diffusion behavior is observed above Tg. Across all three solvents, we observed both necessary and sufficient conditions for case II diffusion below Tg, characterized by the creation of a sharp front and linear front propagation. Acetone exhibited faster diffusion in PS compared to toluene, while their mixture mirrored acetone behavior. Notably, the accumulation of solvate molecules hindered front movement, and the periodic removal of solvate molecules facilitated the establishment of case II behavior. By linearly shifting the fronts in the opposite direction of their movement, we constructed a master curve and calculated a smooth diffusion coefficient from this curve. Our study contributes to the fundamental understanding of polymer–solvent interactions and transport phenomena in soft materials by elucidating the mechanisms governing the dissolution and diffusion processes in this specific system.Author contributions
J. T. performed data analysis, drafted the initial version of the manuscript, and provided critical revisions. M. T. conceived the project, ran the LAMMPS simulations, and helped in data analysis and in the writing of the manuscript and approved the final version.Conflicts of interest
The authors declare no competing financial interest.Acknowledgements
The authors acknowledge financial support from the National Science Foundation DMR- 2114640.Notes and references
- C.-Y. Hui, K.-C. Wu, R. C. Lasky and E. J. Kramer, J. Appl. Phys., 1987, 61, 5129–5136 CrossRef CAS.
- A. S. Argon, R. E. Cohen and A. C. Patel, Polymer, 1999, 40, 6991–7012 CrossRef CAS.
- A. El Afif and M. Grmela, J. Rheol., 2002, 46, 591–628 CrossRef CAS.
- T. Alfrey, E. F. Gurnee and W. G. Lloyd, J. Polym. Sci., Part C: Polym. Symp., 1966, 12, 249–261 CrossRef.
- D. A. Mooney and J. M. D. MacElroy, J. Chem. Phys., 1999, 110, 11087–11093 CrossRef CAS.
- C. Brazel, Biomaterials, 1999, 20, 721–732 CrossRef CAS.
- C. S. Brazel and N. A. Peppas, Polymer, 1999, 40, 3383–3398 CrossRef CAS.
- S. Y. Lim, M. Sahimi, T. T. Tsotsis and N. Kim, Phys. Rev. E: Stat., Nonlinear, Soft Matter Phys., 2007, 76, 011810 CrossRef.
- E. Lin, X. You, R. M. Kriegel, R. D. Moffitt and R. C. Batra, Polymer, 2017, 115, 273–284 CrossRef CAS.
- O. Y. Kwapong and J. H. Hotchkiss, J. Food Sci., 1987, 52, 761–763 CrossRef CAS.
- N. E. León, Z. Liu, M. Irani and W. J. Koros, Macromolecules, 2022, 55, 1457–1473 CrossRef.
- A. F. Ismail and W. Lorna, Sep. Purif. Technol., 2002, 27, 173–194 CrossRef CAS.
- R. K. Arya, D. Thapliyal, J. Sharma and G. D. Verros, Coatings, 2021, 11, 1049 CrossRef CAS.
- N. E. Schlotter and P. Y. Furlan, Polymer, 1992, 33, 3323–3342 CrossRef CAS.
- C.-Y. Hui, K.-C. Wu, R. C. Lasky and E. J. Kramer, J. Appl. Phys., 1987, 61, 5137–5149 CrossRef CAS.
- R. C. Lasky, E. J. Kramer and C.-Y. Hui, Polymer, 1988, 29, 673–679 CrossRef CAS.
- T. K. Kwei and H. M. Zupko, J. Polym. Sci., Part A-2., 1969, 7, 867–877 CrossRef CAS.
- H. L. Frisch, T. T. Wang and T. K. Kwei, J. Polym. Sci., Part A-2., 1969, 7, 879–887 CrossRef CAS.
- T. T. Wang, T. K. Kwei and H. L. Frisch, J. Polym. Sci., Part A-2., 1969, 7, 2019–2028 CrossRef CAS.
- T. K. Kwei, T. T. Wang and H. M. Zupko, Macromolecules, 1972, 5, 645–646 CrossRef CAS.
- H. Odani, J. Polym. Sci., Part A-2, 1967, 5, 1189–1197 CrossRef CAS.
- T. P. Gall and E. J. Kramer, Polymer, 1991, 32, 265–271 CrossRef CAS.
- Q.-Y. Zhou, A. S. Argon and R. E. Cohen, Polymer, 2001, 42, 613–621 CrossRef CAS.
- M. Ercken, P. Adriaensens, D. Vanderzande and J. Gelan, Macromolecules, 1995, 28, 8541–8547 CrossRef CAS.
- C. J. Durning, M. M. Hassan, H. M. Tong and K. W. Lee, Macromolecules, 1995, 28, 4234–4248 CrossRef CAS.
- K. Hori, H. Matsuno and K. Tanaka, Soft Matter, 2011, 7, 10319 RSC.
- R. Lasky, E. Kramer and C. Hui, Polymer, 1988, 29, 1131–1136 CrossRef CAS.
- T. P. Gall, R. C. Lasky and E. J. Kramer, Polymer, 1990, 31, 1491–1499 CrossRef CAS.
- E. Bagley and F. A. Long, J. Am. Chem. Soc., 1955, 77, 2172–2178 CrossRef CAS.
- J. Crank, J. Polym. Sci., 1953, 11, 151–168 CrossRef CAS.
- S. Bargmann, A. T. McBride and P. Steinmann, Appl. Mech. Rev., 2011, 64, 010803 CrossRef.
- N. L. Thomas and A. H. Windle, Polymer, 1982, 23, 529–542 CrossRef CAS.
- J. C. Wu and N. A. Peppas, J. Polym. Sci., Part B: Polym. Phys., 1993, 31, 1503–1518 CrossRef CAS.
- J. Miao, M. Tsige and P. L. Taylor, J. Chem. Phys., 2017, 147, 044904 CrossRef.
- P. Lyu, Z. Ding, M. Doi and X. Man, ACS Macro Lett., 2024, 13, 483–488 CrossRef CAS.
- M. Tsige and G. S. Grest, J. Chem. Phys., 2004, 121, 7513–7519 CrossRef CAS.
- F. Pierce, D. Perahia and G. S. Grest, Macromolecules, 2009, 42, 7969–7973 CrossRef CAS.
- V. Marcon and N. F. A. van der Vegt, Soft Matter, 2014, 10, 9059–9064 RSC.
- W. L. Jorgensen, D. S. Maxwell and J. Tirado-Rives, J. Am. Chem. Soc., 1996, 118, 11225–11236 CrossRef CAS.
- A. P. Thompson, H. M. Aktulga, R. Berger, D. S. Bolintineanu, W. M. Brown, P. S. Crozier, P. J. In’T Veld, A. Kohlmeyer, S. G. Moore, T. D. Nguyen, R. Shan, M. J. Stevens, J. Tranchida, C. Trott and S. J. Plimpton, Comput. Phys. Commun., 2022, 271, 108171 CrossRef CAS.
- J. Han, R. H. Gee and R. H. Boyd, Macromolecules, 1994, 27, 7781–7784 CrossRef CAS.
- K. Yu, Z. Li and J. Sun, Macromol. Theory Simul., 2001, 10, 624–633 CrossRef CAS.
- A. Soldera and N. Metatla, Phys. Rev. E: Stat., Nonlinear, Soft Matter Phys., 2006, 74, 061803 CrossRef.
- M. A. F. Afzal, A. R. Browning, A. Goldberg, M. D. Halls, J. L. Gavartin, T. Morisato, T. F. Hughes, D. J. Giesen and J. E. Goose, ACS Appl. Polym. Mater., 2021, 3, 620–630 CrossRef CAS.
- T. G. Fox and P. J. Flory, J. Polym. Sci., 1954, 14, 315–319 CrossRef CAS.
- L.-P. Blanchard, J. Hesse and S. L. Malhotra, Can. J. Chem., 1974, 52, 3170–3175 CrossRef CAS.
- M. Tsige and G. S. Grest, J. Chem. Phys., 2004, 120, 2989–2995 CrossRef CAS.
- L. J. Fetters, D. J. Lohse, D. Richter, T. A. Witten and A. Zirkel, Macromolecules, 1994, 27, 4639–4647 CrossRef CAS.
- D. Vesely, Int. Mater. Rev., 2008, 53, 299–315 CrossRef CAS.
- H. E. Hermes, C. E. Sitta, B. Schillinger, H. Löwen and S. U. Egelhaaf, Phys. Chem. Chem. Phys., 2015, 17, 15781–15787 RSC.
- K. Umezawa, W. M. Gibson, J. T. Welch, K. Araki, G. Barros and H. L. Frisch, J. Appl. Phys., 1992, 71, 681–684 CrossRef CAS.
- W. Ogieglo, H. Wormeester, M. Wessling and N. E. Benes, Macromol. Chem. Phys., 2013, 214, 2480–2488 CrossRef CAS.
- D. Meng, K. Zhang and S. K. Kumar, Soft Matter, 2018, 14, 4226–4230 RSC.
- Y. Chai, T. Salez, J. D. McGraw, M. Benzaquen, K. Dalnoki-Veress, E. Raphaël and J. A. Forrest, Science, 2014, 343, 994–999 CrossRef CAS.
- J. Crank, The mathematics of diffusion, Clarendon Press, Oxford, 2 edn, reprint., 1976 Search PubMed.
- K.-M. Krüger and G. Sadowski, Macromolecules, 2005, 38, 8408–8417 CrossRef.
- H. Fujita, Fortschritte Der Hochpolymeren-Forschung, Springer, 2006, pp. 1–47 Search PubMed.
- T. K. Kwei and T. T. Wang, in Permeability of Plastic Films and Coatings, ed. H. B. Hopfenberg, Springer US, Boston, MA, 1974, pp. 63–71 Search PubMed.
- N. L. Thomas and A. H. Windle, Polymer, 1980, 21, 613–619 CrossRef CAS.
- G. Rossi, P. A. Pincus and P.-G. D. Gennes, Europhys. Lett., 1995, 32, 391–396 CrossRef CAS.
- C. H. M. Jacques, H. B. Hopfenberg and V. Stannett, in Permeability of Plastic Films and Coatings, ed. H. B. Hopfenberg, Springer US, Boston, MA, 1974, pp. 73–86 Search PubMed.
- J. A. Ferreira, M. Grassi, E. Gudiño and P. De Oliveira, Appl. Math. Model., 2015, 39, 194–204 CrossRef.
- H. L. Frisch, Polym. Eng. Sci., 1980, 20, 2–13 CrossRef.
- S. Prager and F. A. Long, J. Am. Chem. Soc., 1951, 73, 4072–4075 CrossRef CAS.
- S. Marais, M. Métayer, Q. T. Nguyen, M. Labbé and D. Langevin, Macromol. Theory Simul., 2000, 9, 207–214 CrossRef CAS.
- J. Wilmers and S. Bargmann, Heat Mass Transfer., 2014, 50, 1543–1552 CrossRef CAS.
Footnote |
| † Electronic supplementary information (ESI) available. See DOI: https://doi.org/10.1039/d4sm00641k |
| This journal is © The Royal Society of Chemistry 2024 |

![[thin space (1/6-em)]](https://www.rsc.org/images/entities/char_2009.gif) exp(
exp(