 Open Access Article
A multi-scale framework for predicting α-cyclodextrin assembly on polyethylene glycol axles†
Cameron D.
Smith
 a,
Chenfeng
Ke
 *b and
Wenlin
Zhang
 *a
*a
aDepartment of Chemistry, Dartmouth College, Hanover, New Hampshire 03755, USA. E-mail: wenlin.zhang@dartmouth.edu
bDepartment of Chemistry, Washington University in St. Louis, One Brookings Drive, St. Louis, MO 63130, USA. E-mail: cke@wustl.edu
First published on 8th November 2024
Abstract
Controlling the distribution of rings on polymer axles, such as α-cyclodextrin (αCD) on polyethylene glycol (PEG), is paramount in imparting robust mechanical properties to slide-ring gels and polyrotaxane-based networks. Previous experiments demonstrated that the functionalization of polymer ends could modulate the coverage of αCDs on PEG. To explore the design rule, we propose a multi-scale framework for predicting αCD assembly on bare and functionalized PEG. Our approach combines all-atom molecular dynamics with two-dimensional (2D) umbrella sampling to compute the free energy landscapes of threading αCDs onto PEG with ends functionalized by various moieties. Together with the predicted free energy landscapes and a lattice treatment for αCD and polymer diffusion in dilute solutions, we construct a kinetic Monte Carlo (kMC) model to predict the number and intra-chain distribution of αCDs along the polymer axle. Our model predicts the effects of chain length, concentration, and threading barrier on the supramolecular structure of end-functionalized polypseudorotaxane. With simple modifications, our approach can be extended to explore the design rule of polyrotaxane-based materials with advanced network architectures.
1 Introduction
Main-chain polypseudorotaxanes (PSRs) are formed by threading cyclic molecules on polymer axles, which are subsequently converted to mechanically interlocked polyrotaxanes (PRs) when the chain ends are capped.1,2 A broad range of supramolecular materials based on PRs and PSRs are emerging3 as promising materials for applications such as stimuli-responsive 3D-printed hydrogels,4,5 highly stretchable slide-ring polymer networks,6,7 and drug delivery micelles.8 A variety of macrocyclic molecules, such as crown ethers, cyclodextrins, cucurbiturils, and pillararenes have been reported to form PSR with corresponding polymer axles.9–14 The distribution of cyclic molecules along the polymer axles critically influences the bulk material properties.15,16 For example, in slide-ring gels, high coverage of ring molecules on polymer backbones significantly decreases the ring sliding distance, thus reducing mechanical properties.6,17,18 In another example, highly threaded rings facilitate good drug delivery efficiencies.19Achieving precise ring distribution and location on the polymer axle, as well as controlling their initial threading process, are highly desired in designing high-performance PSR- and PR-based materials. To this end, researchers have tried to synthesize polymers with discrete ring-binding sites.1,16 While this approach has been successfully demonstrated,16 it requires multi-step synthesis and offers limited ring distribution options. On the other hand, in one of the most extensively investigated CD-based PSRs, the threaded αCDs aggregate in various ways on the PEG axles to form PSRs at room temperature and exhibit outstanding bulk phase properties.4 Since the αCDs are highly mobile on the PEG axle, and all binding sites are identical on the PEG axle, identifying the relative locations of αCDs on the PEG is challenging. This knowledge deficiency limits the correlation of the structural understanding of the PSR material with their bulk phase properties even at an empirical level. The incomplete understanding of the structural–property relation impedes the rapid discovery of novel PSR and PR materials with enhanced performance. Molecular simulations and theoretical models may offer several key insights into the PSR assembly that are otherwise difficult for experimentalists to access, which is critical to accelerate the discovery of new PSR and PR materials with advanced architectures and properties.
Previous theoretical studies on PSR and PR formation have primarily focused on predicting the stable assembly at thermodynamic equilibrium.20–24 Researchers have used lattice methods to determine the threaded fraction of αCD based on chain length and temperature,20 and the preferential orientation of adjacent αCDs along the PEG backbone.22 Coarse-grained molecular dynamics (MD),21,24 and Monte Carlo simulations,23 have been applied to elucidate general trends in the assembly process under various experimental conditions and chain–ring interactions. However, these studies did not examine the kinetic process of PSR assembly, which has been used as an alternative route to controlling the number density and distribution of cyclic molecules threaded on axles.4
The functionalized PEG end groups modulate the αCD threading kinetics in solution, and in turn, permits a one-step method for controlling PSR coverage.4,5 Adjusting the size of the end moieties introduces a tunable free energy barrier for αCD threading. Coarse-grained MD has been used to show the influence of chain-end to macrocycle attraction on the threaded fraction of ring molecules in PSR systems.24 However, the introduction of a threading barrier on PSR assembly has not been explored. Together with the other dynamical processes, such as PEG and CD diffusion in bulk solution and ring sliding on polymer backbones, the threading barrier can modulate the overall assembly of αCDs on PEG. Kinetic modeling of the threading and backbone distribution of αCDs and ionene-6,10 has been previously reported using a kinetic Monte Carlo algorithm.12 However, this approach requires the input of experimentally determined rate constants, and the influence of diffusion of reactants in bulk solution is neglected. A robust computational framework that incorporates chemically specific information about polymer axles and cyclic molecules and predicts the assembly kinetics and time-dependent distribution of cyclic molecules on polymer backbones will help reveal the correlation between the assembly of superstructures and their macroscale properties, such as the αCD distribution to the variation of the physical properties of PSR materials.25,26
Developing such a computational tool requires a multi-scale approach. This is because the assembly events operate over disparate time scales. For example, it takes approximately 4.8 nanoseconds for a threaded αCD to slide over a PEG monomer in DMSO at 300 K,27 whereas the process for a single αCD to thread onto a methyl pyridine bolaform requires seconds to minutes,28 which exceeds the capability of direct molecular simulations. To model all the assembly events that occur at drastically different time scales, we need to combine atomistic simulations which capture the molecular design of PRs and PSRs with more coarse-grained approaches, such as event-driven kinetic Monte Carlo (kMC). kMC approximates the reaction master equation through stochastically integrating the rates of different events,29–31 and has routinely been implemented to model the rare events in polymerization,32 early silicate formation,33 and catalysis.34 Such a general multi-scale computational approach, however, is still underdeveloped for PSR assembly.
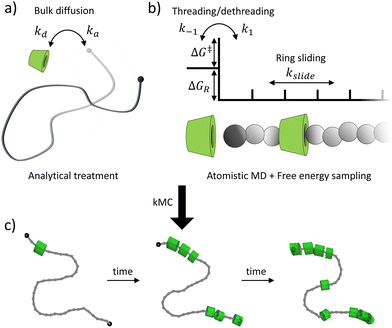
In this work, we develop a multi-scale framework to predict the assembly of αCDs onto functionalized PEG axles in dilute aqueous solutions (Fig. 1). Our model captures the three key assembly processes, including the diffusion of αCDs and polymers, threading and dethreading of αCDs across the chain ends, and the rearrangement of αCDs on polymer backbones. We apply a lattice approximation to treat the diffusion of reactants in solutions, which incorporates the effects of concentration and polymer length on the assembly without the need for explicit Brownian dynamics. We implement umbrella sampling in all-atom molecular dynamics simulations in conjunction with the weighted histogram analysis method (WHAM) to elucidate the two-dimensional (2D) potential of mean force (PMF) surface of threading potential functional groups through an αCD cavity. The small molecule free energy sampling enables us to validate our chosen force field by comparing the theoretically determined binding constant to experimental results and provides the reaction barrier and the resulting threading and dethreading rates introduced by end-group functionalization. Finally, adapting an established method that investigated the sliding motion of αCDs along a PEG backbone in DMSO,27 we obtain the sliding rate of αCDs along PEG backbones in water. By incorporating each step into a bottom-up event-driven kMC method, we develop a framework to guide the rational design of end-group functionalization for PSR assembly.
To demonstrate our approach, we quantify the roles of free energy barrier, concentration, and chain length in the assembly of PSRs consisting of bare and functionalized PEG. Our results indicate a weaker effect of single chain-end functionalization on PSR assembly than that observed in experimental turbidity measurements.4 The single chain-end functionalization only weakly impedes αCDs threading and the precipitation of PSRs is primarily governed by crystallization. Modeling PSR crystallization, however, is beyond the scope of this manuscript. Nonetheless, we show that two-end functionalization can tune the treading kinetics and permit modulating the assembly of αCDs on PEG axles. The PSR formation on PEG with both chain-ends functionalized is diffusion-controlled at low threading barriers before transitioning to a reaction-controlled regime. Concentration and chain length govern the value of the critical free energy barrier. When the free energy barrier of threading imposed by the functional ends is sufficiently large, the characteristic time for αCD aggregate formation along the PEG backbone is comparable to the crystallization time of PSRs. By correlating the aggregate formation time with the functional ends of PEG, our predictions qualitatively agree with previous turbidity measurements.4
Our model provides an efficient prediction of the effect of polymer axle design on the time-dependent distributions and number density of αCDs on PSR backbones. For example, we extend our model to predict PSR assembly on polymer backbones with intrachain functionalization, which has found experimental applications8,16 and undergone theoretical analysis.35 We show that free energy barriers installed in the interior part of polymer axles can lead to the formation of pseudo-dumbbell PSRs, with two barriers forming a protected interior region, and higher-order functionalization can provide a linear density gradient along the backbone. Overall, the tool we develop here permits the prediction of the time-dependent distribution of cyclic molecules on polymer axles and thus helps researchers design and optimize PSR-based materials for various applications.
2 Methods
2.1 Molecular dynamics simulations
We employed all-atom molecular dynamics (MD) simulations using GROMACS36 to compute the free energy of host–guest complexation between αCDs and a selection of molecules, and the diffusion of αCDs along an infinite PEG axle. The force field models are CHARMM3637 and TIP3P water model.38 Previous studies have shown the suitability of the force field and water model in applications to native cyclodextrins.39 Force field parameters for all molecules were obtained from CGenFF.40–42 A cut-off distance of 1.2 nm was applied to the short-range interactions and the particle mesh Ewald method computed the long-range electrostatic interactions.43 With LINCs constraining all bonds to hydrogen,44 a time-step of 2 femtoseconds was used for all simulations.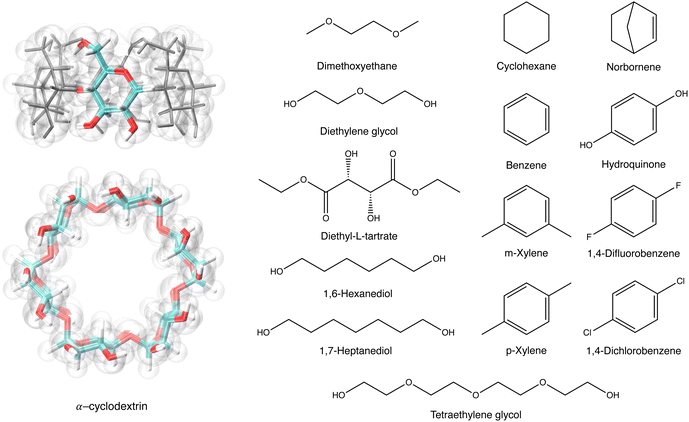 | ||
| Fig. 2 The structures of αCD, with a highlighted α-glucoside, and 14 guest molecules. The tapered rim of the αCD is the primary face, and the wider rim is the secondary face. | ||
Systems were initially equilibrated in an NVT ensemble at 300 K with the stochastic velocity rescale thermostat (v-rescale)45 for 100 ps, followed by a 100 ps NPT equilibration at 300 K and 1 bar with the v-rescale thermostat and Berendsen barostat,46 respectively. Under the same NPT conditions, a harmonic potential ranging from 4000 to 8000 kJ mol−1 nm−2 was applied to the COM of the small molecule and used to pull the molecule along the x-axis at a rate of 0.001 nm ps−1, through the αCD's cavity, to the dummy atom on the other side. The heavy atoms of the αCD were restrained with a 1000 kJ mol−1 nm−2 potential during the pulling simulations to retain the threading orientation along the x-axis. The strength of the pulling potential was dictated by the size of the small molecule and chosen to give sufficient configurations along the pulling coordinate. Conformations were extracted at a minimum of every 0.1 nm along the reaction coordinate, where more bulky small molecules required increased sampling when in the cavity of the αCD (see ESI†). This resulted in a minimum of 29 separate conformations along the x-axis.
To sample PMF in the radial direction, additional conformations were created by shifting the displacement of the small molecule COM from the threading axis of αCD from 0.0 to 0.3 nm, in steps of 0.1 nm, with a harmonic potential of 200 kJ mol−1 nm−2. The heavy atom position restraints on the αCD were removed before equilibration and production runs to allow the molecule to deform during sampling. The orientation of αCD, parallel to the threading axis, was maintained by imposing a constraint between the dummy atom and COM of the oxygen atoms attached to carbon 2 in each glucoside. Each window underwent NVT and NPT equilibration with harmonic potentials used to maintain the x-axis and radial displacement using the aforementioned parameters. This resulted in a minimum of 116 umbrella windows with collective variables in the x-axis (ζx) and radial displacement (ζr) for 2D free energy sampling, as seen in Fig. 3.
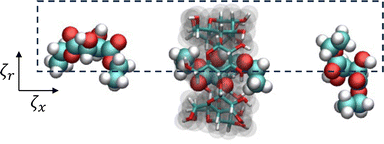 | ||
| Fig. 3 A schematic representation of the collective variables used for 2D umbrella sampling of diethyl-L-tartrate and αCD complexation. | ||
For umbrella sampling, each window underwent 20 ns production runs at 300 K and 1 bar using the v-rescale thermostat and Parrinello–Rahman barostat,47,48 respectively. An umbrella potential of 200 kJ mol−1 nm−2 was used to maintain the radial displacement (ζr) for all simulations, while potentials ranging from 2000 to 8000 kJ mol−1 nm−2 (see ESI†) were used along the threading coordinate (ζx) to ensure neighboring sampling windows sufficiently overlapped. During umbrella sampling, we allow the relative orientation of the small molecules with regard to the αCD to fluctuate freely. When unthreaded, the relative orientation is random, representing the maximum orientational entropy. Once the αCD threads onto the functional moiety, the relative orientation becomes restricted. Thus, our sampled PMF includes the reduction in orientational entropy for threading the αCD. For each system, the integrated autocorrelation time of displacement along ζx was determined for each sampling window, at ζr = 0 nm, using the GROMACS g_wham functionality.49 The largest integrated autocorrelation time was approximately 660 ps for 1,7-heptanediol, indicating 20 ns is a sufficient sampling time for each window. The 2D weighted histogram analysis method (WHAM)50 was used to recover the underlying PMF along the collective variables of the inclusion complexes.
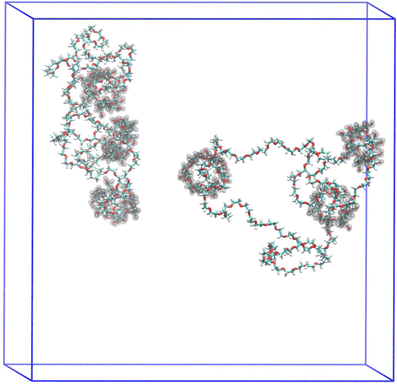
![[thin space (1/6-em)]](https://www.rsc.org/images/entities/char_2009.gif) 000 water molecules.
000 water molecules.
The system was initially equilibrated in an NVT ensemble at 300 K, 330 K, and 360 K with the v-rescale thermostat for 10 ns. Followed by NPT equilibration at 1 bar with the v-rescale thermostat and Berendsen barostat for 100 ns. A biasing potential was retained on the COM of the αCDs and PEG monomers to prevent diffusion along the PEG backbone during both equilibration runs. An autocorrelation time of the radius of gyration for each rPR was determined to be less than 1 ns from the NPT runs, ensuring each system had been sufficiently equilibrated.
Production runs of 400 ns were performed at three temperatures (300 K, 330 K, and 360 K) and 1 bar using the v-rescale thermostat and Parrinello–Rahman barostat, respectively. We recorded the PEG monomer (or index) nearest to the COM of each αCD as they diffused along the backbone to determine the one-dimensional mean squared displacement (MSD1D in index2 ns−1) and compute the one-dimensional diffusion constant (D1D) and corresponding sliding rate (kslide = 2D1D).
We obtain the energy barrier for an αCD to move to a neighboring site (ΔGslide) by fitting the temperature-dependent D1D:27,51
 | (1) |
kslide = A![[thin space (1/6-em)]](https://www.rsc.org/images/entities/i_char_2009.gif) Exp[−βΔGslide] Exp[−βΔGslide] | (2) |
We assume that all processes in the assembly occur with the same factor of A in our kMC simulations.
To address the propensity for the formation and lifetime of dimers along the PEG backbone, we created a second rPR consisting of four αCDs located at monomers 25, 27, 78, and 80. The neighboring αCDs were orientated to be secondary-face to secondary-face, which is reported to be the most stable dimer configuration in PRs.22 A single rPR was placed in a 7 nm cubic box with approximately 11![[thin space (1/6-em)]](https://www.rsc.org/images/entities/char_2009.gif) 000 water molecules and subject to the same equilibration and production procedures as above at 300 K. By observing the dissociation and association of the neighboring αCDs, we shall demonstrate the stability of secondary-face to secondary-face configuration.
000 water molecules and subject to the same equilibration and production procedures as above at 300 K. By observing the dissociation and association of the neighboring αCDs, we shall demonstrate the stability of secondary-face to secondary-face configuration.
2.2 Kinetic Monte Carlo for polypseudorotaxane assembly
We simplify PSR assembly into three reactions (Fig. 1): (R1) the association and dissociation of free αCDs and polymer end groups (ME), (R2) the threading (MCDE) and dethreading of αCDs and end groups, and (R3) the diffusion from occupied site (MCDi) to an unoccupied neighboring site (Mi±1). | (R1) |
 | (R2) |
 | (R3) |
The rate constants for reactions (R2) and (R3) are determined through the Arrhenius equation k = Ae−βΔG, where the frequency factor (A) is approximated from the 1D diffusion of αCDs along the PEG backbone and assumed to be the same for all reactions, and the reaction barrier (ΔG) is determined through free energy sampling.
We first determine the system volume using the initial concentration of PEG (cPEG) and number of chains (nPEG):
 | (3) |
We treat the diffusion of reactants as a random walk on the cubic lattice. This results in the MFPT (τ) required for a species j to find a reacting neighbor of species k as:
 | (4) |
We obtain the diffusion constant of αCD by fitting experimental data.53 The PEG diffusion constant is estimated using the Zimm model:
 | (5) |
The effective volume fraction (ϕ) of each species is determined by the lattice size and Vsys:
 | (6) |
 | (7) |
 | (8) |
 | (9) |
 | (10) |
| ka = 6DNAl0 | (11) |
If we take the lattice size (l0) to be the reaction diameter of an αCD and end group, the rate constant based on the lattice approximation is consistent with the Smoluchowski reaction kinetics of the second order:56,57
| kSmol = 4πDNAσ | (12) |
The lattice treatment yields a simple expression of the dissociation rate constant. Because an associating complex is mostly surrounded by water in a dilute solution, an αCD only needs to diffuse over a lattice spacing to dissociate from a PEG end. Therefore, we write the dissociation constant as:
 | (13) |
 | (14) |
We convert our macroscopic rate constants to microscopic rate coefficients through:32
 | (15) |
 is the number of threaded αCD with a neighboring unoccupied backbone site
By tabulating all the available processes (i) and their rates (r) from the state of the system we can create a cumulative probability (p) of each possible event through:
 | (16) |
| pi−1 < ρ1 ≤ pi | (17) |
After each event, the time is advanced with a second random number (ρ2) over the range [0,1) using:
 | (18) |
This process is repeated until the PEG chain reaches a predetermined coverage of αCD.
Our kMC model coarse-grains αCDs to remove orientation dependency on the reaction barrier to threading, and any interaction between the αCDs and functional moiety once threaded onto the PEG. Single crystal structures4 and NMR studies59 of PRs show an EG![[thin space (1/6-em)]](https://www.rsc.org/images/entities/char_2009.gif) :
:![[thin space (1/6-em)]](https://www.rsc.org/images/entities/char_2009.gif) αCDs ratio of 2
αCDs ratio of 2![[thin space (1/6-em)]](https://www.rsc.org/images/entities/char_2009.gif) :
:![[thin space (1/6-em)]](https://www.rsc.org/images/entities/char_2009.gif) 1. Thus, we discretize the PEG into “sites” of two monomers which can be occupied by a single αCD. The reaction diameters of the functional moieties sampled were similar to that of a two-PEG monomers site. Therefore, we scale the pre-exponential factor A obtained from the sliding rate over a single PEG monomer by four (A/4) for the threading/dethreading reactions and the ring sliding on the more coarse-grained PEG in kMC. Lattice sites containing threaded αCDs are represented as purely repulsive barriers to prevent ring overlapping. We neglect the attraction between two successive αCDs in our model (see our justification in Results and discussion).
1. Thus, we discretize the PEG into “sites” of two monomers which can be occupied by a single αCD. The reaction diameters of the functional moieties sampled were similar to that of a two-PEG monomers site. Therefore, we scale the pre-exponential factor A obtained from the sliding rate over a single PEG monomer by four (A/4) for the threading/dethreading reactions and the ring sliding on the more coarse-grained PEG in kMC. Lattice sites containing threaded αCDs are represented as purely repulsive barriers to prevent ring overlapping. We neglect the attraction between two successive αCDs in our model (see our justification in Results and discussion).
3 Results and discussion
3.1 Small molecule complexation
The underlying 2D PMF surface of binding a small molecule to αCD's cavity was recovered from the umbrella sampling using WHAM (Fig. 5a). By exploiting the cylindrical symmetry of the complexation process, we determine the binding constant (KB) of the inclusion complexes as:60 | (19) |
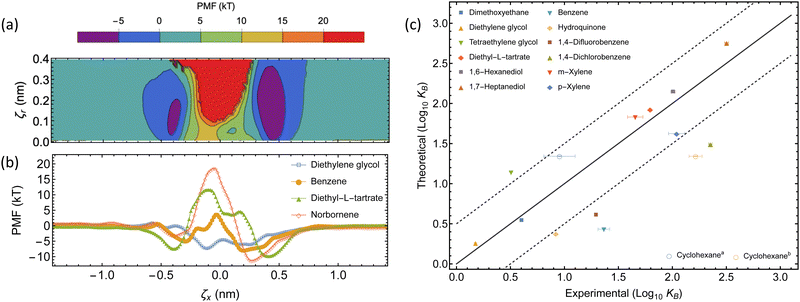 | ||
| Fig. 5 Thermodynamics of the complexation between αCD and guest molecules. (a) The underlying 2D-PMF for diethyl-L-tartrate complexation. (b) 1D PMF profiles of select guest molecules from free energy sampling. The collective variable ζx corresponds to the displacement of the COM of each molecule along the threading axis of αCD, where a negative displacement indicates the guest molecule COM is on the primary face side, relative to the COM of the αCD. (c) Comparison between experimental and theoretical binding constants. The dashed lines represent a deviation of one order of magnitude from the experimental result, within this region is considered accurate. The two experimental binding constants for cyclohexane have been separately plotted ((a) ref. 61 and (b) ref. 62). | ||
Our choice of force field successfully captures the interactions of αCDs with many small molecules in aqueous solutions (see Table 2 and Fig. 5c). The theoretically determined binding constants agree well with experimental values for the majority of linear molecules, as well as the isomers of xylene. We observe a slight over-prediction with tetraethylene glycol. Two experimental results are given for the binding constant of cyclohexane and our theoretical value agrees with the lower value of 9 M−1.61 However, the higher value (164 M−1)62 clearly follows the under-prediction trend observed with a selection of other cyclic molecules, such as benzene, hydroquinone, or halogenated benzene.
| Molecule | Binding constant (M−1) | |
|---|---|---|
| Theoretical | Experimental | |
| Dimethoxyethane63 | 3.49 ± 0.02 | 4.0 |
| Diethylene glycol63 | 1.83 ± 0.01 | 1.5 |
| Tetraethylene glycol63 | 13.9 ± 0.1 | 3.2 |
| Cyclohexane61,62 | 22.0 ± 0.1 | 9 ± 3, 164 ± 23 |
| Diethyl-L-tartrate64 | 84.1 ± 0.8 | 62.2 ± 1.4 |
| 1,6-Hexanediol65 | 140 ± 1 | 101.4 ± 4.6 |
| 1,7-Heptanediol65 | 572 ± 3 | 318 ± 13 |
| Benzene62,66–69 | 2.71 ± 0.01 | 23.2 ± 2.9 |
| Hydroquinone70 | 2.38 ± 0.01 | 8.3 |
| 1,4-Difluorobenzene71 | 4.08 ± 0.02 | 19.6 ± 0.3 |
| 1,4-Dichlorobenzene71 | 31.2 ± 0.2 | 225 ± 8 |
| m-Xylene62,67,68 | 67.8 ± 0.3 | 45.3 ± 7.4 |
| p-Xylene62,67,68 | 42.1 ± 0.2 | 109.3 ± 18.8 |
Previous studies have explored the consequence of charge transfer and induced dipole interactions in αCD host–guest chemistry.72 The stabilization of these effects would result in extended association basins in the PMF and explain the underestimation of the binding constant using fixed charge force fields. Further exploration of the use of a polarizable force field to account for the induced dipole, or density functional theory to incorporate charge transfer, may need to be investigated before applying this sampling method to polarizable or aromatic molecules. Those approaches are computationally expensive for exploring the vast design space of PSRs. We rely on the rather robust classical and efficient CHARMM36 force field to extract the free energy barrier a functional moiety will introduce to the threading of an αCD over a functionalized PEG chain end.
After validating our free energy sampling method, we extracted the 1D energy surface for threading various small molecules through the αCD cavity from the 2D surface by following the saddle path (Fig. 5b). We see asymmetric profiles due to the asymmetry of the αCD molecule, with the secondary face often resulting in a more stable configuration. By taking the difference between the free energy peak, and average depth of each basin, we can approximate the energy barrier to threading (ΔG‡) for each small molecule.
Using the value of ΔG‡ obtained through the free energy sampling of the small molecule alone omits any influence of the polymer chain on the energetics of threading, which is expected to be mild. Although PEG chains are relatively flexible in water, this polymer still exhibits a finite Kuhn length and thus is locally straight. The probability of a long PEG chain bending over (as a hairpin) and establishing close contact with a threaded or nearly threaded CD is rare.73 We believe that any additional steric effects introduced by the chain itself may only result in a slight impediment for CD threading onto the functional groups.
The purely attractive PMF of the diethylene glycol indicates that an unfunctionalized PEG has no barrier for threading, and that the limiting factor in the assembly of αCDs on unfunctionalized PEG axles is the diffusion of reactants in solutions and the redistribution of αCDs along the backbone. For bulkier end groups, our method predicts the threading barriers to be about 10 kT, 20 kT, and 26 kT for benzene, diethyl-L-tartrate, and norbornene, respectively. The large free energy barrier permits norbornene to act as an effective end-group for modulating the αCD threading and imparting excellent mechanical properties to PSR-based hydrogels in experiments.4
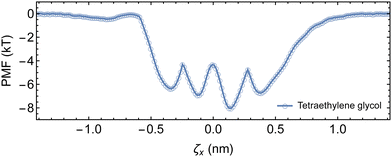
While the theoretical binding constant for tetraethylene glycol exceeds the experimentally determined value, the 1D energy surface of complexation provides an estimation for the ΔGR required for the kMC (Fig. 6). A minimum of −8 kT is recovered, with neighboring minima of approximately −7 kT, and barriers ranging from 2.6 to 3.7 kT separating the minima. We use ΔGR = −8 kT in the implementation of the kMC as small variations in ΔGR only impose negligible differences on the assembly kinetics (see ESI†).
3.2 Intrachain diffusion
| MSD1D(t) = 〈(i(t) −i(t + Δt))2〉 | (20) |
Fitting the temperature-dependent diffusion coefficients with eqn (1) yielded an energy barrier of 10.9 ± 0.7 kJ mol−1 (4.4 ± 0.3 kT), which is slightly higher than previous free energy sampling results of 8.37 kJ mol−1 in water,22 and the diffusion method in DMSO at 8.92 kJ mol−1.27 Nonetheless, the activation energy barrier is also comparable to the barrier of 3.7 kT recovered from umbrella sampling the complexation of tetraethylene glycol with αCD.
The average time (![[t with combining macron]](https://www.rsc.org/images/entities/i_char_0074_0304.gif) ) required for an αCD to jump to a nearby site is
) required for an αCD to jump to a nearby site is ![[t with combining macron]](https://www.rsc.org/images/entities/i_char_0074_0304.gif) = 1/2D1D.75 Therefore, we can calculate the backbone sliding rate (kslide = 2D1D) as 4.6 × 10⁸ Hz. Incorporating Gslide and kslide into eqn (2) allows us to approximate the pre-exponential factor (A) as 3.6 × 10¹⁰ Hz.
= 1/2D1D.75 Therefore, we can calculate the backbone sliding rate (kslide = 2D1D) as 4.6 × 10⁸ Hz. Incorporating Gslide and kslide into eqn (2) allows us to approximate the pre-exponential factor (A) as 3.6 × 10¹⁰ Hz.
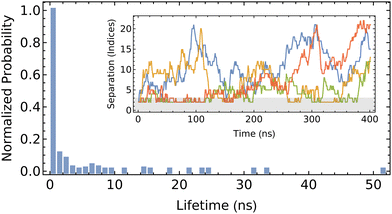 | ||
| Fig. 8 Probability of the lifetime of CD dimers on PEG. Inlay shows the separation of each pair through the 400 ns trajectory, with the gray region indicating the range used to identify a dimer. | ||
We define the formation of a dimer as when the two centers of mass are located three monomers-or-less apart (approximately 1.2 nm, in comparison to the height of αCD of 0.8 nm). The fleeting nature of the dimer is evident from the high propensity to exhibit a short pairing lifetime, which is generally restricted to less than 10 ns. The detailed trajectory indicates that dimer formation is transient, which is not consistent with previous modeling of the free energy of association.22 Discrepancies between the present work and that of Liu et al.22 may be attributed to their use of force field, CHARMM27, which has not been validated for accuracy in modeling αCD, or the free energy analysis method. Their methodology incorporated the use of positional restraints on the PEG backbone oxygen atoms to expedite the convergence of the free-energy calculations. These added restraints to retain the unphysical rod-like structure of the PEG would underestimate the orientational entropy loss upon dimer formation (which forces two Kuhn segments of PEG to align uniaxially), and in turn over-predict the binding and stability between the two successive αCDs. The imposed rod-like structure of the PEG stemming from the positional restraints can also explain the lower energy barrier for CD sliding obtained through the same free energy sampling method.
While the formation of dimers in the present work does appear to be somewhat favorable, the short lifetime of the pairs only imparts minimal influence in the overall assembly of large PSRs. The diffusion of reactants in the dilute solutions and the slow threading rate across functional ends dominate the overall assembly kinetics. Thus, we omit the attraction between neighboring αCDs along PEG backbones in our current kMC simulations. When the pair-wise interactions between neighboring rings become significant and ring sliding becomes slow on more exotic polymer axles, our kMC can be easily modified to promote the formation of small aggregates of rings on the polymer backbones.
3.3 Polypseudorotaxane assembly
We then combined the lattice treatment of bulk diffusion with the all-atom MD results to build a kMC to model the assembly process of PSRs with various threading barriers, concentrations, and chain lengths. Input parameters that are constant for all kMC runs are given in Table 3.| Parameter | Value |
|---|---|
| A | 3.6 × 10¹⁰ Hz |
| l 0 | 1.0 nm |
| ΔGR | −8.0 kT |
| ΔGslide | +4.4 kT |
The initial threading and propagation of αCDs along the polymer axle with several increasing barriers are shown in Fig. 9. The unfunctionalized assembly progresses as expected, with equivalent migration of rings from both ends of the polymer which quickly reach a uniform distribution along the backbone and saturation after approximately 10 μs. A more asymmetric profile is created when the threading barrier is increased to 5 kT, where there is a significant drop in the propensity for threading to occur on the functionalized end. The result is a higher density of αCDs on the bare end and a delay in forming a uniform distribution along the polymer axle. Further increasing the barrier to 10 kT results in the exclusive threading from the unfunctionalized end and a more pronounced delay in the formation of a uniform backbone distribution.
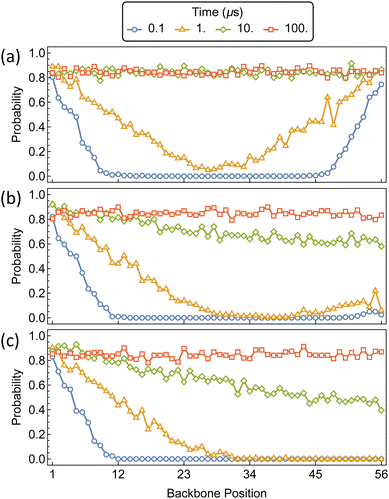 | ||
| Fig. 9 Probability distributions of αCDs migration along a bare PEG5k backbone (a) and monofunctionalized PEG5k with a threading barrier of 5 kT (b) and 10 kT (c) located at position 56. | ||
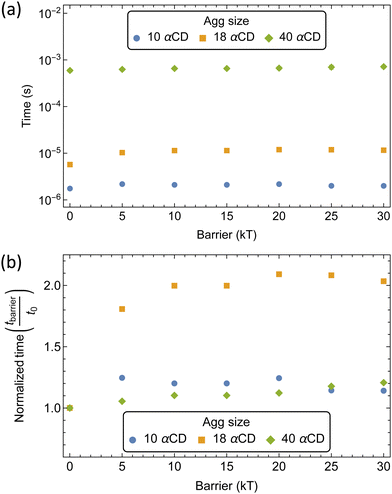
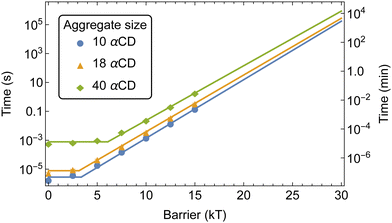
We extracted the mean first passage time (MFPT) of the formation of αCD clusters along the polymer backbone which are required to seed the crystallization of PSRs (Fig. 10a). Aggregate sizes of 10, 18, and 40 αCDs were chosen as they match the approximate sizes of the PSR crystal lamellae obtained from small-angle X-ray scattering (SAXS) data at comparable concentrations.4
The increase in threading barrier on monofunctionalized PEG mildly impacts the formation of αCD aggregates, with slight delays of 10 to 100% in the time required to form groups of 10, 18 or 40 αCDs (Fig. 10b). We attribute the weak influence of a single functionalized end to the presence of an excess of αCDs in solution and the rapid dissociation when an αCD encounters a significant barrier at the functionalized end. While a functional group may delay the rate of threading from the blocked end indefinitely, the unfunctionalized end is readily accessible to αCDs due to the fast backbone diffusion liberating the unfunctionalized end once a threading event has occurred.
The modest influence on the formation of groups of 10 αCD is due to the small size of the aggregate, which mostly formed near the chain ends. Rapid threading of αCD at the bare PEG end allows for the efficient formation of small aggregates with the supply of freshly threaded αCDs from one single chain end. The formation of larger aggregates, such as 18 αCDs, however, benefit from the supply of rings from both chain ends. As a consequence, blocking one polymer end impacts the assembly of 18 αCDs more significantly. Finally, to form large aggregates of 40 rings that cover the entire polymer backbone, the rate-limiting step becomes the shuffling of large aggregates to evacuate a chain end for treading fresh αCDs from the solution. As a consequence, the monofunctionalization only mildly impacts the MFPT of the formation of aggregates of 40 αCDs on the PEG chains.
In experimental characterization, the solution transmittance is monitored to infer the assembly rate of PSRs through the formation of PSR crystals.76 Experimental turbidity measurements of monofunctionalized PEG show the transmittance drop to 90% in approximately 15, 105, and 130 minutes for –OH, norbornene, and adamantane functionalization, respectively.4 This indicates a more noticeable effect of monofunctionalization of PEG on crystal formation. Contrarily, the kMC shows a limited effect of monofunctionalization on CD aggregate formation along the PEG backbone. The discrepancy may arise from the effects of functional ends on PSR crystallization. For example, when PSRs crystallize, we expect some end groups, such as norbornene and adamantane, to pack at the crystal surface in the stem direction. The hydrophobic moieties may enhance the interfacial free energy of the crystal/solution interfaces, and in turn, increase the nucleation barrier for a cylindrical nucleus:77
 | (21) |
The initial threading and propagation of αCDs along the bifunctionalized polymer axle with increasing barriers are shown in Fig. 11. The introduction of a 5 kT barrier causes a slight retardation in the threading and propagation of αCD to the interior of the chain when compared to the unfunctionalized PEG (Fig. 9a). A uniform backbone distribution is recovered at 10 μs, as with unfunctionalized PEG, however, we see an order of magnitude delay in backbone saturation at approximately 100 μs. The effect of 10 kT barriers on the assembly of PSR is notably different from the lower barriers because the process of threading is delayed significantly compared to the rate of propagation along the backbone. This results in sparsely covered PEG axles with uniform distribution and high αCD mobility before saturation occurs.
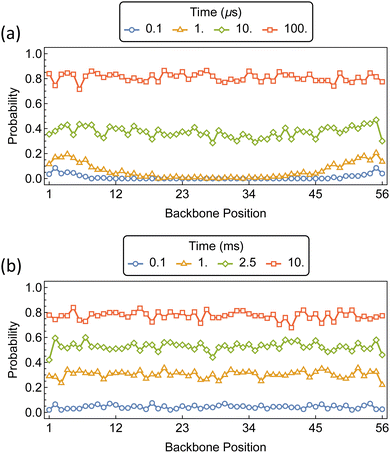 | ||
| Fig. 11 Probability distributions of αCDs migration along a bifunctionalized PEG5k backbone with barriers at position 1 and 56. Barrier sizes are (a) 5 kT, and (b) 10 kT. | ||
With the addition of threading barriers to both ends of the PEG, PSR formation follows two distinct regimes: diffusion-limited (DL) at lower barriers, and reaction-controlled (RC) after the treading barrier exceeds a critical value where the MFPT for αCDs aggregate formation t ∼ Exp[−ΔG‡] (Fig. 12). Fitting the MFPT of aggregate formation with a piecewise function allowed us to approximate the effective reaction barrier at which the assembly transitions from DL to RC. The critical barrier value is slightly aggregate size dependent, with the transition for the assembly of 10 αCDs occurring around 3 kT and increasing to approximately 6 kT for aggregates of 40.
The kMC indicated that barriers of 20 kT or higher are required to result in a delay of greater than a few seconds to the assembly of αCD aggregates at experimental concentrations. Norbornene can effectively modulate the number density of CD on PEG and result in robust hydrogel.4 Our free energy calculations indicated that the introduction of a norbornene moiety to both PEG ends would result in a threading barrier of approximately 26 kT (Fig. 5b). Extrapolating the MFPT to a barrier of 26 kT gives MFPT of 70 minutes to produce aggregates of 10 αCDs, 120 minutes for 18 αCDs, and 440 minutes for a group of 40 αCDs to form.
Time-dependent isolation and 1H NMR analyses of PSRs formed between PEG5k-(Nor)2 and αCD at 2 mM and 100 mM, respectively, determined it took approximately 400–500 minutes to form crystalline precipitates of norbornene-functionalized PSRs with an average of 36 threaded αCD per chain.4 There is a qualitative agreement between the assembly time recovered from our model and the experimental crystallization time. The slight under-prediction of our kMC model compared to the turbidity measurement may again arise from the hindered crystallization kinetics. Nonetheless, the assembly time of αCDs on bifunctionalized PEG exceeds the characteristic crystallization time for PSRs consisting of bare PEG5k backbones, of order 15 minutes, indicating that bifunctionalization could help effectively modulate the molecular assembly of PSRs through competition with PSR crystallization.
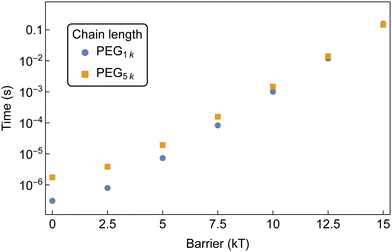 | ||
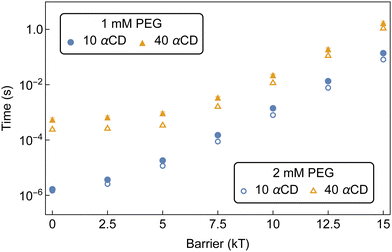
| Fig. 14 MFPT for the formation of an aggregate of 10 αCDs to form on a bifunctionalized PEG with increasing threading barriers. Both chain lengths are sampled at 1 mM PEG and 50 mM αCD. | ||
The disparity at lower barriers can be attributed to the higher diffusion rate of shorter chains in solution, as well as the reduced backbone sliding required by αCDs to find partners. This results in a more rapid formation of aggregates along the shorter chain. The diminishing chain length effect at higher threading barriers is due to the threading rate becoming slow enough to allow the threaded αCDs to explore increasingly larger regions of the backbone. Here, the formation of aggregates is controlled by the number of threaded molecules and less affected by the αCD diffusion along PEG backbones.
Additionally, with an equivalent number of αCD on each chain, there is a higher probability that the PEG1k end group is occupied compared to the PEG5k. This effectively decreases the concentration of free chain ends and lowers the rate of threading on the shorter chains.
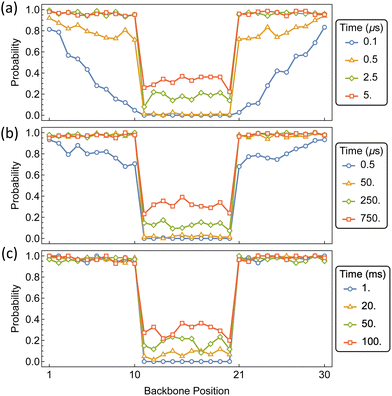
The formation of primary domains on the outer portions of the polymer, which are readily occupied by αCD, and a secondary domain on the interior region of the polymer, guarded by a diffusion barrier, will facilitate the assembly of pseudo-dumbbell PSRs. Our system represents a 60 monomer PEG chain consisting of 30 backbone positions, with barriers for jumping between position 10 and 11, and 20 and 21. Each chain end remains barrier free in accordance with bare PEG chain ends.
The time-dependent distribution of αCDs along the polymer backbone is shown in Fig. 15 for barriers of 10, 15, and 20 kT. As expected from the assembly kinetics of αCDs onto a bare PEG chain, a rapid coverage of the exterior regions occurs for each internal barrier. For barriers of 10 kT, which is approximately double the barrier to backbone diffusion, the internal region becomes populated before the dumbbell domains become saturated. For barriers of 15 kT and higher, the outer portions become saturated before the αCDs begin to traverse the internal barrier to occupy the central region. Increasing the barrier to 15 kT slows the migration by orders of magnitude, requiring about 250 μs for the presence of an αCD in the interior. Whereas a barrier 20 kT requires 50 ms for there to be a significant presence of αCD located on the interior portion of the PSR.
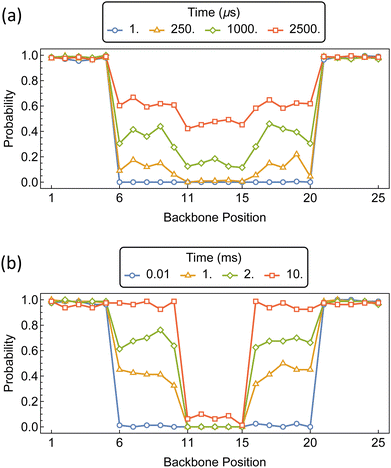
Increasing the number of “speed bumps” can create PSRs with a coverage gradient along the polymer backbone. We create a 50 mer PEG chain consisting of 25 backbone positions, with barriers for jumping between positions 5 and 6, 10 and 11, 15 and 16, and 20 and 21. This forms primary, secondary, and tertiary domains along the polymer backbone. Each chain end remains barrier-free in accordance with bare PEG chain ends.
The distributions of αCD during the assembly of the PSRs are shown in Fig. 16. Imposing equivalent barriers of 15 kT at each position imparts a slight gradient in αCD concentration along the polymer backbone. As with the PSR pseudo-dumbbells, the outer regions are rapidly saturated. After the secondary and tertiary domains of the polymer begin to populate, we see an increased probability of approximately 0.2 that the αCD will occupy the secondary domains, compared to the internal region.
If we retain the 15 kT barriers to the secondary domains and increase the barriers to the tertiary region to 20 kT, we see a dramatic increase in the disparity of αCD concentration along the polymer backbone. The secondary domains reach saturation before the tertiary region of the polymer begins to populate.
Exercising control of macrocycle distribution along the polymer axle has also been accomplished through the use of block copolymers,1,16 and coarse-grained modeling methods have been recently applied to such systems.15 Our kMC can be adapted to further explore the PSR design space through the incorporation of variable backbone diffusion rates, as described in the example kMC script included in the ESI.† However, we restrict ourselves to functionalized PEG and leave modeling the block copolymer assembly as a possible extension to our current work.
4 Conclusions
We have developed a multi-scale model that can predict the assembly of polypseudorotaxanes on mono- and bifunctionalized polyethylene glycol chains in dilute solutions. In our work, two-dimensional free energy sampling was used to validate the CHARMM36 force field in applications to host–guest complexation, with satisfactory thermodynamic results for a range of molecules with αCDs when compared to experimental binding constants. The free energy sampling in atomistic simulations allows us to predict the free energy barriers for threading αCDs onto PEG with different chain ends. Our free energy data is combined with αCD-on-PEG axle diffusion, and a lattice approximation to reactant diffusion, to develop an event-driven kinetic Monte Carlo for PSR assembly.We find that functionalization of both PEG ends causes delays in the assembly process of PSRs when the resultant barrier exceeds a certain threshold value. The reaction barrier needs to be significant, about 20 kT, to have a noticeable influence on assembly. Our multi-scale simulations predict that PSR with aggregates of 40 αCDs would take approximately 400 minutes to form, which matches experimentally determined crystallization times and is significantly longer than the characteristic crystallization time for PSR based on bare PEG backbones. Our prediction confirms the prior experimental speculation that norbornene functionalization can kinetically modulate the assembly and αCDs distribution on PEG, and in turn enhance the material properties of PSR-based hydrogels.
Finally, we show that our kMC can be adapted to introduce intrachain functionalization and provide an avenue for modeling the assembly and redistribution of macrocycles with novel axle architectures. With additional parameterization, our coarse-grained model is transferable to other systems and permits the exploration of other molecular designs, such as PSR synthesized using block copolymers.
Author contributions
Cameron D. Smith: data curation, formal analysis, methodology, software, visualization, original draft, review and editing. Chenfeng Ke: conceptualization, funding acquisition, project administration, review and editing. Wenlin Zhang: conceptualization, funding acquisition, methodology, project administration, software, resources, supervision, validation, review and editing.Data availability
Data for this article, including example kMC Mathematica scripts, are available in the ESI.†Conflicts of interest
There is no conflict of interest to declare.Acknowledgements
This work is supported by the Basic Energy Sciences program of the US Department of Energy (DOE) (DE-SC0022267).References
- J. S. Seale, Y. Feng, L. Feng, R. D. Astumian and J. F. Stoddart, Chem. Soc. Rev., 2022, 51, 8450–8475 RSC.
- L. F. Hart, J. E. Hertzog, P. M. Rauscher, B. W. Rawe, M. M. Tranquilli and S. J. Rowan, Nat. Rev. Mater., 2021, 6, 508–530 CrossRef CAS.
- S. Ghiassinejad, M. Ahmadi, E. van Ruymbeke and C. A. Fustin, Prog. Polym. Sci., 2024, 155, 101854 Search PubMed.
- Q. Lin, L. Li, M. Tang, S. Uenuma, J. Samanta, S. Li, X. Jiang, L. Zou, K. Ito and C. Ke, Chem, 2021, 7, 2442–2459 CAS.
- M. Zhang, W. Liu, Q. Lin and C. Ke, Small, 2023, 19, 2300323 Search PubMed.
- L. Jiang, C. Liu, K. Mayumi, K. Kato, H. Yokoyama and K. Ito, Chem. Mater., 2018, 30, 5013–5019 Search PubMed.
- K. Ito, Polym. J., 2007, 39, 489–499 CrossRef CAS.
- A. Tamura, H. Tanaka and N. Yui, Polym. Chem., 2014, 5, 4511–4520 Search PubMed.
- A. Harada and M. Kamachi, Macromolecules, 1990, 23, 2821–2823 CrossRef CAS.
- A. Harada and M. Kamachi, J. Chem. Soc., Chem. Commun., 1990, 1322–1323 RSC.
- H. W. Gibson and H. Marand, Adv. Mater., 1993, 5, 11–21 CrossRef CAS.
- W. Herrmann, B. Keller and G. Wenz, Macromolecules, 1997, 30, 4966–4972 Search PubMed.
- S. Loethen, J. M. Kim and D. H. Thompson, Polym. Rev., 2007, 47, 383–418 CrossRef CAS.
- L. Zhou, S. Cao, C. Liu, H. Zhang and Y. Zhao, Coord. Chem. Rev., 2023, 491, 215260 CrossRef CAS.
- Y. Wang, H. Lu, X. M. Jia, A. C. Shi, J. Zhou, G. Zhang and H. Liu, Macromolecules, 2024, 57, 1846–1858 CrossRef CAS.
- H. Masai, Y. Oka and J. Terao, Chem. Commun., 2022, 58, 1644–1660 RSC.
- J. Mao, X. M. Jia, G. Zhang and J. Zhou, Macromolecules, 2023, 57, 3841–3849 CrossRef.
- S. Uehara, Y. Wang, Y. Ootani, N. Ozawa and M. Kubo, Macromolecules, 2022, 55, 1946–1956 CrossRef CAS.
- C. J. Collins, Y. Mondjinou, B. Loren, S. Torregrosa-Allen, C. J. Simmons, B. D. Elzey, N. Ayat, Z. R. Lu and D. Thompson, Biomacromolecules, 2016, 17, 2777–2786 CrossRef CAS PubMed.
- Y. Okumura, K. Ito and R. Hayakawa, Polym. Adv. Technol., 2000, 11, 815–819 CrossRef CAS.
- N. Urakami, J. Imada and T. Yamamoto, J. Chem. Phys., 2010, 132, 054901 CrossRef PubMed.
- P. Liu, C. Chipot, X. Shao and W. Cai, J. Phys. Chem. C, 2012, 116, 17913–17918 Search PubMed.
- T. Furuya and T. Koga, Polymer, 2017, 131, 193–201 Search PubMed.
- X. Cai, H. Liu and G. Zhang, Polymer, 2023, 268, 125705 CrossRef CAS.
- K. L. Liu, J. L. Zhu and J. Li, Soft Matter, 2010, 6, 2300–2311 Search PubMed.
- S. Uenuma, R. Maeda, K. Kato, K. Mayumi, H. Yokoyama and K. Ito, ACS Macro Lett., 2019, 8, 140–144 CrossRef CAS PubMed.
- Y. Yasuda, Y. Hidaka, K. Mayumi, T. Yamada, K. Fujimoto, S. Okazaki, H. Yokoyama and K. Ito, J. Am. Chem. Soc., 2019, 141, 9655–9663 CrossRef CAS PubMed.
- R. D. Porasso, M. I. Sancho, M. Parajó, L. García-Río and R. D. Enriz, Phys. Chem. Chem. Phys., 2022, 24, 1654–1665 Search PubMed.
- D. T. Gillespie, J. Comput. Phys., 1976, 22, 403–434 CrossRef CAS.
- D. T. Gillespie, J. Phys. Chem., 1977, 81, 2340–2361 Search PubMed.
- K. A. Fichthorn and W. H. Weinberg, J. Chem. Phys., 1991, 95, 1090–1096 CrossRef CAS.
- D. R. D'hooge, A. D. Trigilio, Y. W. Marien and P. H. van Steenberge, Ind. Eng. Chem. Res., 2020, 59, 18357–18386 Search PubMed.
- M. Ciantar, C. Mellot-Draznieks and C. Nieto-Draghi, J. Phys. Chem. C, 2015, 119, 28871–28884 Search PubMed.
- M. Pineda and M. Stamatakis, J. Chem. Phys., 2022, 156, 120902 Search PubMed.
- K. Li, L. He and L. Zhang, Polymer, 2024, 292, 126632 Search PubMed.
- M. J. Abraham, T. Murtola, R. Schulz, S. Páll, J. C. Smith, B. Hess and E. Lindah, SoftwareX, 2015, 1–2, 19–25 Search PubMed.
- R. B. Best, X. Zhu, J. Shim, P. E. M. Lopes, J. Mittal, M. Feig and A. D. MacKerell, J. Chem. Theory Comput., 2012, 8, 3257–3273 CrossRef CAS PubMed.
- D. J. Price and C. L. Brooks, J. Chem. Phys., 2004, 121, 10096–10103 CrossRef CAS PubMed.
- J. Gebhardt, C. Kleist, S. Jakobtorweihen and N. Hansen, J. Phys. Chem. B, 2018, 122, 1608–1626 CrossRef CAS PubMed.
- K. Vanommeslaeghe, E. Hatcher, C. Acharya, S. Kundu, S. Zhong, J. Shim, E. Darian, O. Guvench, P. Lopes, I. Vorobyov and A. D. Mackerell, J. Comput. Chem., 2009, 31, 671–690 CrossRef PubMed.
- K. Vanommeslaeghe and A. D. MacKerell, J. Chem. Inf. Model., 2012, 52, 3144–3154 CrossRef CAS PubMed.
- K. Vanommeslaeghe, E. P. Raman and A. D. MacKerell, J. Chem. Inf. Model., 2012, 52, 3155–3168 CrossRef CAS PubMed.
- T. Darden, D. York and L. Pedersen, J. Chem. Phys., 1993, 98, 10089–10092 Search PubMed.
- B. Hess, H. Bekker, H. J. C. Berendsen and J. G. E. M. Fraaije, J. Comput. Chem., 1997, 18, 1463–1472 CrossRef CAS.
- G. Bussi, D. Donadio and M. Parrinello, J. Chem. Phys., 2007, 126, 014101 CrossRef PubMed.
- H. J. C. Berendsen, J. P. M. Postma, W. F. van Gunsteren, A. DiNola and J. R. Haak, J. Chem. Phys., 1984, 81, 3684–3690 CrossRef CAS.
- M. Parrinello and A. Rahman, J. Appl. Phys., 1981, 52, 7182–7190 Search PubMed.
- S. Nosé and M. Klein, Mol. Phys., 1983, 50, 1055–1076 Search PubMed.
- J. S. Hub, B. L. de Groot and D. van der Spoel, J. Chem. Theory Comput., 2010, 6, 3713–3720 Search PubMed.
- A. Grossfield, WHAM: the weighted histogram analysis method, version 2.0.10, https://membrane.urmc.rochester.edu/wordpress/?page_id=126 Search PubMed.
- Y. Yasuda, M. Toda, K. Mayumi, H. Yokoyama, H. Morita and K. Ito, Macromolecules, 2019, 52, 3787–3793 CrossRef CAS.
- J. Kestin, M. Sokolov and W. A. Wakeham, J. Phys. Chem. Ref. Data, 1978, 7, 941–948 CrossRef CAS.
- A. C. Ribeiro, A. J. Valente, C. I. Santos, P. M. Prazeres, V. M. Lobo, H. D. Burrows, M. A. Esteso, A. M. Cabral and F. J. Veiga, J. Chem. Eng. Data, 2007, 52, 586–590 CrossRef CAS.
- F. Kienberger, V. P. Pastushenko, G. Kada, H. J. Gruber, C. Riener, H. Schindler and P. Hinterdorfer, Single Mol., 2000, 1, 123–128 Search PubMed.
- V. Ahlawat, S. S. Rajput and S. Patil, Polymer, 2021, 230, 124031 CrossRef CAS.
- M. v Smoluchowski, Z. Phys. Chem., Stoechiom. Verwandtschaftsl., 1918, 92, 129–168 Search PubMed.
- M. B. Flegg, SIAM J. Appl. Math, 2016, 76, 1403–1432 CrossRef.
- M. Andersen, C. Panosetti and K. Reuter, Front. Chem., 2019, 7, 202 CrossRef CAS PubMed.
- A. Harada, J. Li and M. Kamachi, Macromolecules, 1993, 26, 5698–5703 CrossRef CAS.
- Y. Deng and B. Roux, J. Phys. Chem. B, 2009, 113, 2234–2246 Search PubMed.
- T. Osajima, T. Deguchi and I. Sanemasa, Bull. Chem. Soc. Jpn., 1991, 64, 2705–2709 Search PubMed.
- N. Szaniszló, E. Fenyvesi and J. Balla, J. Inclusion Phenom., 2005, 53, 241–248 CrossRef.
- K. Yoshikiyo, Y. Matsui and T. Yamamoto, Bull. Chem. Soc. Jpn., 2012, 85, 1206–1209 Search PubMed.
- P. Zhang and P. L. Polavarapu, J. Phys. Chem. A, 2007, 111, 858–871 Search PubMed.
- M. Bastos, L.-E. Briggner, I. Shehatta and I. Wadso, J. Chem. Thermodyn., 1990, 22, 1181–1190 CrossRef CAS.
- E. E. Tucker and S. D. Christian, J. Am. Chem. Soc., 1984, 106, 1942–1945 CrossRef CAS.
- I. Sanemasa and Y. Akamine, Bull. Chem. Soc. Jpn., 1987, 60, 2059–2066 Search PubMed.
- Y. Saito, K. Yoshihara, I. Tanemura, H. Ueda and T. Sato, Chem. Pharm. Bull., 1997, 45, 1711–1713 CrossRef CAS.
- Q.-x Guo, S.-h Luo and Y.-c Liu, J. Inclusion Phenom. Mol. Recognit. Chem., 1998, 30, 173–182 CrossRef CAS.
- E. Siimer, M. Kobu and M. Kurvits, Thermochim. Acta, 1990, 170, 89–95 Search PubMed.
- T. Takuma, T. Deguchi and I. Sanemasa, Bull. Chem. Soc. Jpn., 1991, 64, 480–484 Search PubMed.
- C. Yin, Z. Cui, Y. Jiang, D. Van Der Spoel and H. Zhang, J. Phys. Chem. C, 2019, 123, 17745–17756 CrossRef CAS.
- W. Zhang, S. T. Milner and E. D. Gomez, ACS Cent. Sci., 2018, 4, 413–421 CrossRef CAS PubMed.
- K. Li, Y. Wang, F. Guo, L. He and L. Zhang, Soft Matter, 2021, 17, 2557–2567 Search PubMed.
- D. L. Weaver, Biophys. J., 1982, 38, 311–313 Search PubMed.
- M. Ceccato, P. L. Nostro and P. Baglioni, Langmuir, 1997, 13, 2436–2439 CrossRef CAS.
- L. Mandelkern, Crystallization of Polymers, Cambridge University Press, 2nd edn, 2004, vol. 2 Search PubMed.
Footnote |
| † Electronic supplementary information (ESI) available: Including kinetic Monte Carlo scripts, umbrella sampling parameters, justification of ΔGR, and tabulated mean first passage time data. See DOI: https://doi.org/10.1039/d4sm01048e |
| This journal is © The Royal Society of Chemistry 2024 |

