 Open Access Article
Creative Commons Attribution 3.0 Unported Licence
Counterfactual sustainability screening – the definition and undertaking of a sustainability screening method for the assessment of defossilised supply chains†
Edward G.
Platt
 and
Peter
Styring
*
UK Centre for Carbon Dioxide Utilisation, Department of Chemical & Biological Engineering, The University of Sheffield, Sheffield, UK. E-mail: p.styring@sheffield.ac.uk
First published on 16th January 2024
Abstract
With the monumental shift in industrial interest towards sustainable, defossilised supply chains in response to the climate crisis, the understanding of alternative supply chain viability has never been more vital. As part of their Clean Future initiative, Unilever Home Care has committed to the phasing out of fossil carbon sources from their supply chains. To better assess the viability of these prospective supply chains within a quick timeframe, a counterfactual screening method has been developed which pits the performance of eleven selected sustainability indicators against a success baseline, returning a results array on the sustainability performance of these routes. This paper briefly introduces the initiatives laid out by Unilever Home Care, before undertaking a concise review on existing sustainability screening methods from the literature, with the key limitations of these methods outlined. In response to these limitations, a new methodology is then defined, with a case study of defossilised Linear Alkylbenzene Sulfonate (LAS)-appropriate olefins being applied. This study both illustrates the functionality of the methodology, as well as provides an insight into the viability of the assessed supply chains. Within the study, 18 technologies forming 18 routes were assessed, spanning green (“from plants”), grey (“from plastic waste”) and purple (“from CO2”) feedstocks (according to the carbon rainbow). General results trends suggest that green and grey routes hold much greater viability than the purple routes, given their relatively lower capital and operating costs, as well as their superior likelihood of being commercially viable by 2030. Plans for further research are also provided, with plans for results validation included.
Sustainability spotlightIn order to move towards sustainable, defossilised supply chains, it is vital for stakeholders and decision-makers to hold an understanding of a process' viability before investing in its development. This research investigates the potential for a sustainability screening method to gain a quick and early understanding of a process' sustainability potential before the application of industrially standard practices, such as life cycle assessment (LCA) and techno-economic assessment (TEA). As a framework, the application of a variety of sustainability indicators can be adopted. In the case study applied, specific indicators draw from sustainably sourced raw materials (SDGs 9 & 12), impacts of supply chains on ecosystems (SDGs 14 & 15), as well as indicators focussing on climate change (SDG 13). |
1 Introduction
As a response to the ever-growing climate crisis which threatens almost every part of modern-day society, companies are turning their efforts towards more climate-friendly supply chains. With the signing of the Paris Agreement in 2016, substantial efforts are required by both nations and corporations to mitigate the effects of climate change.1 As a result, the extensive pool of technologies that promise a utility of renewable or defossilised feedstocks is ever-growing, with new defossilised technologies making their way towards market every year.2One such company whose recent climate targets highlight this shift in attitude is Unilever Home Care, whose Clean Future initiative outlines targets to defossilise all their supply chains (a seen in the carbon rainbow, Fig. 1) and achieve net zero carbon emissions from cradle to shelf from 2039.3 These initiatives fall in line with the push for sustainable supply chains within the wider FMCG and cleaning industry, the need for which is highlighted by bodies such as the International Association for Soaps, Detergents and Maintenance Products (AISE) and their Charter for Sustainable Cleaning.4
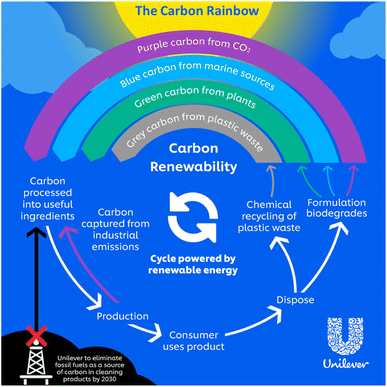 | ||
| Fig. 1 The carbon rainbow.1 | ||
As companies like Unilever look to the future of their supply chains and aim to broaden their sphere of knowledge with respect to defossilised supply chains, having an early understanding of the viability of potentially beneficial technologies both market ready and in development is paramount to achieving such climate goals. In such a case where a viability check for a large quantity of prospective supply chains is necessary, undertaking informative life cycle and technoeconomic assessments for each technology is a challenging task. These assessments also potentially hold large data requirements for technologies that may not even have inventory data for a fully scaled plant (and therefore considerable uncertainty). As a result, efforts towards a pre-LCA/TEA screening assessment have picked up in recent years, not with the intention of making final decisions, but acting to provide red or green flags for a defossilised process' viability, with their necessity already well-documented within the open literature.5
This paper reports research which investigates how these screening assessments have been approached in the past, and outlines a new type of counterfactual sustainability screening, looking to address some of the current pitfalls with existing methods.
2 Current methods and limitations of sustainability screening assessments
2.1 Existing circular supply chain screening methodologies
With regards to other sustainability screening studies, a considerable amount of effort has focussed on outlining the need for, and the development of, screening assessment methods. These generally look at different ways of providing evidence for decision-makers, using data from a variety of sources and associated process characteristics, but with the common goal of making relatively quick assessments for new technological alternatives to conventional linear feedstocks. To best understand these methodologies, build on their limitations and build on existing research, a comprehensive review of recent publications (within the last 5 years) has been undertaken.One such study, used to screen different Carbon Capture and Utilisation (CCU)-derived intermediates (hereby referred to as “the CCU study”), looked to score technological performance across nine indicators on a scale of 0–4.6 These scores were then weighted based on indicator priority, before being summated to give an overall sustainability score. The scores were assigned and cross-checked by a team of sustainability experts, using a defined scoring guide provided by the study, which looked to score indicator performance based on absolute performance. Despite the CCU study providing an informative insight into these platform chemical alternatives, the issues surrounding data quality and uncertainty proved to be limiting.6 This, alongside a sensitivity analysis undertaken to assess to what level the assessment is affected by practitioner bias, further showcases the limitations of using discrete, ex-ante data for decision-making.
Drawing inspiration from the CCU study, a similar study was used to assess defossilised routes to benzene,7 again using a scoring guide which looks to assign scores based on definite yet uncertain data against a practitioner-assigned scale. Again, this reliance on uncertain data means that, whilst still suitable for a screening according to the author,7 conclusions must be taken with a pinch of salt.
Studies performed and published by Kravchenko at DTU must also be acknowledged here.8 From this work, the need for a concise screening assessment, particularly for applications to circular economy (CE) technologies, is vast, particularly those based on forecasted sustainability impacts. These also go a long way towards defining methods for indicator selection, a key part of all sustainability assessment.
Overall, these studies provide an excellent motivation and justification for the development of sustainability screening as a decision-making aid, as well as some of the key issues with impact-centric assessments and the issues arising when assigning scores with limited data.
2.2 Multi-criteria decision making (MCDM) applications to supply chains
Within the broader field of sustainability assessment, aside from screening, research into the implication of multi-criteria decision making (MCDM) has proven highly influential, with the capability of aggregating data under uncertainty to aid decision-makers. Within the methods outlined in Section 2.1, elements of MCDM relate heavily between the methodologies, with techniques such as the analytic hierarchy process (AHP)9 and the technique for order of preference by similarity to ideal solution (TOPSIS)10 are both utilised by the screening assessments outlined in Section 2.1.The literature surrounding methods of this nature and application extensive. In reviewing the literature surrounding these methods, it can be seen that these methodologies are primarily used to aid in decision-making utilising absolute data for prospective supply chains. In a recent review of the literature published by Mastrocinque et al.11 a review of 30 different literature contributions highlights how MCDM practices have been applied to sustainable energy sources for supply chain application. In reviewing literature sources tailored to photovoltaic energy sector, three-quarters of the indicator inputs across the reviewed studies required discrete data, without in-depth comment or assessment of uncertainty. Within many applications, such as those covered in Section 2.1, access to reliable, discrete data for supply chain viability assessment is not possible under the constraints held by open literature.
A further literature review published as a book chapter by Khan et al. outlined and summarised over 140 different applications of multi-criteria decision analysis to supply chain management.12 In consulting the literature, the difficulties of MCDM implementation due to data availability are highlighted as a key restraining factor when it comes to supply chain applications. This ultimately highlights the issues of using MCDM as making a final decision for many stakeholders and researchers, whereas the utilisation of a screening methodology withdrawn from the need for discrete data (or absolute impact prediction) can, in theory, help address the issues of data availability surrounding MCDM. The study furthers this point by highlighting a key opportunity with respect to future work is the aiding in the increase in data availability. Given the conclusions drawn from the review published by Platt and Styring,2 the issues of process data limitation are still a significant issue within the application of LAS-appropriate olefins, compromising the potential for a reliable assessment akin to those highlighted within the literature reviews cited.
2.3 Addressing these limitations
In looking to address these issues of data quality and availability, inspiration was taken from other methodologies which make informed decisions based on indiscrete data. Conventional occupational and environmental risk assessments look to make decisions as to whether a practice is inherently safe for those undertaking it, not through the accurate or specific prediction of a process' performance, but instead the likelihood that an impact (such as toxic material exposure) exceeds a set baseline. This mentality when assigning scores, theoretically, gives operators the opportunity to assess a process' performance without the need for accurate data, instead assigning a risk value on how likely the performance value is to exceed a defined baseline.Consider the sustainability indicator of capital expenditure (the usually one-time cost associated with bringing a plant to an operable state). Estimating a definite capital expenditure based on ex-ante data and then scoring on a scale carries a large element of uncertainty, as well as the potential for operator bias.13 Instead, the concept of assigning a likelihood that the capital expenditure exceeds a defined value (for example, based on project funding) provides a different scenario for the assessment operator to base decisions on.
“It is not usually possible to accurately predict the levels of environmental effects caused by human actions. However, even without predicting absolute magnitudes of effects, application of the concept of risk can lead to substantial improvements in environmental assessment and protection.”13
This quote provides an accurate description of the methodology proposed, instead application to broader sustainability metrics is used, as opposed to “environmental effects” and the “human actions” in question are the deployment of a prospective technology or supply chain.
2.4 Research aims
Building on these ideas and review of the literature, this research looks to outline an alternative sustainability screening methodology to those in the literature, with the basis of assessment lying in predicting whether indicator performance exceeds a pre-determined success baseline. This to address the difficulties in predicting absolute impact magnitudes within a given future scenario and allowing for assessment based on both quantitative and qualitative characteristics of prospective processes and supply chains.The target audience for this research is operators with relative understanding of sustainability assessment processes, capable of effectively utilising knowledge of new and existing processes to aid in the broader decision-making process. The methodology also aids operators and stakeholders in forming a bank of evidence which can be updated as and when process-relevant information is made available or published. This addresses the aforementioned drive for stakeholders to expand their sphere of knowledge surrounding sustainable supply chains.
The methodology is to be outlined alongside an application to defossilised olefins for application to linear alkylbenzene sulfonate (LAS)-appropriate olefins to illustrate how an assessment is undertaken. The results of the study are also presented in-line with a broader study into defossilised olefins within the scope of the Clean Future and Carbon Rainbow initiatives.
3 Methods
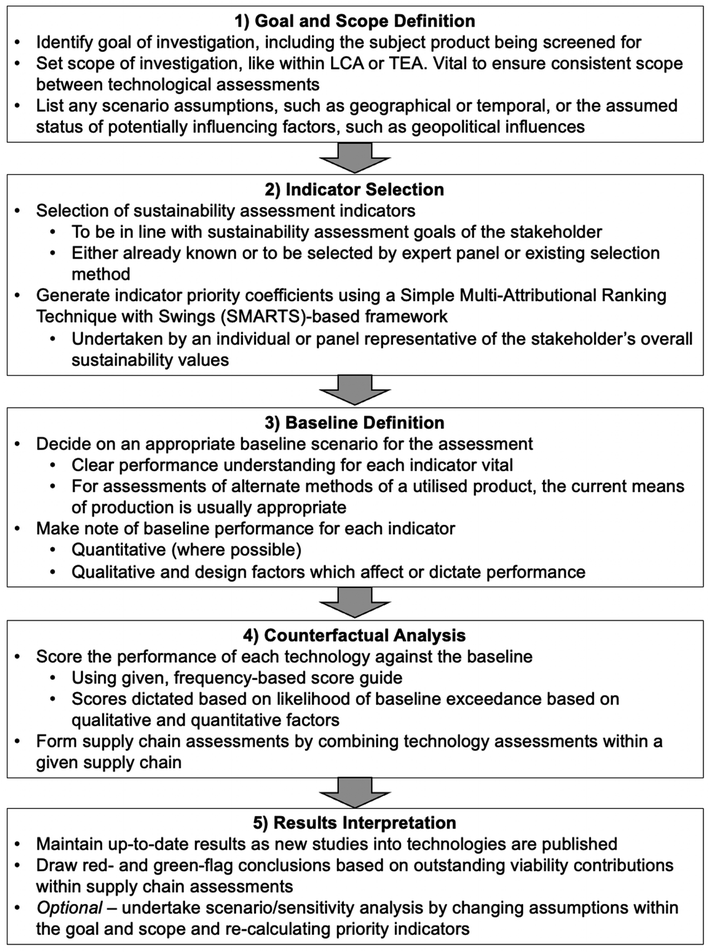
The method outlined for the screening of process sustainability is split across four key steps, followed by results interpretation, with the overall aim to assess each route within a determined network of processes leading to a common product. This section provides an overview of each stage and, for illustrative purposes, the application to the network considering defossilised surfactant-appropriate olefins outlined by Platt & Styring.2 The results of the final supply chain assessments then provide the basis of further assessment or justified disregard for future study due to poor performance or viability. The finished screening is to then act as a living document, with the idea of updating given scores as technologies mature and to essentially provide an evolving viability scorecard whilst data certainty improves.3.1 Goal and scope definition
Akin to a typical LCA and TEA, the first stage of the methodology is to understand the goal of the assessment and the scope at which the assessment is to take place. The goal of this assessment is to compare the viability of a network of defossilised supply chains for the formulation of Linear Alkylbenzene Sulfonate (LAS)-appropriate olefins. These consist of α-olefins of carbon chain length 10 to 14, in line with the product description given by Meyers in the Handbook of Petroleum Refining Processes.14 A previous study by Platt & Styring2 sought to outline and review literature surrounding potential defossilised technologies which can provide routes to these olefins, which are assessed as part of this study. Fig. 3 outlines these technologies, labelled T1 to T18. This assessment will cover a variety of indicators selected in line with Unilever (the stakeholder)'s climate goals, outlined in Section 1. A summary table describing each technology is provided in the ESI (Section S3.1†).The decision to study these olefins is motivated considerably by the prevalence of LAS within the cleaning industry, acting as one of the key ingredients in many cleaning products,15 justifying the requirement for sustainable production in order to address the Paris Agreement and AISE charters.
The aim of this assessment, being that of a screening, the final results will not necessarily be to act as a final decision, more provide conclusions and trends which will help in planning future sustainability research efforts. Key takeaways will be drawn with respect to feedstock category (with respect to those outlined in Fig. 1) and specific indicator performances to be accounted for when making future decisions.
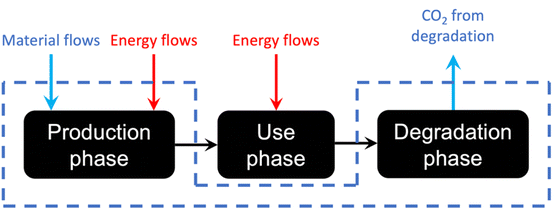
With regards to scope, in accordance with the Greenhouse Gas Protocol, all scope 3 emissions will be accounted for from supply chain cradle to gate.16 These include emissions associated with all direct and indirect processes associated with the production of the product, as well as those associated with the generation of purchased energy and all upstream processes. This is selected to ensure the assessment is completed in line with Unilever's Clean Future targets.3 The requirement for an assessment for the entire supply chain and is driven by the fact that many feedstock-handling processes result in the production of platform chemicals which differ from the current LAS-appropriate olefin supply chain.1 As a result, the processes required to process these alternate platform chemicals also require screening, even if these processes are well developed and utilised within other supply chains. With the scope defined above, the sourcing of materials and the impacts associated are also to be accounted for, including transportation. In addition to the production and material sourcing contributions, the emissions associated with product degradation were also included, to differentiate between cases in which biogenic and non-biogenic carbon was introduced or reintroduced to the atmosphere. This is due to avoided emissions not being accounted for in accordance with the Science Based Targets initiative.17Fig. 4 is presented to better illustrate the scope adopted.
As mentioned in Fig. 2, it is also vital to set informed future scenario assumptions to ensure informed conclusions are drawn. Within this assessment, a timeframe of 2030 was set, in line with the Clean Future initiative, with operation to be held within Germany, a location selected based on its wide, yet representative infrastructural offerings, as well as the fact that Chemische Fabrik Wibarco of Ibbiburen, Germany, currently produces 66![[thin space (1/6-em)]](https://www.rsc.org/images/entities/char_2009.gif) 000 tonnes of LAS per year.15 This site was deemed appropriate due to its average scale. Further assumptions, in accordance with the Bavarian Industry Association, hold energy prices at a predicted €84 per MW h, produced by 80% renewable sources.18 These figures were deemed appropriate due to the fact they considered the volatile effects on energy prices due to the COVID-19 pandemic and the ongoing Russo-Ukrainian war.
000 tonnes of LAS per year.15 This site was deemed appropriate due to its average scale. Further assumptions, in accordance with the Bavarian Industry Association, hold energy prices at a predicted €84 per MW h, produced by 80% renewable sources.18 These figures were deemed appropriate due to the fact they considered the volatile effects on energy prices due to the COVID-19 pandemic and the ongoing Russo-Ukrainian war.
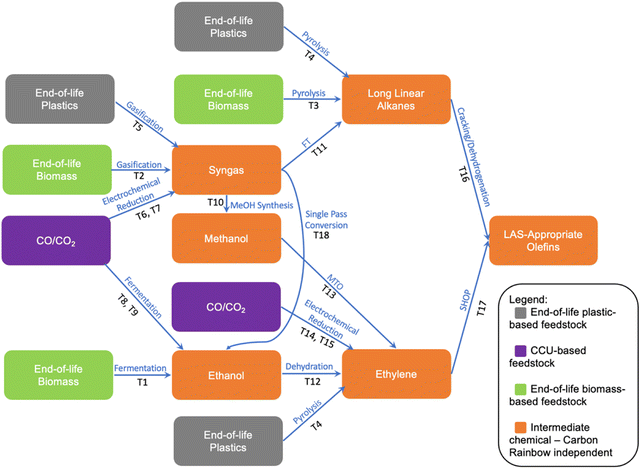 | ||
| Fig. 3 Defossilised routes to LAS-appropriate olefins (edited from Platt and Styring).2 Number labels have been added for future reference. | ||
3.2 Indicator selection
In order to assess the proposed supply chain routes, eleven sustainability performance indicators were drafted, each with the aim of considering any combination of the economic, environmental, and social sustainability of the assessed technology. Each indicator was selected in accordance with one of either Unilever's Clean Future initiative,3 the United Nation's Sustainability Development Goals (UN SDGs),19 or from a recent and extensive review of the sustainability assessment literature, and the most used sustainability assessment indicators within the chemical industry.20A further point of interest with respect to indicator 5 is the how this renewability is affected by the production and transportation methods of the feedstocks. If the carbon embedded within the feedstock is renewable but there are non-renewable elements to the manufacturing or handling processes involved, these effects are to be represented within this scoring.
3.3 Determination of indicator weighting values
This framework utilises a panel weighting approach, deriving from the Simple Multi-Attribute Ranking Technique with Swings (SMARTS/SWING) approach developed by Edwards and Barron.30 Here, practitioners within a panel are presented with the chosen indicators and the hypothetical scenario that a process exists where performance of all 11 indicators is as low as can be reasonably expected within industry (for example a process which reaches the upper limits of company budget, utilises completely non-renewable feedstocks, a high-yet-conceivable energy demand etc.), and then asked which indicator they would choose to fully optimise first. It is worth noting that the scenario assumptions outlined in Section 3.1 were also given. This optimisation would be to a level which, again, could be reasonably practiced within industry (utilises fully renewable feedstocks, holds an investment value well within budget, can be classed as autothermal, etc.). This first indicator is given an importance score of 100. The practitioner is then prompted with selecting the next most important indicator to optimise, giving an importance score equal to or less than the previously given score, until all indicators have a given score. The final weightings can then be derived by the use of eqn (1).
 | (1) |
An in-depth discussion into the suitability of the adopted method, as well as information into the panel selected, can be found in the ESI (Section S3.3†).
Due to commercial confidence, the final weighting parameters cannot be published, however the broader conclusions drawn show feedstock renewability, material, and operating costs to be of the highest relative priority, with the rest holding a near-equal share. Unilever have agreed to the publication of weighted results.
A worked example of this within the application presented as part of this research could be a scenario in which the electricity of a lower price and greater renewability is made available sooner than predicted, alternatively an “optimistic case”. In these circumstances, the response from survey panellists is likely to react in a way in which the priority of energy demand (indicator 11) decreases. This will ultimately increase the relative priority coefficients of the rest of the indicators, affecting key results and potentially amplifying other indicator scores.
Within the scope of this paper, the key goal is to showcase the methodology as a concept and provide an illustrative example. Given the commercial confidence regarding the sensitivity of these parameters, an illustration of a sensitivity analysis is not provided. Nonetheless the methodology presented does provide the capability to undertake such tasks.
3.4 Baseline selection and definition
Within the defined methodology of the sustainability screening tool is the requirement for a baseline for each indicator, for which a counterfactual assessment can be completed against. The use of a counterfactual assessment has been selected as it allows for a consistent basis of assessment between individual process assessments, allowing for a fair combination of different process assessments to form overall supply chain assessments. This method also aligns well with the underlying theory behind the screening assessment, stated by Suter et al.,13 that “Even without predicting absolute magnitudes of effects, application of the concept of risk can lead to substantial improvements in environmental assessment and protection”. Essentially, assessing the probability that an impact exceeds a set benchmark can provide improved assessment accuracy when compared to a methodology centred around the prediction of absolute magnitudes for each impact. In order to progress with this methodology therefore, a baseline for each indicator must be selected and defined.With most indicators, the appropriate baseline can simply be the current means of production, as reliable data is usually available. There are situations however in which this might not be appropriate, where an alternate baseline value must be considered. For example, the current means of producing surfactant-appropriate olefins utilises 100% fossil feedstocks. It is impossible for this baseline to be exceeded. As a result, when considering feedstock renewability, using this process would be inappropriate as no processes are able to score higher than this and exceed the baseline. Instead, an alternate baseline figure is drafted, more in-line with the Clean Future initiative than the current means of production. This is developed on further in Table 2.
An in-depth look into the baseline selection process can be found in the ESI (Section S3.4†). In short, any qualitative data as part of an indicator baseline is to have a high degree of certainty in order to provide a solid basis of assessment. As shown in subsequent sections, in some cases, indicators may draw different baseline values from different sources as required, such as future climate goals to be met.
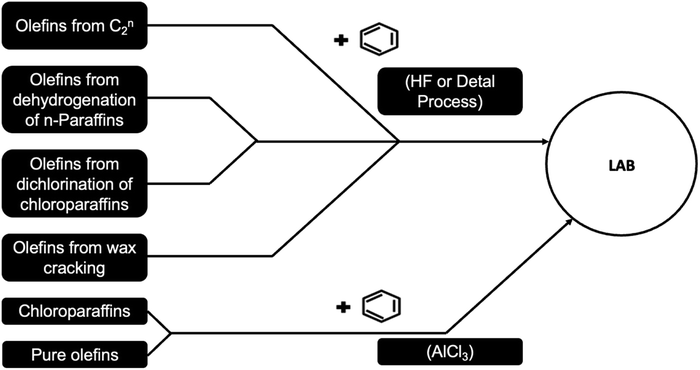 | ||
| Fig. 5 The most common LAB production methods (adapted from Shokri and Karimi).3 | ||
The catalytic dehydrogenation of paraffins to olefins has operated for nearly a century, with the first commercial site producing in the late 1930s.32 The process has been through several iterations since, with the UOP Pacol dehydrogenation process proving the most prevalent option with respect to detergent production. A flow diagram is shown in Fig. 6, showing each individual stage of the process.
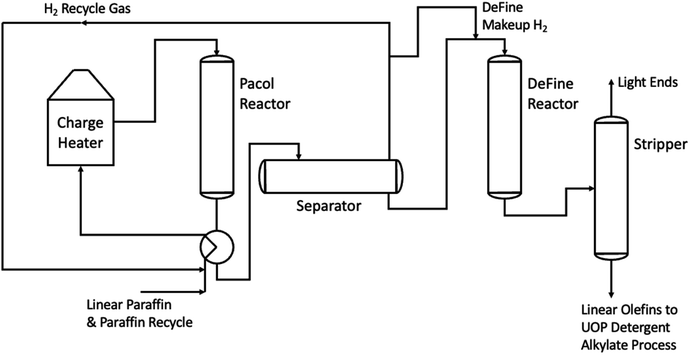 | ||
| Fig. 6 UOP Pacol dehydrogenation process (adapted from Bhasin et al.).4 | ||
Given the scope of this study, the “UOP Detergent Alkylate Process” step will not be considered as part of the overall process.
| Indicator | Baseline performance notes | Sources |
|---|---|---|
| (1) CAPEX | Estimated erected cost $30m USD2016, covering a reactor, subsequent units, land and starting catalyst for a plant of a 100![[thin space (1/6-em)]](https://www.rsc.org/images/entities/char_2009.gif) 000 ton per year LAB (∼68 000 ton per year LAB (∼68![[thin space (1/6-em)]](https://www.rsc.org/images/entities/char_2009.gif) 000 ton per year LAS-appropriate olefins) 000 ton per year LAS-appropriate olefins) |
14 |
| (2) Material OPEX | Catalyst cost estimated at 62 USD2021 per ton LAS-appropriate olefins. Paraffin feed estimated at 504 USD2021 per ton LAS-appropriate olefin produced | 15 and 33 |
| (3) Process symbiosis | Process is to be largely symbiotic with an external supply chain, resulting in sustainability benefits to the subject technology. This is drafted in line with the key goals of defossilisation outlined by the clean future initiative | 3 |
| (4) TRL | TRL 9 – technology must be commercially accessible at the time of deployment | — |
| (5) Feedstock renewability | Carbon feedstocks are over 50% renewable in order to progress towards net zero clean future targets | 3 |
| (6) Arable land use | Small plant footprint with a degree of flexibility. Platinum mining holds a high arable land threat in mining locations | 34 |
| (7) Ecosystem depletion | Use of fossil materials hold large share of abiotic depletion potential. Ecosystem depletion threat as a result of catalyst mining, such as production of acidic waters | 35 |
| (8) Overhead OPEX | Spent catalyst management processes required, though catalyst regeneration rates “very low”. Fire extinguishing measures required due to flammable material handling. Estimated at 48 USD2021 per ton of LAS-appropriate olefin formed. Labour costs assumed to be standard to industry | 33 |
| (9) Energy demand | 215 kW h medium voltage electricity and 9.32 GJ heat energy required per ton LAS-appropriate olefins. 57% of total energy used for conversion of paraffins to olefins, the rest on production of paraffin feedstocks | 31 and 36 |
| (10) Social impacts | Reliance on extensive control measures to dampen impacts. Social impacts present throughout entire feedstock production process. Relevant social impacts listed above | 37 |
| (11) Supply chain risk | Reliance on “high risk” platinum in catalysts – 7.6/10 according to British Geological Survey. Reliance on fossil feedstocks, falls outside of clean future initiative. Threat of fossil carbon taxation limiting viability as a future supply chain option. Strong geopolitical influence, as evidenced by the Russo-Ukrainian war | 3, 18 and 35 |
3.5 Undertaking of technology assessments
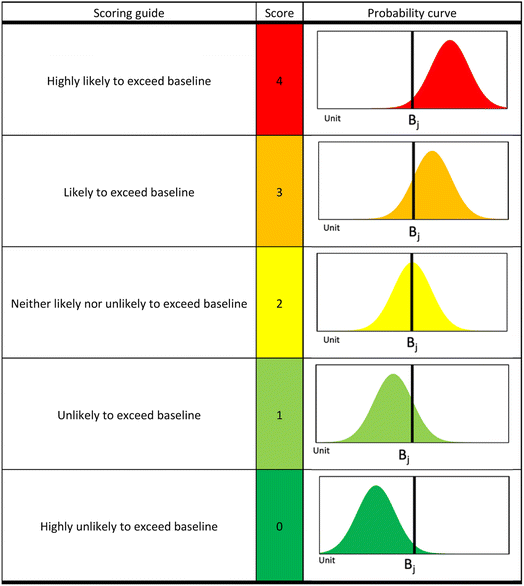
The undertaking of technology sustainability assessments is intentionally straightforward in its design, in order to allow for the operator's relevant insight to be communicated and calculated to the levels required by a screening assessment. The proposed methodology utilises a five-point Likert scale,38 assessing the probability that the performance level for each indicator exceeds the baseline score outlined in Section 3.4.Using this score guide shown in Table 2 and corresponding probability curves, the operator then assigns a score of zero to four for each indicator (Lij). This concerns the predicted performance of the assessed technology at the point of deployment. A scale suited to the functional unit of final product is to be used in order for fair construction and comparison of final supply chain assessments. The technological characteristics when assigning performance scores for a given technology are given throughout Section S3.4.2.†
Following this, the final weighted technology sustainability score (Si) is calculated, using eqn (2). The final score is scaled from 0 to 100, with the lower the score the better the overall sustainability performance.
 | (2) |
3.6 Supply chain assessments – combining technology assessments
With sustainability performance scores now generated for each technology within the supply chain network, the combination of individual scores can now be combined together to form supply chain assessments. As with other sustainability assessments, the conclusions drawn from the sustainability assessment draw much further from just the consultation of a single score. Within the methodology, weighted screening results within a supply chain can be presented in a spider diagram, with clear highlights as to where the key green- and red-flags are in terms of supply chain viability. An example is presented for Supply Chain SJ (referenced in Fig. 7), in Fig. 8. From the diagram, outstanding values highlight how the lack of feedstock renewability greatly withholds the process from improved performance, with higher scores representing negative impacts on process viability. Due to commercial confidence, as mentioned in Section 3.3, the full weighted results for this application cannot be disclosed, however Fig. 8 does provide an illustration as to how the final, granular results of an individual supply chain study looks.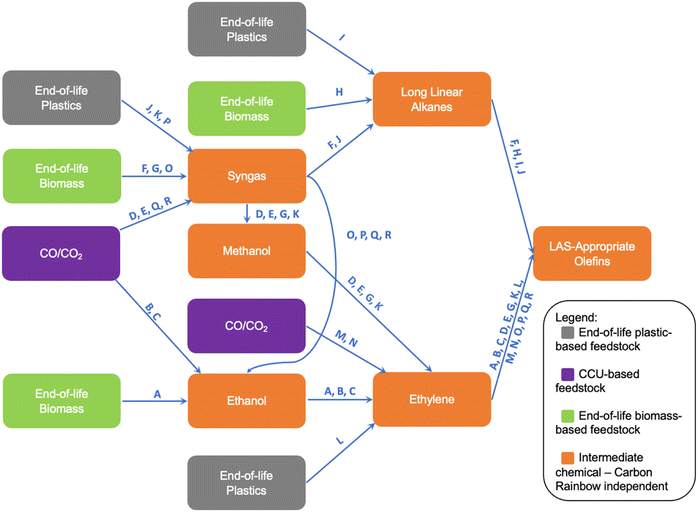 | ||
| Fig. 7 Labelled supply chain route diagram (adapted from Platt and Styring).2 | ||
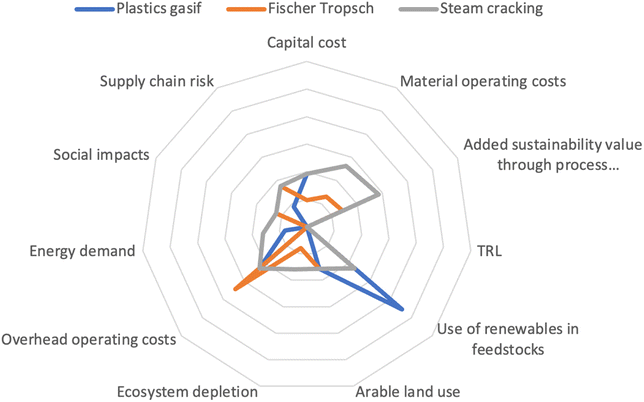 | ||
| Fig. 8 Sample spider diagram showing weighted impact results for supply chain SJ, concerning the gasification and FT synthesis of plastics (axis concealed to hide discrete priority factors). | ||
These insights are one of the key outcomes from the screening tool, with entire supply chains or technologies approved or rejected for further assessment (such as LCA and TEA) by decision-makers. Despite this however, individual scores can in fact be combined as to provide numerical scores for the entire supply chain.
The basis for this combination to provide a single score is to take an average of the relevant technology scores within a given supply chain. Given that each technology sustainability score has equal cardinality, the issues typically associated with an “average of averages” case is avoided.39 This is to dissociate supply chain scores from the quantity of technologies within the assessed supply chain, as each technology has already been calculated at an appropriate scale, as mentioned in Section 3.5. One drawback from this method is the potential to overlook compounding effects associated with having more processes within a supply chain, such as with results pertaining to economic sustainability. This outlines an associated drawback with the compounding methodology and justifies how the key outcome of the screening assessment is the hot spotting as mentioned before.
Whilst computational methods do already exist to find the optimum route, such as Edmond's Algorithm,39 having a list of every route's performance is beneficial in order to understand commonalities and trends between supply chains and allow for expanded interpretation of results. Supply chain sustainability scores (Sc) follow the same 0 to 100 scaling as those described in Section 3.5, with the lower the score the better with respect to overall sustainability performance. The diagram shown in Fig. 3 has been relabelled with supply chains A through R (Fig. 7), for better illustration as to show which supply chains have been assessed as part of this study. This information is also summarised in Table 3.
| Route label | Technologies used | Route description |
|---|---|---|
| SA | T1, T12, T17 | Fermentation of second-generation biomass to ethanol, which is then dehydrated and oligomerised |
| SB | T8, T12, T17 | Fermentation of direct air capture (DAC)-sourced CO2 to ethanol, which is then dehydrated and oligomerised |
| SC | T9, T12, T17 | Fermentation of point source capture (PS)-sourced CO2 from a steel mill to ethanol, dehydrated and oligomerised |
| SD | T6, T10, T13, T17 | Formation of olefins from DAC-sourced methanol via reduction and water-gas shift reaction |
| SE | T7, T10, T13, T17 | Formation of olefins from steel mill PS-sourced methanol via reduction and water-gas shift reaction |
| SF | T2, T11, T16 | Fischer–Tropsch synthesis of gasified end-of-life biomass |
| SG | T2, T10, T11, T17 | Formation of olefins from biosyngas-derived methanol via water-gas shift reaction |
| SH | T3, T16 | Cracking/dehydrogenation of pyrolysis oil from end-of-life biomass pyrolysis |
| SI | T4, T17 | Cracking/dehydrogenation of pyrolysis oil from end-of-life plastics pyrolysis |
| SJ | T5, T10, T17 | Fischer–Tropsch synthesis of gasified end-of-life plastics |
| SK | T5, T10, T13, T17 | Formation of olefins from end-of-life-plastics-derived methanol via gasification, before water-gas shift reaction |
| SL | T4, T17 | Oligomerisation of ethylene sourced from direct pyrolysis of end-of-life plastics |
| SM | T14, T17 | Direct reduction of DAC-sourced CO2 to ethylene and subsequent oligomerisation |
| SN | T15, T17 | Direct reduction of PS steel mill-sourced CO2 to ethylene and subsequent oligomerisation |
| SO | T2, T18, T12, T17 | Dehydration and oligomerisation of ethanol, directly sourced from treatment of gasified end-of-life biomass |
| SP | T5, T18, T12, T17 | Dehydration and oligomerisation of ethanol, directly sourced from treatment of gasified end-of-life plastics |
| SQ | T6, T18, T12, T17 | Dehydration and oligomerisation of ethanol, directly sourced from treatment of reduced DAC-sourced CO2 and H2 |
| SR | T7, T18, T12, T17 | Dehydration and oligomerisation of ethanol, directly sourced from treatment of PS steel mill-sourced CO2 and H2 |
4 Results
4.1 Technology assessment results
Within the results section, both the unweighted technology assessments and weighted final supply chain results can be published. A summary table of the individual technology sustainability scores (Lij) is shown in Table 4, with added information, sources and justifications for scores given in the ESI document (Tables S1–S18 and Section S4.1†).4.2 Supply chain assessment results
Taking the weighted sustainability scores for each technology assessed, the final supply chain assessments can be undertaken, giving an overall insight into the sustainability viability for each supply chain assessed. These scores are shown in Fig. 9. The supply chain numbers follow those outlined in Table 4. The application of the Unilever weightings has been approved by Unilever, who agree to use it for this publication.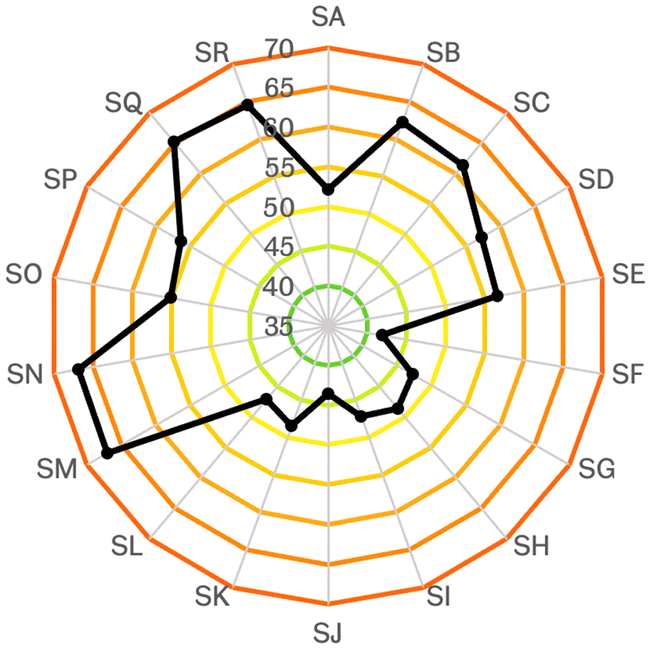 | ||
| Fig. 9 Results from supply chain sustainability assessment for the defossilised routes outlined in Fig. 7. | ||
5 Discussion
5.1 Assessment performance
The methodology used was developed with the idea of gaining an understanding of process sustainability through consideration of both quantitative and qualitative process characteristics, distancing the assessment from the uncertainty associated with ex-ante data. This is not to suggest that the final results are free from uncertainty, rather that they hold a lower potential for effects from uncertainty, in line with conclusions drawn by Suter et al.13 This in whole fulfils the key aims of the research outlined in Section 2.4, with the avoidance of absolute impact prediction and use of a counterfactual baseline assessment resulting in a complete viability study, identifying red- and green-flags for each process and supply chain. This also directly addresses the limitations of existing screening tools identified within the review of the literature in Section 2.3, with conclusions drawn under the stipulation of highly limited discrete data availability.The case study applied to the methodology outlined proved its functionality and potential to provide results and trends which could help inform decision-makers on the viability of different supply chains and technologies during the transition to a defossilised supply network. The undertaking of this assessment also provides the first major iteration and groundwork for a “living document”. Assessors can add new technologies and supply chains, alter technological performance scores as new literature is published, and also update the weighting prevalence of indicators as the future operating scenario becomes clearer, particularly with respect to energy costs and grid composition, as well as material costs and availability. This therefore provides an opportunity for the stakeholder to maintain a bank of supply chain viability evidence, as well as a series of sustainability performance results, showing and justifying which supply chains hold the most potential.
5.2 Application to defossilised olefins
Overall, 18 defossilised routes were assessed with due comparison to sustainability performance relative to a series of baseline figures for 11 sustainability indicators. As can be seen in Fig. 7 and 9, as well as the corresponding descriptions in Table 4, the best performing routes fell under the “green” (from plants) and “grey” (from plastic waste) carbon feeds, as characterised by the carbon rainbow in Fig. 1. This coincides with generally beneficial economic performance associated with material costs and energy demand, as well as lower capital expenditure for new industrial developments. With respect to green feedstocks, concerning end-of-life biomasses, the benefit of carbon renewability is also an influential factor. As alluded to in Section 3.3, the renewability of feedstocks is one of the indicators with the highest weighting. This, teamed with the binary nature of renewability (where technologies largely scored 0 or 4), tended to have quite a significant impact on individual technology performance and a subsequent effect on supply chain performance. Other key performance factors include the greater likelihood of market readiness by 2030 for these technologies, with processes like gasification and Fischer–Tropsch synthesis (and to a lesser extent pyrolysis) already being performed at scales close to those required within the scenario of this assessment, with Fulcrum Bioenergy40 proving these processes can be done commercially with the opening of their Sierra BioFuels plant in December 2022.41The best two performing supply chains both also incorporate gasification of some form. With the autothermal nature of gasification, the exothermic processing of its products, and the low-cost of feedstocks and plant, gasification excelled as an individual technology (T2 and T5).
Despite the significant weighting associated with feedstock renewability, several supply chains utilising non-renewable feedstocks still performed relatively well from a single score basis. The grey supply chains, specifically SI, SK and SL, all had performance scores which exceeded those of a purple feedstock origin, even those with renewable CO2 sources.
Looking at the other end of the results sheet, the lower performing routes tended to be those associated with purple feedstocks, both from direct air capture and point sources. This was generally due to the poor economic performance when compared to the indicator baseline figures, with expensive plant, materials, and high energy demands all contributing to relatively poor performance. This is shown in Table 4, with every CCU-based technology highly likely to perform on the poor side of the baseline with respect to energy usage.
The case study also provided, as previously mentioned, an insight into the sustainability priorities for the stakeholder. This insight, through numerical justification, allows the stakeholder to focus on key technological characteristics when deciding on which supply chains and technologies to invest in.
As a result of this screening therefore, the operator and assessment results both imply that further sustainability assessment into routes F through K would theoretically provide the stakeholder with the optimum defossilised supply chain from those assessed, for application within the defined scenario (Section 3.1).
6 Conclusions and future work
As part of the assessment of supply chain validity for the defossilisation of olefin supply chains for Unilever Home Care, a counterfactual screening methodology was developed and applied to an extensive network of potential supply chains for the formulation of defossilised LAS-appropriate olefins. The assessment of these olefins is driven by the Clean Future and Carbon Rainbow initiatives,3 as well as addressing wider implications surrounding sustainable production, such as the Paris Agreement1 and the AISE Charter for Sustainable Cleaning.4Through the assessment process, eleven different sustainability indicators were identified, each with the aim of addressing one of the three pillars of sustainability (environmental, economic, and social effects). A SMARTS-adjacent weighting survey was undertaken as a means of better tailoring the results to the stakeholder, proving the three highest priority indicators to be the use of renewable feedstocks, the material costs and the overhead operating expenditure associated with each of the technologies. A “baseline” of indicator success was then defined for each indicator, giving a performance value associated with optimal indicator performance. Each technology was then assessed according to these indicators, with a score (from a Likert scale) given based on the probability of the prospective technologies achieving the baseline performance for each indicator. These indicator performance scores, weighted by the importance parameters from the sustainability priority survey, were then summated to give a sustainability score for each technology. The technology sustainability scores were then combined through an arithmetic mean to give supply chain sustainability scores for eighteen different prospective supply chains.
From these results, important trends and similarities were identified for each of the better performing routes, with “grey” and “green” feedstock routes (as categorised by the carbon rainbow) outperforming many of the “purple” routes. This was driven largely by the superior economic performance of the grey and green routes, as well as the use of renewable feedstocks in the green routes. These trends could provide vital evidence when planning future sustainability and supply chain validity assessments, potentially streamlining future work by screening out poorer-performing routes.
When considering future work, a validation of results through co-reported, ISO-complying LCAs and TEAs of an array of supply chains, in order to confirm as to whether the conclusions drawn from the screening align with the industry norm. Given the lack of standardisation surrounding Social Impact Assessment (SIA), as well as a lack of differentiation between many of the routes, the pursuit of SIA validation will not be taken beyond the screening. This is also backed by the Unilever Responsible Partners Policy,28 with only policy-compliant technologies being taken forward for assessment. The undertaking of this assessment also gave a first iteration of a “living document”, which will be maintained and updated as technological development changes over time, as well as any other external changes to the future scenario, which may vary sustainability priorities.
Further applications of the methodology to different ingredients within Unilever's supply chains are also a key element to furthering this research. Given the fact that the methodology outlined is generalised for sustainability screening, the potential breadth of application is very broad. Returning a focus of research back to the identification of other key contributors to fossil supply chains within Unilever's chemical supply chains will lead to further applications of this methodology, contributing further to the wider goals outlined by the Clean Future and Carbon Rainbow initiatives.
Author contributions
EP is primary author. PS is research supervisor and edited the manuscript. Both authors contributed to the article and approved the submitted version.Conflicts of interest
While the PhD scholarship is funded by Unilever, the project undertaken is independent of commercial workflows. This is presented as a general methodology for a general audience and is not specific to Unilever. As a result, there are no conflicts to declare.Acknowledgements
We are grateful to Unilever for funding EGP as a PhD Scholar from a Strategic Partnership with PS at the University of Sheffield. We are also grateful to the UKRI Engineering and Physical Sciences Research Council (EPSRC) for funding to PS under the UKRI Interdisciplinary Centre for Circular Chemical Economy award (EP/V011863/1). The authors would like to acknowledge Dr Katy Armstrong, Dr Alastair Sanderson, and Dr Chris Gibbs of Unilever PLC who have engaged in discussions inspiring this work.Notes and references
- UNFCCC, Paris Climate Change Conference – November 2015, 2015 Search PubMed.
- E. G. Platt and P. Styring, Front. Sustain., 2022, 3, 1057491 CrossRef.
- Unilever, Clean Home Clean Planet Clean Future, https://www.unilever.com/brands/home-care/clean-future/, accessed August 1, 2023.
- AISE, Charter for Sustainable Cleaning - AISE, https://www.aise.eu/our-activities/sustainable-cleaning-78/charter-for-sustainable-cleaning-2874.aspx, accessed November 16, 2023.
- M. Kravchenko, D. C. Pigosso and T. C. McAloone, J. Cleaner Prod., 2019, 241, 118318 CrossRef.
- R. Chauvy, N. Meunier, D. Thomas and G. De Weireld, Appl. Energy, 2018, 236, 662–680 CrossRef.
- D. Miller, K. Armstrong and P. Styring, Sustain. Prod. Consum., 2022, 32, 184–197 CrossRef.
- M. Kravchenko, PhD thesis, Technical University of Denmark, 2020.
- T. L. Saaty, J. Math. Psychol., 1977, 15, 234–281 CrossRef.
- C. L. Hwang, Y. J. Lai and T. Y. Liu, Comput. Oper. Res., 1993, 20, 889–899 CrossRef.
- E. Mastrocinque, F. J. Ramírez, A. Honrubia-Escribano and D. T. Pham, Expert Syst. Appl., 2020, 150, 113321 CrossRef.
- S. A. Khan, A. Chaabane, F. T. Dweiri, S. A. Khan, A. Chaabane and F. T. Dweiri, Multi-Criteria Decision-Making Methods Application in Supply Chain Management: A Systematic Literature Review, IntechOpen, 2018 Search PubMed.
- G. W. Suter, L. W. Barnthouse and R. V. O'Neill, Environ. Manage., 1987, 11, 295–303 CrossRef.
- R. A. Meyers, Handbook of Petroleum Refining Processes, McGraw Hill Education, 4th edn, 2016 Search PubMed.
- A. Shokri and S. Karimi, Russ. J. Appl. Chem., 2021, 94, 1546–1559 CrossRef CAS.
- M. Barrow, B. Buckley, T. Caldicott, T. Cumberlege, J. Hsu, S. Kaufmann, K. Ramm, D. Rich, W. Temple-Smith, C. Cummis, L. Draucker, S. Khan, J. Ranganathan and M. Sotos, Technical Guidance for Scope 3 Emissions (Version 1.0), 2013 Search PubMed.
- Science Based Targets, SBTi Criteria and Recommendations, 2020 Search PubMed.
- vbw, Strompreisprognose, 2022.
- United Nations, THE 17 GOALS | Sustainable Development, https://sdgs.un.org/goals, accessed August 1, 2023.
- D. R. G. de Faria, J. L. de Medeiros and O. Q. F. Araújo, J. Cleaner Prod., 2020, 278, 123966 CrossRef.
- A. J. K. Newman, G. R. M. Dowson, E. G. Platt, H. J. Handford-Styring and P. Styring, Front. Energy Res., 2023, 11, 1124072 CrossRef.
- A. W. Zimmermann and R. Schomäcker, Energy Technol., 2017, 5, 850–860 CrossRef.
- T. Langhorst, L. Cremonese, J. Wunderlich, A. Kätelhön, H. Naims, C. Mangin, B. Olfe-Kräutlein, S. McCord, M. Bachmann, T. Strunge, A. Marxen, M. Bachmann, B. Winter, F. Mason, P. Styring, A. Zimmerman, Y. Wang, K. Armstrong, A. Sternberg, D. Rokosch, G. Stokes, R. Schomäcker, L. Müller, A. Villa Zaragoza, G. Buchner, S. Michailos, G. Faber, E. Williams, A. Bardow and V. Sick, Techno-Economic Assessment & Life Cycle Assessment Guidelines for CO2 Utilization, 2022, vol. 2 Search PubMed.
- B. Vidal-Legaz, S. Sala, A. Antón, D. M. De Souza, M. Nocita, B. Putman and R. F. M. Teixeira, Land-use Related Environmental Indicators for Life Cycle Assessment - Analysis of Key Aspects in Land Use Modelling – Study, 2016 Search PubMed.
- British Standards Institution, BS EN ISO 14044:2006+A2:2020, London, 2021 Search PubMed.
- A. Baral and B. R. Bakshi, Environ. Sci. Technol., 2010, 44, 800–807 CrossRef CAS PubMed.
- M. H. Abbasi, B. Abdullah, M. W. Ahmad, A. Rostami and J. Cullen, Sustain. Energy Technol. Assess., 2021, 48, 101630 Search PubMed.
- Unilever, Responsible Business Partner Policy, 2022 Search PubMed.
- S. Cox, P. Gagnon, S. Stout, O. Zinaman, A. Watson and E. Hotchkiss, Distributed Generation to Support Development-Focused Climate Action, 2016 Search PubMed.
- W. Edwards and F. H. Barron, Organ. Behav. Hum. Decis. Process.g, 1994, 60, 306–325 CrossRef.
- G. Wernet, C. Bauer, B. Steubing, J. Reinhard, E. Moreno-Ruiz and B. Weidema, Int. J. Life Cycle Assess., 2016, 21, 1218–1230 CrossRef.
- M. M. Bhasin, J. H. McCain, B. V. Vora, T. Imai and P. R. Pujadó, Appl. Catal., A, 2001, 221, 397–419 CrossRef CAS.
- R. A. Meyers, Handbook of Petroleum Refining Processes, McGraw Hill Education, 3rd edn, 2004 Search PubMed.
- G. Baskaran, Miner. Econ., 2021, 34, 385–398 CrossRef.
- British Geological Survey, Risk List 2015 - an Update to the Supply Risk Index for Elements or Element Groups that Are of Economic Value, 2015, vol. 1 Search PubMed.
- M. Franke, J. L. Berna, L. Cavalli, C. Renta, M. Stalmans and H. Thomas, Tenside, Surfactants, Deterg., 1995, 32, 384–396 CrossRef CAS.
- D. O'Rourke and S. Connolly, Annu. Rev. Environ. Resour., 2003, 28, 587–617 CrossRef.
- R. Likert, Arch. psychol., 1932, 22, 5–55 Search PubMed.
- A. Rajkumar, K. Mukherjee and T. Tulabandhula, Proceedings of the International Joint Conference on Autonomous Agents and Multiagent Systems, AAMAS, 2018, vol. 1, pp. 574–582 Search PubMed.
- Fulcrum Bioenergy, Our Fuel Process, https://www.fulcrum-bioenergy.com/our-fuel-process, accessed August 1, 2023.
- Fulcrum BioEnergy, Fulcrum BioEnergy Successfully Produces First Ever Low-Carbon Fuel from Landfill Waste at its Sierra BioFuels Plant, https://www.fulcrum-bioenergy.com/news-resources/first-fuel-2-2, accessed August 1, 2023.
Footnote |
| † Electronic supplementary information (ESI) available. See DOI: https://doi.org/10.1039/d3su00272a |
| This journal is © The Royal Society of Chemistry 2024 |

