 Open Access Article
Coumarin-based composite material for the latent fingerprint visualization and electrochemical sensing of hydrogen peroxide†
Manjunatha
B
a,
Yadav D.
Bodke
 *a,
Mounesh
 b and
Sachin Ashok
Bhat
 c
c
aDepartment of P.G. Studies and Research in Chemistry, Jnana Sahyadri, Kuvempu University Shankaraghatta-577451, Shivamogga, Karnataka, India. E-mail: ydbodke@gmail.com
bCentre for Nano and Material Sciences, Jain (Deemed-to-be University) Jain Global Campus, Jakkasandra, Kanakapura, Bangalore 562112, Karnataka, India
cCentre for Nano and Soft Matter Sciences (CeNS), Jalahalli, Bengaluru 560 013, India
First published on 20th December 2023
Abstract
Owing to their unique advantages of sensitivity, selectivity, and so on, electrochemical sensing methods are gaining importance in recent times. Given the limitations of single-component sensing systems, developing composite materials with two or more distinct components in suitable proportions for sensing applications is the need of the hour. There have been a plethora of attempts in this regard, wherein composite materials are being used as working electrodes for electrochemical sensing applications. In this regard, herein, we report a simple, hassle-free, and cost-effective synthesis of a redox-active organic molecule capable of electrochemically sensing hydrogen peroxide in its aqueous solution state. The limit of detection (LOD) was found to be as low as 5 nmol L−1 in a linear range of 50–500 nmol L−1. The compound was thoroughly characterized using different spectroscopic techniques. The molecule is both electrochemically and optically active, exhibiting fluorescence properties. This fluorescence behavior was employed in developing a latent fingerprint visualization technique. The redox activity of the compound coupled with photoluminescence properties presents a great opportunity to exploit its usage in electrochemical sensing applications.
Sustainability spotlightWe present a sustainable approach to synthesizing a redox-active organic molecule (CTH) for electrochemical hydrogen peroxide (H2O2) sensing and latent fingerprint development. Our straightforward, cost-effective synthesis method aligns with sustainability goals. Its structural integrity was confirmed using various techniques, and its solid-state fluorescence highlights its potential for eco-friendly fingerprint visualization. Additionally, redox properties enable qualitative H2O2 determination via electrochemical methods. We further enhanced its sensing capabilities by creating a composite material with MWNTs, maintaining its performance even in the presence of interfering ions and organic compounds. CTH's multifunctional nature offers sustainable solutions in diverse applications. Our work highlights/aligns with the following UN sustainability goals: Goal 9: industry, innovation, and infrastructure; Goal 3: good health and well-being. |
I. Introduction
Hydrogen peroxide (H2O2) is a potent oxidizing agent widely employed in diverse fields, such as medicine, food processing, and cosmetics, owing to its strong oxidative capabilities. However, the presence of high concentrations of H2O2 poses significant hazards and toxicity, which are potentially harmful to both the environment and human health.1–3 Consequently, the development of efficient and sensitive H2O2 sensors holds paramount importance for industrial and environmental applications. Over the years, several detection methods have been devised, including colorimetric, fluorometric, and electrochemical approaches.4–11 Among these, electrochemical sensors have garnered immense popularity owing to their high sensitivity, selectivity, cost-effectiveness, and real-time monitoring capabilities.Electrochemical sensors operate on the principle of converting a chemical signal into an electrical one. For H2O2 detection, this involves monitoring the electrochemical reduction or oxidation of H2O2 at the electrode surface. Electrochemical sensors have emerged as a promising approach for H2O2 detection, offering high sensitivity, selectivity, and ease of use, making them invaluable for a wide range of industrial and environmental applications. Various types of working electrodes have been employed in H2O2 sensing, including carbon-based, metal-based, and modified electrodes. Carbon-based electrodes, such as glassy carbon (GC), graphite, carbon nanotubes (CNTs), and graphene, are the most commonly utilized owing to their affordability, exceptional sensitivity, and robust stability.12–16 Among these, CNTs have gained significant attention in recent years owing to their unique characteristics, including a large surface area, excellent electrical conductivity, and biocompatibility, rendering them highly effective for H2O2 sensing.15,16 Metal-based electrodes, such as gold, platinum, and silver, have also shown promise as working electrodes in H2O2 sensing owing to their favorable electrochemical properties.17–19 While they offer high sensitivity and selectivity, their cost and limited availability hinder their widespread application. Recently, numerous redox-active compounds have been synthesized and explored for H2O2 sensing.20–25 These compounds possess unique redox properties, rendering them suitable for electrochemical sensing applications. Organic compounds such as 2,2′-azino-bis(3-ethylbenzthiazoline-6-sulfonic acid) (ABTS) and 1,10-phenanthroline have been investigated for H2O2 sensing. To address the challenges associated with single-component electrodes, a modified electrode approach has emerged, involving the alteration of the electrode surface with materials that enhance sensitivity and selectivity towards H2O2. For example, a recent study by Zhang et al. reported the use of a graphene oxide and polypyrrole composite-modified glassy carbon electrode for H2O2 sensing, exhibiting high sensitivity (detection limit of 0.2 μM) and good stability.24
Latent fingerprint visualization (LFP) is a crucial technique used in forensic science to reveal hidden or “latent” fingerprints on various surfaces. This method involves the enhancement of faint or invisible fingerprint residues left behind by individuals at crime scenes. Typically, this process includes the use of powders, chemical reagents, or specialized lighting to make latent prints more visible and suitable for analysis. The applications of latent fingerprint visualization are diverse, encompassing criminal investigations, forensic analysis, and law enforcement efforts. By making previously unseen fingerprints identifiable, this technique assists in linking suspects to crimes, solving cases, and aiding in the pursuit of justice. It plays a pivotal role in modern forensic science and continues to advance through the development of new technologies and methods.
In this work, we report the synthesis of a redox-active compound capable of sensing H2O2 at extremely low concentrations such as at nM scales. A composite consisting of the compound and CNTs was prepared and was used as the active material for sensing by coating it onto a glassy carbon electrode. The sensing remained unaffected even in the presence of interfering ions as well as organic compounds, making this electrochemically active multifunctional molecule a promising candidate for various applications. Apart from the electrochemical sensing, the LFP technique has also been developed using this redox-active compound. The method employs the intense fluorescence behavior of the compound and visualizes the latent fingerprint application effectively. This application can have vast forensic significance in visualizing the fingerprints effectively.
II. Materials methods
II.A. General procedure for the synthesis of coumarin derivative, CTH, and structural characterization
The proposed coumarin derivative compound (CTH) was synthesized using the reaction steps depicted in Scheme 1. In a 100 mL round-bottom flask, thiophene-2-carbohydrazide (C) (2 mmol), 3-acetyl-2H-1-benzopyran-2-onev (T) (2 mmol) were taken in 10 mL of EtOH with 2–3 drops of acetic acid. Then, the reaction mixture was refluxed at 70–80 °C using a magnetic stirrer for about 8–10 hours. After the completion of the reaction, the obtained precipitate was filtered washed with EtOH, and dried. Spectroscopic analyses such as FTIR, NMR, and HRMS were performed to characterize the molecular structures of the target compounds and their intermediates. The representative spectra of the target compound CTH are given in the ESI (Fig. S1–S4†).II.B. Computational studies
The Gaussian 09 software along with the B3LYP function with the 6-31G(d,p) basis set was used to perform all the computational calculations. Gauss view 05 was used to visualize the Gaussian software's output files. Multiwfn 3.7 was used to calculate RDGs, and Visual Molecular Dynamics (VMD) software was used to visualize them.II.C. Visualization of LFPs using CPC
In the beginning, subject's hands were washed thoroughly with soap water. Various non-porous surface materials were collected from the laboratory. The thumb was imprinted on collected surfaces. Then, the CPC was stained on the LFPs through the powder dusting method. The developed LFPs were visualized under 365 nm UV light and images were captured using a mobile phone.II.D. Electrodeposition of CTH/MWCNTs/GC
The GCE surface was cleaned by polishing it with 0.05 μm alumina slurry using a Buehler polishing kit. Approximately, 8 μL of the dispersion of MWCNTs (0.5 mg mL−1) was dropped on the pre-cleaned GCE and dried at ambient conditions. Then, MWCNT (5 μg MWCNTs loading) was transferred to a 10 mL sample vial containing 1 mM CTH in 5 mL DMSO, and one drop was coated on GCE, which was called CTH/MWCNTs/GCE. The electrodeposition was carried out using cyclic voltammetry at a potential range between −0.6 to 0.4 V, while the scan rate was 50 mV s−1.8–12III. Results and discussion
III.A. Theoretical studies
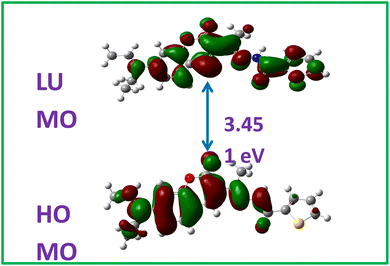
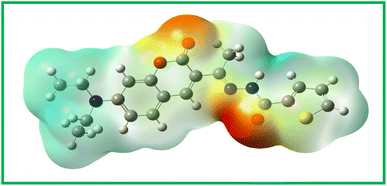
Theoretical studies were undertaken to understand not only the prediction of the energy levels of the molecule but also to determine the electron density distribution. Using the DFT studies, the HOMO and LUMO energy levels of the molecule CTH were determined and the molecular orbital picture for the same is shown in Fig. 1. The theoretical matrices, such as HOMO and LUMO energy levels, band gap, and ionization energy are tabulated in Table S1.† As can be seen from Fig. 1 and Table S1,† the band was found to be 3.451 eV, which was found to be reasonably close to the experimentally calculated one using the UV data as will be discussed in further sections.Along with the band gap the molecular electrostatic potential was determined and the image is shown in Fig. 2. As expected electron-deficient regions represented by an orange hue are seen around the keto groups at the center of the molecule.
III.B. Absorption and emission studies and latent fingerprints visualization
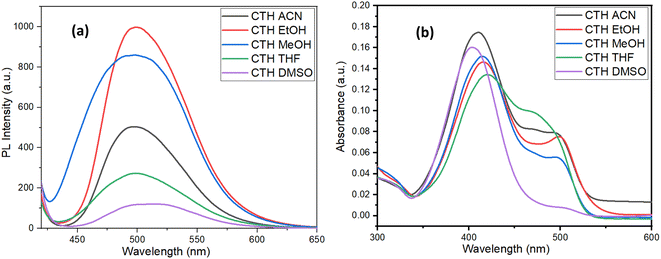
Given the fact that the molecule has electron donor and acceptor groups linked together, the compound must exhibit a photoluminescence phenomenon. The effect of the solvent on the absorption and emission was examined by recording UV-Vis and fluorescence spectra of the known concentrations of the compound in different solvents. The concentration was kept constant in all the solvents to understand the solvent effect on intensity as well. The results obtained are plotted in Fig. 3. Also, emission and absorption values as a function of the solvent are tabulated in Table S2.† As can be seen from the figure, the intensities of the same concentrations of the sample in different solvents vary drastically. Upon closer examination, a correlation between the polarity of the solvent and emission intensity could be established. As can be seen from the plot (Fig. 3a) the emission intensity reduces steadily with decreasing polarity. The higher polar solvents, such as ethanol and methanol, show a higher intensity value while the solvents that lie in the middle of the polarity scale such as acetonitrile and DMSO showed comparatively lower emission values. However, the correlation was not linear, indicating the existence of other factors apart from polarity affecting the emission phenomena. The polarity of the solvents also affected the fluorescence wavelength since non-polar solvents do not stabilize the excited state of the fluorophore, thereby increasing the energy gap between the ground and the exited energy of the molecules.With the increase in the polarity, a slight shift in the fluorescence wavelength towards a lower wavelength is observed. Similarly, the solvent polarity is also shown to affect the absorption spectra as well. The effect is more prominent in the absorption spectra, as shown in Fig. 3b. In the highly non-polar solve, i.e. THF, there is only one peak around 404 nm, however, upon increasing the polarity, an appearance of a shoulder peak around 475 to 498 nm was observed. This appearance/enhancement of the peak around the 404 nm peak can be attributed to the fact that polar solvents tend to stabilize the π*-exited state thereby shifting the absorption wavelength to a higher wavelength.
To understand the efficiency of the molecule to exhibit fluorescence emission upon irradiation, UV light fluorescence lifetime studies were carried out. These studies were carried out by adopting a relative quantum yield technique with anthracene as the standard. The quantum yields obtained in different solvents are shown in Table 1.
| Sl. no. | Solvent | Quantum yield |
|---|---|---|
| 1 | EtOH | 0.21 |
| 2 | MeOH | 0.17 |
| 3 | ACN | 0.06 |
| 4 | THE | 0.05 |
| 5 | DMSO | 0.02 |
It is clear from the table that the quantum yield is substantially higher (2–3 times) in highly polar solvents such as ethanol and methanol as compared to those in less polar solvents such as acetonitrile, THF, and DMSO. In a crime scene, the collection of latent fingerprints (LFPs), as a piece of evidence, is crucial for investigators. Generally, human LFPs have three levels of classifications, level I and level II display the nature of ridges such as bifurcations, dots, and ridge-endings and level III provides the details of the friction ridge-like edge shapes and sizes. Level I and level II can be easily duplicated by artificial skin but not level III. To visualize the LFPs the synthesized (CTH) fluorescent dye was employed. The images obtained using normal and UV lights are shown in Fig. 4.
As can be seen from the figure, the fluorescent compound CTH was able to visualize the fingerprints irrespective of the surface. The surfaces such as alumina, glass, and coins were tried and all produced highly reproducible results. Along with this, the ridges from level I to level III can be observed without any background interference on the applied surface.
III.C. Electrocatalytic detection of H2O2
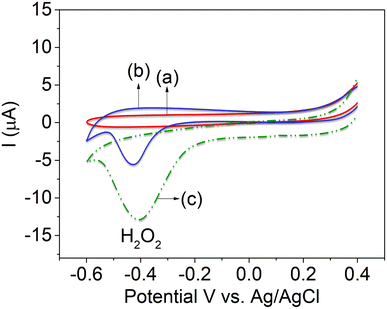
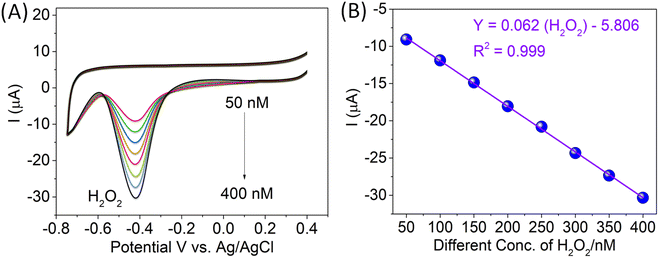
Fig. 5 depicts the CVs of bare GCE, CTH-modified GC electrodes, and CTH with composite MWCNTs electrodes towards the oxidation of 100 nM H2O2. In the potential range of 0.4 to −0.6 V, bare GCE did not show any reduction peak (Fig. 5, curve a). The CTH-modified GC electrode detected a reduction peak potential (−0.415 V) at a high reduction peak current (Fig. 5 curve b) as compared with bare GCE (Fig. 1A, curve a), and CTH with composite MWCNTs electrode was detected with same potential at −0.415 V (Fig. 5, curve c) with compile result of without MWCNTs (Fig. 5, curve b), a distinct cathodic peak corresponding to the reduction of H2O2 was observed. Moreover, the CTH/MWCNTs electrode showed a much higher peak current compared to other electrodes.13–15Next, the CTH/MWCNTs composite electrode was tested for the detection of H2O2 ions. Cyclic voltammograms of the CTH/MWCNTs composite electrode were initially tested in 50 nM H2O2 aqueous solution, with a distinct peak observed at −0.415 V vs. Ag/AgCl (Fig. 6A). No peak was observed in the absence of bare GCE by H2O2 detection (Fig. 5, curve s). Subsequently, 50 nM additions of H2O2 (Fig. 6A) were added into PBS (pH 7) electrolyte solution, where noticeable increases in the peak current were observed after each addition (concentration range from 50 to 400 nM of H2O2), Fig. 6A. Distinct current raises were obtained for concentrations as low as 50 nM H2O2. The peak current values showed a strong linear correlation with H2O2 concentration with a limit of detection (based on 3σ) for H2O2 of 12 nM. Note that this detection limit corresponds to the existing methodologies, which are both electrochemical methods.13–15 The linear graph of various concentrations of H2O2vs. the reduction peak current of H2O2 showed a correlation coefficient of 0.999, as shown in Fig. 6B, these results are in agreement with those reported previously, as shown in Table S2.†
The effect of scan rate was also investigated in 150 nM H2O2 solution under different scan rates from 10 to 100 mV s−1 (Fig. S5A†), increasing the scan rate with gradually increasing reduction peak current. The determination of the linear regression curve of Y = 0.160(H2O2) − 20.569 indicated R2 = 0.999, as shown in Fig. S5B† using the CTH/MWCNT-modified GC electrode. Fig. S5B† shows that the plot of the reduction peak current vs. the square root of the scan rate is linear, suggesting that the reaction of the reduction process is diffusion controlled.
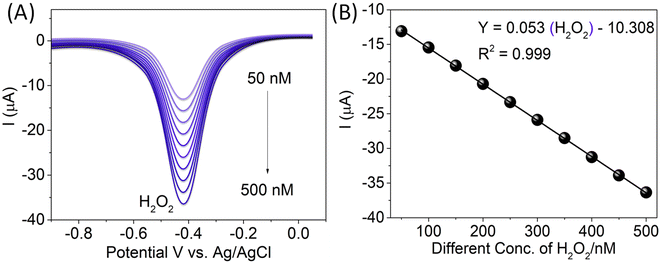
Differential pulse voltammetry (DPV) was used for the electrochemical estimation of H2O2 at the CTH/MWCNTs-modified GC electrode. The reduction peak current corresponding to the electro-reduction of 50 nM H2O2 in the potential ranges of 0.0 to −0.8 V at the CTH/MWCNT-modified GC electrode was recorded for varied DPV parameters. The CTH/MWCNT-modified GC electrode detected −0.415 V of H2O2, as shown in Fig. 7A. Keeping all other parameters constant, with an increase in the accumulation/deposition time from 5 to 20 s, DPVs were recorded for electro-reduction of H2O2 over a wide concentration range from 50 to 500 nM (as shown in Fig. 7A), the linear graph fitting the equation Y = 0.053(H2O2) − 10.308 (R2 = 0.999) (Fig. 7B). The detection limits were calculated from the calibration curve using 3sb/m (S/N = 3), where the standard deviation of the error of the intercept and m is the slope of the calibration plot. The detection limit of 5 nM for H2O2. A comparison of the detection limits/analytic performance reported for H2O2 on various electrode systems with that observed in the present work is presented in Table S2.†
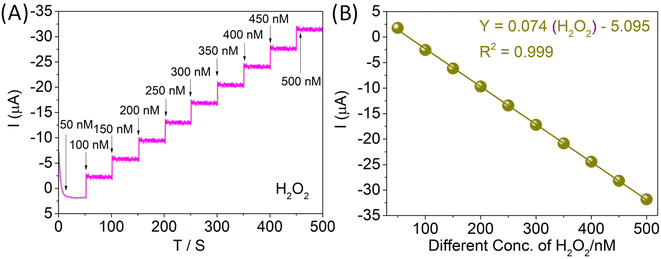
Fig. 8A illustrates the current–time plots for the CTH/MWCNT-modified GC electrode with successive step changes of H2O2 concentration. As the H2O2 was injected into the stirring PBS, the steady-state currents reached another steady-state value (94% of the maximum) in less than 3 s. Such a fast response implies that the CTH/MWCNTs can promote the reduction of H2O2. The linear relationship between the catalytic current and the concentration is shown in Fig. 8B. As can be seen, the CTH/MWCNTs display a linear response range of 50 to 500 nM (correlation coefficient: 0.999 Fig. 8B), with a detection limit of 9 nM at a signal-to-noise ratio of 3. We summarized various H2O2 sensors in Table S2,† concerning the linear range and the detection limit. It can be seen that the performance of CTH with the composite MWCNT-based sensor is excellent compared to the other material-based electrodes concerning the linear range and the detection limit.
The CTH/MWCNT-modified GC electrode-based H2O2 sensor also displayed good selectivity in the presence of common co-existing species, such as Cu2+, NO2, glucose Pb2+, Hg2+, Cd2+, and paracetamol Fig. S6(b, c, d, e, f, g, h, respectively),† at 200 nM, there was no interference with the response of 50 nM H2O2 Fig. S6(a).† As seen in the figure, a step appeared obviously when a certain amount of H2O2 was added. However, no step was observed when the co-existing species were added. It indicates the CTH/MWCNT-modified is an excellent electro-catalytically active GC electrode showing selectivity with sensitivity.
| Real samples | Added (μM) | Found (μM) | Recovery (%) |
|---|---|---|---|
| Milk | 50 | 48.25 | 96.5 |
| 100 | 98.5 | 98.5 | |
| 150 | 148.6 | 99.06 | |
| 200 | 199.9 | 99.95 |
IV. Conclusion
In summary, the redox-active compounds capable of sensing hydrogen peroxide at extremely low concentrations, such as at nM scales, were synthesized and characterized. The compound synthesized was characterized using various spectroscopic techniques and theoretical methods to confirm the structure. The fluorescence behavior of the compound, CTH was examined with the help of emission spectroscopy, and the effect of solvent polarity on absorption, emission as well as on quantum yield was determined. The compound exhibited high fluorescence in the solid state and hence it demonstrated the applicability in latent fingerprint development. More importantly, the redox nature of the compound was employed for the qualitative determination of H2O2 from the solution using electrochemical methods. A composite consisting of CTH and MWNTs was prepared and was used as the active material for the sensing by coating it onto GCE. It was also shown that the sensing remained unaffected even in the presence of interfering ions as well as organic compounds. The real sample analysis showed the efficacy of the sensor in detecting H2O2 quantitatively in the real-world sample. In essence, this electrochemically active multifunctional molecule, CTH provides a unique opportunity to be used for various applications.Conflicts of interest
There are no conflicts to declare.Acknowledgements
One of the authors, Manjunatha B. is thankful to the Council for Scientific and Industrial Research (CSIR), New Delhi, India, for providing a Senior Research fellowship [09/908(0011)/2019-EMR-I]. The authors are thankful to the Chairman, Department of Chemistry, Kuvempu University for providing the laboratory.References
- X. Zhang, H. Song, Z. Liu, Y. Zhang, X. Chen, Y. Zhao, Y. Zhao and M. Guo, The Application of Hydrogen Peroxide in Drinking Water Treatment: Risks, Mechanisms, and Control Strategies, Environ. Sci. Pollut. Res., 2020, 27(18), 22272–22286 CrossRef PubMed.
- R. S. Rahimi, E. M. Samsudin, S. Khorrami and Z. Yaakob, Potential Health Risks Associated with Hydrogen Peroxide Residuals in Food Products: A Review, Trends Food Sci. Technol., 2020, 99, 82–89 Search PubMed.
- L. Järup and A. Åkesson, Current Status of Cadmium as an Environmental Health Problem, Toxicol. Appl. Pharmacol., 2009, 238(3), 201–208 CrossRef PubMed.
- X. Zhan, Q. Xu and Y. Xu, A highly selective colorimetric and fluorescent probe for hydrogen peroxide based on the oxidation of phenylboronic acid, Dyes Pigm., 2017, 141, 146–151 Search PubMed.
- J. Wang, Q. Li, Y. Li and Y. Dong, High selectivity and sensitivity of a rhodamine derivative fluorescent probe for hydrogen peroxide detection in living cells, Dyes Pigm., 2019, 162, 708–716 Search PubMed.
- X. Niu, H. Liu, X. Wang, Y. Wang and J. Yuan, Synthesis and characterization of a new quinoline-based colorimetric and fluorescent probe for highly selective detection of hydrogen peroxide in aqueous solution and living cells, Sens. Actuators, B, 2019, 286, 10–17 Search PubMed.
- H. Yang, C. Yan, C. Zhang, Y. Ma, Y. Fang and B. Liu, A novel dual-emission fluorescent probe for detection of hydrogen peroxide and cysteine and its application in living cells, Sens. Actuators, B, 2020, 309, 127734 CrossRef.
- G. Aswin, R. Peng, C. Jianhong, V. M. R. Bruno, H. Y. Vincent Ching, J. Aleksander, V. D. Sabine, R. Anna, K. Piotr, B. Giovanni, M. Susanna, S. Adam and D. Shoubhik, Lignin-Supported Heterogeneous Photocatalyst for the Direct Generation of H2O2 from Seawater, J. Am. Chem. Soc., 2022, 144(6), 2603–2613 CrossRef PubMed.
- G. Aswin, Z. Tong and D. Shoubhik, Micro-Batch flow reactor for the photoproduction of H2O2 from water/real seawater, J. Flow Chem., 2023, 13, 185–192 CrossRef.
- R. Peng, Z. Tong, J. Noopur, H. Y. Vincent Ching, J. Aleksander, B. Giovanni, M. Susanna, S. Joaquin, C. Veronica, C. Lata, R. Anna, D. Elke, K. Piotr, V. D. Sabine, V. Sandra, B. Sara and D. Shoubhik, An Atomically Dispersed Mn-Photocatalyst for Generating Hydrogen Peroxide from Seawater via the Water Oxidation Reaction (WOR), J. Am. Chem. Soc., 2023, 145(30), 16584–16596 CrossRef PubMed.
- Z. Tong, S. Waldemar, U. K. Shahid, H. Y. Vincent Ching, L. Can, C. Jianhong, J. Aleksander, B. Giovanni, M. Susanna, D. W. Karolien, S. Adam and D. Shoubhik, Atomic-Level Understanding for the Enhanced Generation of Hydrogen Peroxide by the Introduction of an Aryl Amino Group in Polymeric Carbon Nitrides, ACS Catal., 2021, 11(22), 14087–14101 CrossRef.
- M. Naseri, A. Khoshroo and R. Ansari, Electrochemical sensing of hydrogen peroxide using multiwall carbon nanotubes-modified glassy carbon electrode, Sens. Actuators, B, 2008, 131(1), 3–8 Search PubMed.
- J. Zhang, Y. Huang, F. Li, X. Li, Y. Li and G. Li, Amperometric hydrogen peroxide biosensor based on the immobilization of horseradish peroxidase on nitrogen-doped carbon nanotubes modified electrode, Bioelectrochemistry, 2014, 98, 1–7 CrossRef PubMed.
- L. Zhao, X. Yin, Z. Gu, Q. Zhao, H. Cai and Y. Sun, Hydrogen peroxide biosensor based on the direct electrochemistry of myoglobin immobilized in chitosan/carbon nanotubes composite film, Sens. Actuators, B, 2013, 176, 1065–1070 CrossRef.
- X. Zhang, Y. Sun, Q. Zhao, Y. Ma, Q. Xie and X. Chen, Graphene oxide-multi-walled carbon nanotubes modified electrode for simultaneous determination of ascorbic acid, dopamine, and uric acid, Biosens. Bioelectron., 2012, 38(1), 273–278 Search PubMed.
- Y. Lin, F. Lu, Y. Tu and Z. Ren, Glucose biosensors based on carbon nanotube nanoelectrode ensembles, Nano Lett., 2004, 4(2), 191–195 CrossRef CAS.
- J. Wang, M. Musameh and Y. Lin, Sol-gel derived platinum nanoparticle composite for amperometric determination of hydrogen peroxide, Talanta, 2004, 63(1), 119–124 CrossRef PubMed.
- H. Cai, Y. Li, D. Li and E. Wang, A gold nanoparticle-based electrochemical method for hydrogen peroxide sensing, Anal. Biochem., 2003, 318(2), 130–135 Search PubMed.
- Y. Ni and S. Kokot, Amperometric determination of hydrogen peroxide using a silver nanoparticles modified electrode, Anal. Chim. Acta, 2009, 640(1–2), 64–69 Search PubMed.
- S. B. Patil, J.-H. Kim and S. W. Joo, Silver nanoparticle-decorated single-walled carbon nanotube-based electrochemical sensor for the detection of hydrogen peroxide, Biosens. Bioelectron., 2012, 36(1), 164–169 Search PubMed.
- M. C. Chang, A. Pralle and E. Y. Isacoff, A Selective, Cell-Permeable Optical Probe for Hydrogen Peroxide in Living Cells, J. Am. Chem. Soc., 2004, 126(43), 15392–15393 CrossRef CAS PubMed.
- Z. Li, J. Li, X. Li, H. Li and G. Li, A Redox-Active Metal-Organic Framework for the Electrochemical Detection of Hydrogen Peroxide, Sens. Actuators, B, 2015, 210, 293–300 Search PubMed.
- C. Liu, Y. Wang and W. Huang, Redox-Active Probes for Electrochemical Sensing of Hydrogen Peroxide: A Review, Anal. Chim. Acta, 2012, 732, 1–17 CrossRef PubMed.
- H. Zhang, Y. Zhang, C. Wang, H. Gao and Q. Zhao, Graphene oxide and polypyrrole composite modified glassy carbon electrode for sensitive electrochemical detection of hydrogen peroxide, J. Electroanal. Chem., 2019, 848, 113301 CrossRef.
- Y. Liu, Y. Liu, Y. Zhang, Z. Li and Y. Li, Construction of Laccase-Modified Electrode for Highly Sensitive Hydrogen Peroxide Detection, ACS Appl. Mater. Interfaces, 2018, 10(16), 13428–13435 Search PubMed.
Footnote |
| † Electronic supplementary information (ESI) available. See DOI: https://doi.org/10.1039/d3su00357d |
| This journal is © The Royal Society of Chemistry 2024 |


