 Open Access Article
Efficient integration of carbon dioxide reduction and 5-hydroxymethylfurfural oxidation at high current density†
Roger
Lin‡
 ,
Haoyan
Yang‡
 ,
Hanyu
Zheng‡
 ,
Mahdi
Salehi
 ,
Amirhossein
Farzi
 ,
Poojan
Patel
 ,
Xiao
Wang
 ,
Jiaxun
Guo
,
Kefang
Liu
,
Zhengyuan
Gao
,
Jiaxun
Guo
,
Kefang
Liu
,
Zhengyuan
Gao
 ,
Xiaojia
Li
and
Ali
Seifitokaldani
 *
*
Department of Chemical Engineering, McGill University, Montréal, QC H3A0C5, Canada. E-mail: ali.seifitokaldani@mcgill.ca; Tel: +1-514-398-4866
First published on 13th December 2023
Abstract
Commercialization of the electrochemical CO2 reduction reaction (CO2RR) is a crucial step towards carbon utilization and addressing climate change. However, its low energy efficiency in full electrolytic systems poses significant challenges. To overcome this, we investigate an integrated electrolytic cell coupling the CO2RR with the 5-hydroxymethylfurfural oxidation reaction (HMFOR), a promising alternative to the oxygen evolution reaction (OER) at the anode. The utilization of nickel-phosphorus (NiP) electrocatalysts achieves high faradaic efficiency (90%) and stability (>200 redox cycles) for the anodic HMFOR to produce 2,5-furandicarboxylic acid (FDCA) at a high current density of 100 mA cm−2. Simultaneously, Sn, Ag and Cu nanoparticles act as efficient cathode electrocatalysts in a flow cell reactor, to produce formate, syngas, C2+ hydrocarbon and other CO2RR products. Compared to the OER-CO2RR, the integrated HMFOR-CO2RR system demonstrates an energy efficiency increase of more than 10%. Additionally, economic analysis shows a 45% reduction in the levelized cost of potassium formate production in an optimistic scenario. This integrated CO2RR-HMFOR electrocatalytic system holds promise for commercializing CO2 reactors.
Sustainability spotlightIn the face of increasing CO2 levels and their associated environmental challenges, our study focuses on a novel approach to combat climate change. We have explored an enhanced CO2 reduction reaction (CO2RR) system, leveraging clean electricity to establish a carbon capture and utilization (CCU) process. Our innovation involves replacing the anodic oxygen evolution reaction (OER) with an energy-efficient upgrade of biomass-derived 5-hydroxymethylfurfural (HMF) to 2,5-furandicarboxylic acid (FDCA). This work not only aligns with the UN's Sustainable Development Goals for waste recycling (SDG 12) but also contributes to the industrialization of efficient clean energy consumption (SDG 7 and 9), thus combating climate change (SDG 13). |
Introduction
The electrochemical CO2 reduction reaction (CO2RR) is one of the promising options for carbon capture and utilization (CCU). It is a catalytic reaction using electricity as the energy source to convert CO2 or bicarbonate to various products including carbon monoxide, alcohols, hydrocarbons, and organic acids (shown in Fig. 1). Among these products, some might have greater market potential, such as formic acid (HCOOH),1,2 methanol (CH3OH),3–5 ethanol (CH3CH2OH),6,7 ethylene (C2H4),8,9 and carbon monoxide (CO).10,11 However, challenges remain today as the applied potential across the cell is often large, while the energy efficiency is low. This means that lab-scale projects have a high energy consumption for a required output, leading to high costs and challenges to scale up to industrial applications. There is also a limited amount of economic analysis proof for a profitable process on the industrial scale, so a financial obstacle exists when implementing the CO2RR alone. According to Jouny,12 CO and formic acid are profitable under current economic conditions, but many other CO2RR products may have a promising future as profitable options. Moreover, given the research by Kibria,13 it is shown that the CO2RR needs to maintain a stable operation for 80![[thin space (1/6-em)]](https://www.rsc.org/images/entities/char_2009.gif) 000 hours to be economically viable. Currently, there is a trade-off between high selectivity and high market value for a single CO2RR product. Formate and CO have high selectivity with low market prices, while ethanol and ethylene are the opposite. The current methods are not yet satisfactory to the industry, and the performance must be increased in parallel with further developments in techno-economic analysis (TEA) and life-cycle assessment (LCA) studies.
000 hours to be economically viable. Currently, there is a trade-off between high selectivity and high market value for a single CO2RR product. Formate and CO have high selectivity with low market prices, while ethanol and ethylene are the opposite. The current methods are not yet satisfactory to the industry, and the performance must be increased in parallel with further developments in techno-economic analysis (TEA) and life-cycle assessment (LCA) studies.
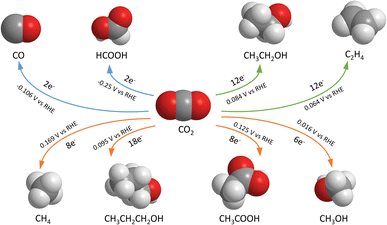 | ||
| Fig. 1 Common electrochemical CO2 reduction reaction products, number of electrons transferred and reaction standard potentials.14 | ||
A typical electrolyzer consists of the CO2RR in the cathode and the oxygen evolution reaction (OER) in the anode, which is the generation of oxygen through water electrolysis. Previous studies have developed various electrocatalysts for the OER, as shown in Table 1 below. However, the OER faces challenges such as high energy requirements due to its large overpotential and slow charge transfer. Hence, more studies are looking into replacing the OER with a reaction requiring less energy input, i.e., lower applied potential, while achieving a high reaction rate.15 The oxidations of methanol, ethanol, glycerol benzyl alcohol, hydroxymethyl-furfural, and HMF are some examples of the alternative anodic reactions.16–18
| Electrode | Reaction | Electrolyte | Voltage (V vs. RHE) at 10 mA cm−1 | Tafel slope [mV dec−1] | Ref. |
|---|---|---|---|---|---|
| α-Co(OH)2/HNFs | OER | 1.0 M KOH | 1.54 | 68.9 | 19 |
| Co–Mo–N hollow polyhedra | OER | 1.0 M KOH | 1.53 | 57 | 20 |
| N-doped hollow carbon spheres | OER | 0.1 M KOH | 1.59 | 182 | 21 |
| Co0.5Fe0.5O0.5F1.5 | OER | 1.0 M KOH | 1.45 | 27 | 22 |
| Ni3ZnC0.7@CoNiCuFe–NC | OER | 1.0 M KOH | 1.43 | 80.4 | 23 |
| Commercial IrO2 | OER | 1.0 M KOH | 1.51 | 105.1 | 23 |
| NiP@Ni/Carbon felt (CF) | OER | 1.0 M KOH | 1.53 | 111.7 | This work |
| NiP@Ni/CF | HMFOR | 1.0 M KOH (15 mM HMF) | 1.40 | 35.8 | This work |
We propose to replace the OER with biomass upgrading. Specifically, we focus on the electrocatalytic oxidation reaction of 5-hydroxymethylfurfural (HMF), converting a biomass byproduct from the pulp and paper industry, into more valuable chemicals. Some previous studies break down and convert HMF into formic acid (FA) and maleic acid (MA),24 while HMF can also be converted into 2,5-furandicarboxylic acid (FDCA).25,26 FDCA serves as a crucial precursor, capable of generating polyethylene 2,5-furandicarboxylate (PEF) as a monomer, which in turn, can be utilized in the production of polyethylene terephthalate (PET), a promising contender for biomass-based plastics.27 Au, Pt, Pd and various precious metals as well as molecular-based electrocatalysts have been studied to produce FDCA at low potential with outstanding performance.28–31 However, noble metals are scarce and expensive. Meanwhile, the research by Latsuzbaia showed that Ni has outstanding catalytic performance with high FDCA yield and faradaic efficiency (FE) of around 90% and 80%, respectively.32 Ni also has a lower cost than noble metals, making it more feasible for industrial application. Kubota et al. demonstrated the possible acidic HMFOR electrolyzer in pH 1 sulfuric acid electrolyte, with a 53.8% yield of FDCA but an FE of only 33.8% due to the MA formation.33 Recent studies on the HMFOR, with the hydrogen evolution reaction (HER) in the cathode, have tested various Ni-based catalysts including 3D Ni2P and Ni3S2 on nickel foam,34–36 Co0.4NiS@NF,37 and NiCoMn-layered double hydroxides38 to demonstrate advantages in voltage reduction, stability, and faradaic efficiencies. The HMFOR-CO2RR system was later studied by Choi et al. under near-neutral conditions, which achieved FE of 70% but only at a low current density of ∼1 mA cm−2.39 Recent work from Bi et al. has achieved a higher current density of around 100 mA cm−2 by producing MA and FA from HMF in the anode and CO in the cathode with the aid of acetonitrile and [Bmim]BF4. They also showed a stable current density and CO faradaic efficiency after 10 hours of continuous electrolysis with no noticeable change in the structure and composition of the electrocatalyst. Besides, the CO2RR-HMFOR paired system reduced the overall cell voltage to 2.70 V while maintaining a considerably high yield.29 In the current research, an alkaline aqueous system is more practical than the acidic one because FDCA is a weak acid and has low solubility in water at low pH, which leads to selectivity and separation issues.40
To efficiently tackle the carbon dioxide challenge, we present the combination of the CO2RR and HMFOR in an alkaline system via the NiP electrocatalyst on carbon felt (CF) to achieve a high current density of 100 mA cm−2 and 90% FE on both the cathode and anode, with a low cell voltage of ∼2 V. This work also investigates the feasibility of a combined system from experimental and techno-economic perspectives. Using this setup, CO2 and HMF are transformed into products with considerable market values and demands, such as CO (0.20 USD per kg),41 formate (0.90 USD per kg),42 ethylene (0.49–0.94 USD per kg),43 ethanol (0.77 USD per kg),43 FDCA (1.53 USD per kg)44 and their respective net present values (NPVs) are all expected to increase in the future. Implementation of such a system not only offers vast opportunities for scientific exploration but also presents a green solution for carbon capture and reutilization. By simultaneously advancing carbon-neutral objectives, renewable fuel production, and circular economy principles, this integrated approach promises significant environmental benefits.
Methodology
Materials and chemicals
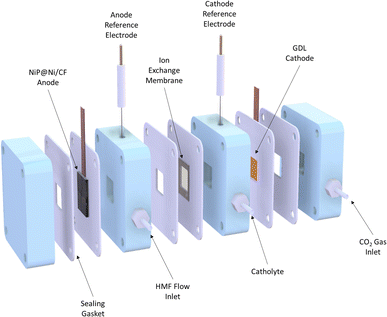
A flow cell was used for a continuous CO2RR experiment combined with the HMFOR. It contained three chambers: cathode gas chamber, catholyte chamber and anolyte chamber (Fig. 2). A gas diffusion layer (GDL) with an electrocatalyst coating was installed between the cathode gas chamber and the catholyte chamber (see Fig. S1, ESI†). The anode electrocatalyst NiP coated on Ni-deposited carbon felt (NiP@Ni/CF) was placed in the anode chamber. An anion exchange membrane was in place to separate the two half-cells, allowing anions to pass through while preventing product crossover. 1 M KOH solution as the electrolyte was filled in both cathode and anode chambers, where HMF was present in the anode during the HMFOR tests.Electrocatalyst synthesis
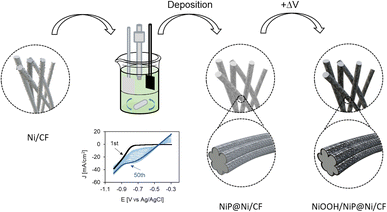
The anode electrocatalyst NiP@Ni/CF was prepared by electrodeposition of Ni on 2 nm-Ni-deposited carbon felt (Ni/CF) in an undivided cell (Fig. 3 and S2, ESI†). Ag, Cu, and Sn electrocatalysts were used on the cathode side. Ag/CP, Cu/CP, Ag/PTFE, and Cu/PTFE were prepared by depositing metal nanoparticles on carbon paper (CP) or PTFE (Polytetrafluoroethylene) via the physical vapor deposition (PVD) technique; while Sn/CP was prepared by drop-casting Sn nanoparticles onto CP (see Fig. S3, ESI†).Characterization
Physiochemical characterization techniques were employed to investigate the morphology and chemical composition of the electrocatalysts, as well as to confirm the presence of their active sites. These methods encompassed scanning electron microscopy (SEM), energy-dispersive X-ray spectroscopy (EDX), X-ray diffraction (XRD), X-ray photoelectron spectroscopy (XPS) and X-ray absorption spectroscopy (XAS).Electrochemical measurements
Cyclic voltammetry (CV) and linear sweep voltammetry (LSV) were used to investigate the potential window of the desired reaction and activity of the electrocatalyst. In the HMFOR, the potential window is between the surface oxidation of Ni2+ and the OER-dominating region, while in the CO2RR, it is between the onset potential and the hydrogen evolution reaction (HER)-dominating region. CV was also used to study the recyclability of the NiP electrocatalyst.Chronoamperometry and chronopotentiometry experiments were conducted to assess the electrochemical performance of the electrocatalysts under reaction conditions. Electrochemical impedance spectroscopy (EIS) tests were performed using a frequency response analyzer (FRA) to determine the system resistance (Rs) and charge transfer resistance (Rct) of the reactor setup with the electrocatalyst.
To convert the reference electrode reading to the reversible hydrogen electrode (RHE) potential under atmospheric non-standard pH conditions, eqn (1) was used:
| E(RHE) = EAg/AgCl + 0.210 V + 0.059 × pH | (1) |
Product analysis
The gas and liquid products of the CO2RR and HMFOR from the chronoamperometry and chronopotentiometry experiments were analyzed using gas chromatography (GC) and high-performance liquid chromatography (HPLC), respectively.A flow test was done before gas product sampling to determine the gas flow rate, which was used to calculate the product rate and eventually product FE.
The calculations of product yield and faradaic efficiency are given by the following eqn (2) and (3) respectively:
 | (2) |
 | (3) |
![[thin space (1/6-em)]](https://www.rsc.org/images/entities/char_2009.gif) 485 C mol−1), n is the number of moles of electrons transferred per mole of product, and Q is the charge.
485 C mol−1), n is the number of moles of electrons transferred per mole of product, and Q is the charge.
Applied voltages were iR-corrected with the system resistance to exclude the influence of the electrical setup.
From the standard potentials and the applied voltage, voltage efficiency (VE) is calculated:
 | (4) |
From the FE and VE, the energy efficiency (EE) of the electrolyzer is calculated for each product:
| EEi = VE × FEi × 100% | (5) |
In Cu-based electrocatalysts where multiple products were produced, the total EE is a sum of the individual EE of detected products.
When the CO2RR is combined with the HMFOR, an additional aspect to assess energy saving is achieved by dividing the conventional CO2RR-OER voltage by the improved cell voltage when HMF is introduced at the identical current. This yields the voltage saving factor ηV:
 | (6) |
This parameter effectively indicates the voltage-saving capability of the electrochemical cell, where a number higher than unity means better energy saving. A theoretical maximum value of the saving on the conventional OER occurs when the cathode and the anode have zero overpotential. Then, based on the voltage saving, the faradaic efficiencies of both cathode and anode reactions are multiplied to yield the cell energy saving factor ηcell:
| ηcell = ηv × FEcathode × FEanode | (7) |
This parameter indicates the cell energy saving compared to the conventional CO2RR-OER system. A near-unity result indicates no significant energy saving for the full cell, while a larger number refers to a considerable saving from the energetic perspective. If the FE of one half-cell is too low, ηcell will be a relatively small number, indicating a low benefit for simultaneous production.
Results and discussion
Electrocatalyst characterization
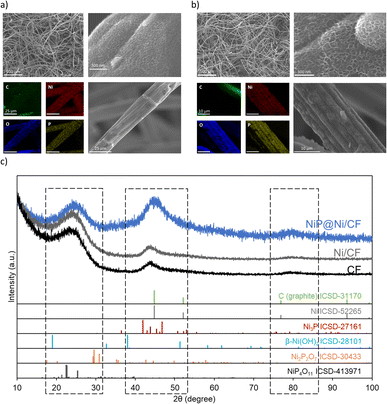
SEM images in Fig. 4 show a uniform coating layer consisting of nickel- and phosphorus-rich deposits on the fiber structure of the carbon felt. The surface of the NiP layer has a typical nanosheet structure of Ni(OH)2, indicating the successful deposition of Ni,45,46 EDX results indicate the co-deposition of Ni and P (Fig. 4a, b and S4, ESI†). The carbon fibers are uniformly covered by nickel (46%), oxygen (15%) and phosphorus (10%). Similarly, EDX on NiP@Ni/CP after being used for the HMFOR (>10 cycles) shows the presence of Ni, O and P.The XRD results in Fig. 4c demonstrate that the peaks between 20°–100° of 2*θ are mainly from the carbon felt substrate. When we compare the Ni/CF with the CF substrate, we observe no difference, as the 2 nm of deposited Ni remains in nanoparticles, without any large crystals on the substrate. For the NiP@Ni/CF sample, signal broadening in the ranges of 20°–30°, 40°–50°, and 75°–85° indicates successful deposition of mostly amorphous or microcrystalline nickel–phosphorus active materials on the carbon felt, potentially with a broad crystal size distribution.47 This is consistent with the results from SEM and EDX showing the typical nanosheet Ni(OH)2 on top of the nickel and phosphorus co-deposit layer.
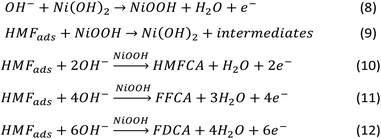
XPS survey reveals the oxidation state of Ni sites on the NiP@Ni/CF electrocatalyst and confirms the presence of Ni, O, C, and P on the electrocatalyst surface (Fig. S5, ESI†). High resolution XPS of Ni 2p spectra in Fig. 5 shows that Ni2+ (856.2 eV) is the dominant Ni species on the surface, while P2p spectra reveal that phosphorus-oxygen bonds are also present on the as-prepared electrocatalyst surface.46,48 Higher Ni oxidation state, namely Ni3+ (857.7 eV), is found after the HMFOR, revealing the oxidation of Ni surface species post-HMFOR.40 This surface oxidation of Ni2+ is typical to the Ni(OH)2/NiOOH material as shown in Fig. S6 (ESI),† prepared by pulsed oxidation of Ni foam from our previously published work.49 The redox couple of Ni2+ and Ni3+, specifically in the form of NiOOH, is well known to be responsible for the HMFOR and other organic oxidation reactions targeting hydroxyl and aldehyde groups.50–53 A dominant Ni–P bonding is not clearly seen likely due to the broad range of coordination possible among Ni, P and O, but the Ni 2p and P 2p spectra indicate a composition of nickel hydroxides and phosphate species, given the oxidized Ni peak of a typical Ni–O bond and the partially oxidized P peak (133.2 eV) indicating the presence of the P–O bond,54,55 potentially resulting from surface oxidation of Ni–P species.48,56 However, we are also aware that the presence of the P–O bond can enable further Ni oxidation under anodic conditions (Fig. S5, ESI†) and therefore generate an active Ni2+/Ni3+ redox pair for the HMFOR.57 The XPS results also indicate that the conversion of Ni2+ to Ni3+ takes place on the surface of the electrocatalyst after applying an anodic potential during the HMFOR.
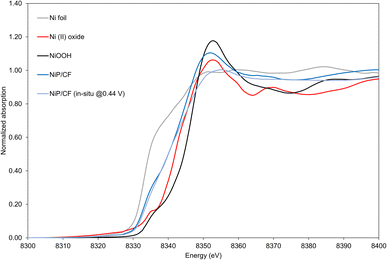
XAS results indicate the existence of Ni and provide insights into its oxidation state on the electrocatalyst. Scanning is carried out under both ex situ conditions and in situ oxidative conditions at 0.44 V vs. Ag/AgCl (Fig. S7, ESI†). As observed in Fig. 6, as-prepared NiP and NiP deposited on carbon felt (NiP@Ni/CF) have a blue shift to the right side compared to the Ni foil reference. Such a shift towards Ni(II) shows that in the NiP electrocatalyst a higher oxidation state can be attributed to Ni.
From the surface-sensitive total electron yield (TEY) method on the catalytic NiOOH deposited on Ni foam, tests yield a blue shift from the Ni foil and Ni(II) oxide, showing similar edge and peak features to the oxide.58 This suggests that the surface layer of the NiOOH electrocatalysts exhibits an oxidation state higher than +2. To quantitatively investigate the oxidation states of the NiP, we conducted linear combination fitting on our experimental data. Based on Table S1 (ESI),† despite the presence of minor deviations in fitted values, it is feasible to effectively combine Ni foil and Ni(II) to fit the NiP/CF electrocatalyst. For NiP, the disparities between the in situ and ex situ oxidation states are not statistically significant. Therefore, under both ex situ and oxidative conditions, it can be claimed that the NiP@Ni/CF sample has an average oxidation state of about +1.2. It is in agreement with a blue shift of the edge in NiP@Ni/CF towards the Ni(II) oxide standard (Fig. 6).
SEM images of the cathode electrocatalysts Ag/CP, Cu/CP, and Sn/CP show uniform deposition of metal particles on carbon paper, (Fig. S8, ESI†). For Ag and Cu electrocatalysts on the PTFE surface, the deposited metals are shown to be uniformly coating the polymer fibers (Fig. S9, ESI†). EDX analysis of the electrocatalysts also indicates the uniform distribution of catalytic materials on the carbon paper (Fig. S10, ESI†). To verify the oxidation state of the as-prepared electrocatalysts, high resolution XPS is also used. Ag on carbon paper is shown to be in the Ag (0) state (Fig. S11, ESI†), while Cu and Sn consist of mixed metallic states and naturally occurring higher oxidation states (Cu+/Cu2+ and Sn2+) (Fig. S12 and S13, ESI†).
Electrochemical performance
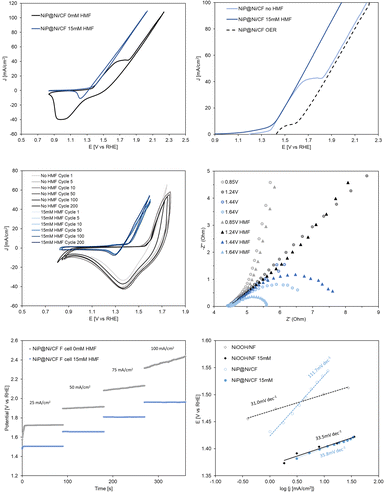 | ||
| Fig. 7 (a) Cyclic voltammetry (10 mV s−1) of NiP@Ni/CF with and without HMF; (b) linear sweep voltammetry (5 mV s−1) of NiP@Ni/CF with and without HMF; (c) recyclability test by cyclic voltammetry (50 mV s−1) over 200 redox cycles on the NiP@Ni/CF electrocatalyst in 1 M KOH with and without HMF; (d) electrochemical impedance spectroscopy (EIS) for NiP@Ni/CF in 1 M KOH with and without HMF (see Fig. S15–S18†); (e) chronopotentiometry of NiP@Ni/CF in 1 M KOH with and without HMF in a flow cell. The graduate increase of applied potential without HMF is due to the production of oxygen gas from the oxygen evolution reaction, which reduced the active surface area of the anode. (f) Tafel slopes of the oxidized NiP electrocatalyst for the HMFOR and OER, compared to NiOOH/Ni foam (potentials are iR-corrected). | ||
LSV of the anode electrocatalyst in 1 M KOH without HMF is performed twice consecutively to obtain the OER background. The exposed Ni species is completely oxidized during the first scan, and the second scan is only attributed to the OER (dash line in Fig. 7b). The onset potential of the NiP electrocatalyst for Ni oxidation and the HMFOR is ∼200 mV smaller than that of the OER from the LSV tests. This indicates that the HMFOR is favoured over the OER under low applied anodic potentials, allowing higher selectivity for the HMFOR. A recyclability test using cyclic voltammetry shows stable reversibility of Ni active sites for 200 redox cycles in 1 M KOH (Fig. 7c). More importantly, the Ni active sites are shown to be stable with unchanged HMFOR activity after 200 redox cycles. In Fig. 7d, electrochemical impedance spectroscopy shows a smaller charge transfer resistance (Rct) with HMF in the electrolyte at an applied potential beyond 1.44 V (non-iR corrected). This again proves that after the onset of the HMFOR, biomass oxidation is favoured over the OER, even after the onset of the OER at an applied potential of 1.64 V.
Stepwise chronopotentiometry is then performed to verify the potential required at each applied current density near the onset of Ni oxidation (Fig. 7e). The results corroborate the previous observation that the NiP electrocatalyst can achieve equivalent current density at lower potential for the HMFOR in contrast to the OER. This illustrates that the higher activity of the HMFOR remains consistent even at higher applied current densities (100 mA cm−2). Tafel slopes are obtained from stepwise chronoamperometry to confirm the higher activity for the HMFOR (35.8 mV dec−1) compared to the OER (111.7 mV dec−1) by the NiP electrocatalyst (Fig. 7f). It also shows that the oxidized NiP electrocatalyst has much smaller Tafel slope for the HMFOR compared to the OER, while a typical NiOOH on Ni foam electrocatalyst has indistinguishable HMFOR and OER Tafel slopes. This emphasizes that the intrinsically higher activity for the HMFOR demonstrated by NiP results in less applied potential to reach the same specific reaction activity.
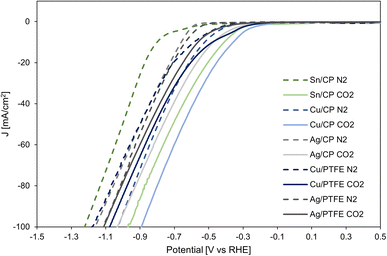
LSV for the cathodic CO2RR on Sn, Cu and Ag electrocatalysts on carbon paper as well as Cu and Ag on the PTFE substrate is shown in Fig. 8. The CO2RR occurs on these electrocatalysts near −0.3 V vs. RHE, while in the absence of CO2 (with only N2 purging in the gas chamber), the hydrogen evolution reaction takes place on the cathode near −0.5 V. The difference in onset potential is the largest for Sn/CP, but all three electrocatalysts demonstrate the activity for the CO2RR over the HER.
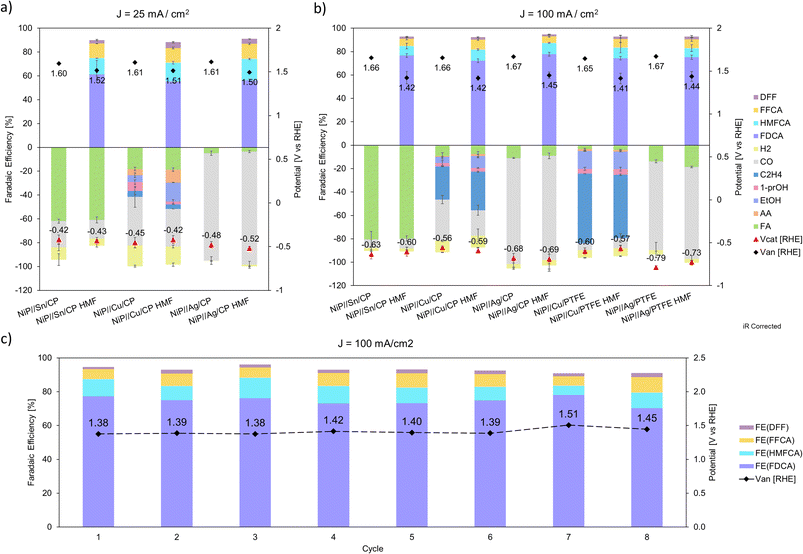
As shown in Fig. 9a and b, in the NiP//Sn/CP combined system with iR correction, the cathodic applied potential is around −0.43 V and −0.61 V at a current density of 25 and 100 mA cm−2, respectively; at high current density, the anodic applied potential decreases to ∼240 mV when 15 mM of HMF is added to the anolyte. Similarly, the NiP//Cu/CP system shows a cathodic applied potential around −0.43 V at low current and −0.57 V at high current, while the anodic counterpart demonstrates a drop of ∼240 mV when the HMFOR replaces the OER at 100 mA cm−2. For NiP//Ag/CP, the cathodic applied potential is −0.50 V and −0.68 V at low and high current density, while anodic potentials drop from 1.67 V to 1.45 V. In combined systems with PTFE as the cathode substrate, both systems at 100 mA cm−2 show a similar drop in anode potential, while NiP//Cu/PTFE requires −0.58 V at the cathode and NiP//Ag/PTFE requires −0.76 V. A repeated test of 8 cycles is carried out on the NiP electrocatalyst in 15 mM HMF, showing a stable anode performance at 1.42 V RHE and >90% total FE for the HMFOR (Fig. 9c). See Table S2 (ESI)† for product summary data and Table S3 (ESI)† for performance comparison.
| Product | Catalyst | Vcat RHE | Van′ RHE | EE (%) | EE′ (%) | Improv. % |
|---|---|---|---|---|---|---|
| Formate | Sn/CP | −0.62 | 1.43 | 52.0 | 57.9 | 11.28 |
| Formate | Cu/CP | −0.58 | 1.43 | 5.5 | 6.2 | 11.52 |
| Acetate | Cu/CP | −0.58 | 1.43 | 0.6 | 0.7 | 11.52 |
| CO | Cu/CP | −0.58 | 1.43 | 17.0 | 19.0 | 11.52 |
| Ethylene | Cu/CP | −0.58 | 1.43 | 15.9 | 17.8 | 11.52 |
| Ethanol | Cu/CP | −0.58 | 1.43 | 3.9 | 4.4 | 11.52 |
| 1-Propanol | Cu/CP | −0.58 | 1.43 | 1.6 | 1.7 | 11.52 |
| CO | Ag/CP | −0.69 | 1.43 | 51.1 | 56.7 | 10.92 |
| Formate | Cu/PTFE | −0.58 | 1.43 | 2.5 | 2.7 | 11.48 |
| Acetate | Cu/PTFE | −0.58 | 1.43 | 0.7 | 0.8 | 11.48 |
| CO | Cu/PTFE | −0.58 | 1.43 | 4.3 | 4.8 | 11.48 |
| Ethylene | Cu/PTFE | −0.58 | 1.43 | 29.6 | 33.0 | 11.48 |
| Ethanol | Cu/PTFE | −0.58 | 1.43 | 7.7 | 8.6 | 11.48 |
| 1-Propanol | Cu/PTFE | −0.58 | 1.43 | 2.3 | 2.5 | 11.48 |
| CO | Ag/PTFE | −0.76 | 1.43 | 42.6 | 47.1 | 10.56 |
Experimental results from the combined system have shown that the objective of high selectivity at high current density with improved system energy efficiency is achieved by replacing the conventional OER with the HMFOR as the anode reaction. This proposed technique in combination with literature results generally gives a predicted improvement in energy efficiency of 10 to 30% (Table S4, ESI†).
Following the experimental results, theoretical calculations are carried out to emphasize the significance of system optimization for future work. The base case is the currently observed CO2RR-OER system. Table S5 (ESI)† illustrates that if the cathode operates ideally (with a cathodic potential approaching the standard potential) and the faradaic efficiency for the CO2RR products reaches 100%, the incorporation of the observed HMFOR catalyzed by NiP into the system would result in an anticipated efficiency of around the mid to high 80% range. This would signify a notable increase of approximately 14 to 18% in comparison to when the OER is the anodic reaction, which means that the improvement by pairing with the HMFOR would be relatively better with an ideal cathode than a non-ideal cathode with respect to each product. Moreover, if the anode reaction is improved for the HMFOR (at 1.36 V vs. RHE where surface Ni2+ is oxidized to Ni3+) with the current cathode performance, as shown in Table S6 (ESI),† the relative improvement on the system with the observed cathode performance would be 14 to 15%. This indicates the universal significance of anode reaction design. It can also be understood that the FE and applied potential on the cathode side greatly affect the cathode and the cell energy efficiencies, whereas the incorporation of the HMFOR would yield a relatively similar increase in cell EE on top of it. Hence, the initial focus for enhancement is on elevating the cathode FE, given its direct impact on energy efficiency. Subsequently, identifying a suitable anode reaction that substantially reduces the additional energy consumption at the anode stands out as another key step.
To illustrate the energy saving, more stringent parameters are introduced. Similar to the VE, dividing the cell voltage of the CO2RR-OER at 100 mA cm−2 by the improved cell voltage demonstrates a voltage saving factor (ηV) of the new setup. This is then multiplied by the FE of each half cell to obtain the cell energy saving factor, ηcell. The numerical value of ηV, ηcell and the relative improvement are summarized in Table S7 (ESI).† These results show a general improvement in ηV, while the formate production by Sn/CP and the CO production by Ag/CP have the highest ηcell, given their robust cathodic FE. Cu/CP in contrast suffers from low FE for multiple products. When combined with the NiP, even with >90% HMFOR FE, the ηcell results are still below 1 for all the tests. In addition to optimizing the cathode FE, the combined test results indicate that further advancement at the anodic half-cell is needed. It should be noticed that the conventional OER has by default 100% FE, so the only way of increasing the anode energy saving is to further lower the applied anode potential while keeping a high FE. Since the HMFOR is active after the presence of Ni3+ (1.36 V vs. RHE), the theoretical maximum ηcell for the CO2RR-HMFOR system via Ni3+-based electrocatalysts will occur when the anode potential is 1.36 V, which gives 19 to 24% energy saving improvement on the current CO2RR-OER system, as shown in Table S8 (ESI).† This leads to the understanding that developing a better electrocatalyst for the HMFOR at lower applied potential is the key to increasing the energy saving for the coupled CO2RR-HMFOR system.
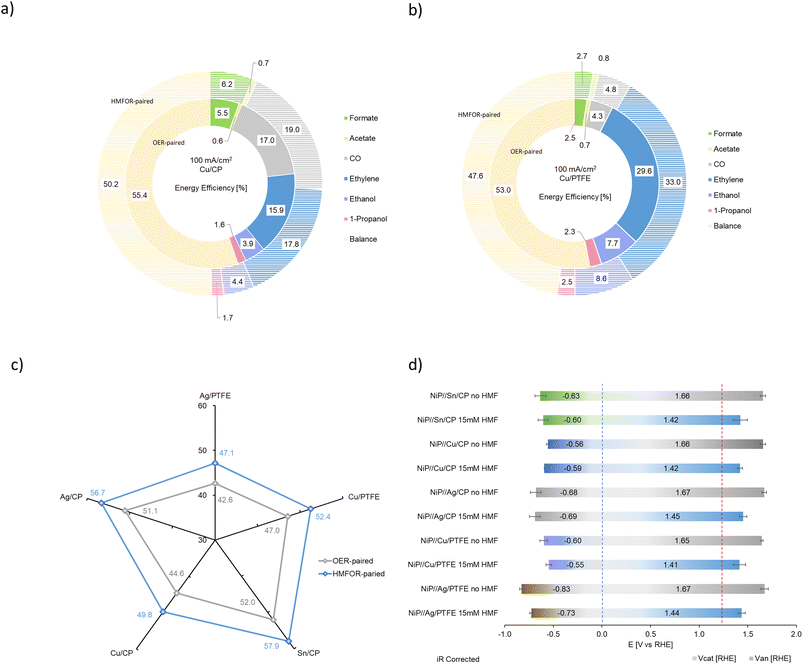
As shown in Fig. 10d, the distribution of applied potentials after iR correction demonstrates that with the HMFOR replacing the OER, there is still room to improve the applied voltage on both the cathode and the anode. Obviously, on the cathode, the thermodynamic potential depends on the type of the carbon dioxide reduction product formed, but as the applied potential approaches the thermodynamic potential of the HER at 0 V vs. RHE (blue dotted line), it is more likely to achieve higher faradaic efficiency, hence higher energy efficiency, while suppressing hydrogen evolution. On the other hand, since the thermodynamic potential for the OER is 1.23 V (red dotted line), operating at a potential lower than 1.23 V for the anodic reaction will yield even higher energy saving in the CO2RR system. Besides the energy analysis, one should also consider the economic benefits of the HMFOR.
Economic analysis
The economic analysis is performed to evaluate the NPV and LCP (levelized cost of production) for the process. To estimate NPV and LCP, the capital expenditure (CAPEX), the operating expenditure (OPEX), and the annual profit are evaluated. A 39.8% tax rate and 10% internal rate of return (IRR) are assumed. All cash flows/prices are calculated as of 2023. The end-of-life NPV is calculated using the following eqn (13): | (13) |
A base case scenario is set based on current experiment and literature data, with current market values. Then a pessimistic case and an optimistic case are set to compare by considering the performance in reality and possible improvement in the future, with volatility in the market. The model of the conventional CO2RR-OER system is based on techno-economic parameters as shown in Table 3, while the typical HMFOR-HER setup is modeled using parameters shown in Table 4.
| CO2RR-OER parameter | Unit | Pessimistic case | Base case | Optimistic case |
|---|---|---|---|---|
| Cell voltage | V | 4.4 | 2.2 | 1.76 |
| Electricity price | $ per kW h | 0.04 | 0.03 | 0.02 |
| Electrolyzer unit cost | $ per m2 | 920 | 460 | 230 |
| Current density | A cm−2 | 0.05 | 0.1 | 0.15 |
| Formate FE | % | 70 | 80 | 90 |
| CO2 price | $ per kg | 0.06 | 0.04 | 0.02 |
| Water price | $ per kg | 0.004 | 0.003 | 0.002 |
| KOH price | $ per kg | 1.59 | 1.33 | 1.06 |
| Single pass conversion | % | 30 | 50 | 70 |
| HMFOR-HER Parameter | Unit | Pessimistic case | Base case | Optimistic case |
|---|---|---|---|---|
| Cell voltage | V | 4 | 2 | 1.6 |
| Electricity price | $ per kW h | 0.04 | 0.03 | 0.02 |
| Electrolyzer unit cost | $ per m2 | 920 | 460 | 230 |
| Current density | A cm−2 | 0.05 | 0.1 | 0.15 |
| FDCA FE | % | 85 | 90 | 95 |
| HMF price | $ per kg | 1.28 | 1.07 | 0.86 |
| Water price | $ per kg | 0.004 | 0.003 | 0.002 |
| KOH price | $ per kg | 1.59 | 1.33 | 1.06 |
| H2SO4 price | $ per kg | 0.52 | 0.26 | 0.13 |
The electrochemical reduction of carbon dioxide to formic acid often faces a challenge in downstream separation costs due to the relatively low concentration of the product.62 To set up a simpler model, we look at potassium formate as the final CO2RR product, which is a result of formate ions produced combining with potassium ions in the electrolyte. However, in this alkaline AEM system, the drawback is obvious – CO2 consumption can be ∼30% in the electrolyte forming bicarbonate.63 It is therefore assumed that CO2 would be reacting with KOH to produce a certain amount of bicarbonate, which is the major impurity. The removal of bicarbonate is expected in a crystallizer. The bleed from the crystallizer containing a higher concentration of potassium formate will then be for sale in the form of solution.
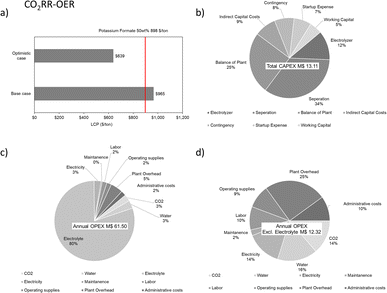
The selling price of potassium formate (50 wt%) is estimated to be 898 $ per ton, with an average annual inflation of 5%.42 LCP of the formate is shown to be reasonable as the current market price lies between the base case (964.49 $ per ton) and the optimistic case (638.81 $ per ton), closer to the base case (Fig. 11a). This means in the optimistic case, there is a larger room to adjust the selling price to account for extra costs or to generate more revenue. The economic analysis estimated for the plant is based on potassium formate production throughput of 100 tonnes per day for a project lifetime of 20 years with 90% operation factor. The CAPEX of a CO2RR-OER system considering the process areas (excluding storage warehouse, buildings, utility, site development etc.) is estimated to be 13 M$ while the OPEX is much higher (62 M$ per y) due to the electrolyte consumption (KOH, 80%), as shown in Fig. 11.
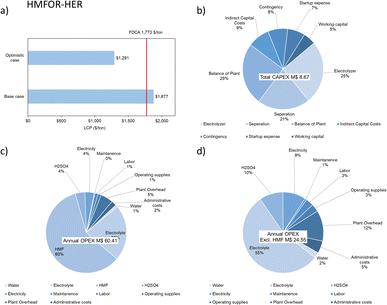
In earlier literature, the selling price of FDCA was found to be 3175 $ per ton.67 Kim et al. later estimated that the minimum selling price for FDCA to be 1532 $ per ton in 2020.44 Hence, we estimated the selling price to be 1773 $ per ton in 2023 with an average annual inflation of 5%. In the optimistic case, the LCP of FDCA can be much lower, giving room to account for extra costs or to generate more revenue, as shown in Fig. 12a. The economic analysis estimated for the plant is based on FDCA production throughput of 100 tonnes per day for a project lifetime of 20 years with 90% operation factor. The CAPEX of a HMFOR-HER system considering the process areas (excluding storage warehouse, buildings, utility, site development etc.) is estimated to be 9 M$. Similar to the CO2RR-OER case, the OPEX is also much higher (60 M$ per y) due to the feed material (HMF, 60%) and electrolyte consumption (KOH, 22%), as shown in Fig. 12.
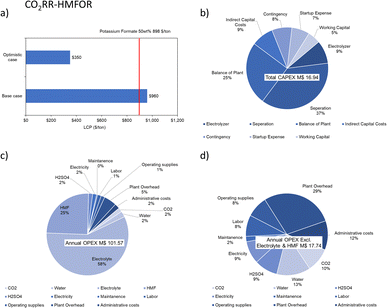
With the same basis on potassium formate production throughput, project lifetime and operation factor, while using the HMFOR in the anode, the economic analysis shows a general improvement. In the combined system, the LCP of the formate becomes lower in both the base case (959.73 $ per ton) and the optimistic case (350.05 $ per ton), giving a 55% decrease compared to the optimistic LCP (638.81 $ per ton) from the conventional system. The CAPEX considering the process areas (excluding storage warehouse, buildings, utility, and site development, etc.) is estimated to be 17 M$ while the OPEX is 102 M$ per y due to the electrolyte consumption (KOH, 58%) and feed material (HMF, 25%), as shown in Fig. 13. This indicates a heavier front investment and higher operation costs but a greater revenue to make up the costs compared to the CO2RR-OER case.
| CO2RR-HMFOR parameter | Unit | Pessimistic case | Base case | Optimistic case |
|---|---|---|---|---|
| Cell voltage | V | 4 | 2 | 1.6 |
| Electricity price | $ per kW h | 0.04 | 0.03 | 0.02 |
| Electrolyzer unit cost | $ per m2 | 920 | 460 | 230 |
| Current density | A cm−2 | 0.05 | 0.1 | 0.15 |
| Formate FE | % | 70 | 80 | 90 |
| CO2 price | $ per kg | 0.06 | 0.04 | 0.02 |
| Water price | $ per kg | 0.004 | 0.003 | 0.002 |
| KOH price | $ per kg | 1.59 | 1.33 | 1.06 |
| Single pass conversion | % | 30 | 50 | 70 |
| HCOOK throughput | t day−1 | 100 | 100 | 120 |
| FDCA FE | % | 85 | 90 | 95 |
| HMF price | $ per kg | 1.28 | 1.07 | 0.86 |
| H2SO4 price | $ per kg | 0.52 | 0.26 | 0.13 |
| FDCA selling price | t day−1 | 1418 | 1773 | 2128 |
 | ||
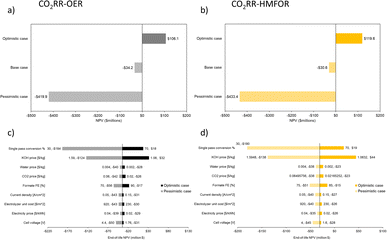
| Fig. 15 Three cases of varying CO2RR and HMFOR parameters generate (a) NPV results on the CO2RR-HMFOR; followed by (b) sensitivity analyses done using the same parameters on the same system. | ||
Given the top influencers being CO2 single pass conversion and the chemical prices (KOH, HMF and FDCA), the recommended priority for improvement is optimization of the CO2 half-cell as well as securing feedstock/product prices.
Conclusions
The successful synthesis of the NiP electrocatalyst by facile electrodeposition generates Ni2+/Ni3+ active sites in the catalytic surface layer characterized by SEM-EDX, XRD, XPS and XAS. We demonstrated its robust activity in the 5-HMF oxidation reaction thanks to the synergistic incorporation of phosphorus in the electrodeposited nickel catalyst, which makes it a feasible alternative to the OER in a conventional CO2 reduction electrolyzer. High selectivity (>90%) and stability (>200 CV cycles) of the HMFOR are achieved in a flow cell electrolyzer paired with the cathodic CO2RR at a current density of 100 mA cm−2 for the first time. The combined system is shown to simultaneously produce FDCA and value-added CO2RR products such as CO, formate, and C2+ products with consistent cathode FE and a global improvement of 11–12% energy efficiency relative to the conventional OER-paired system. Through a techno-economic analysis, the combined system has shown economic benefits including lower electricity costs, an additional NPV gain from FDCA production and a potential > M$100 NPV gain with anode optimization. Sensitivity analysis emphasizes the heavy dependence of NPV on CO2 conversion and chemical prices. It is concluded that the combination of an anode reaction which simultaneously lowers the energy requirement and produces a valuable product is beneficial to the current CO2RR electrolyzer. Recommendations for the future study include electrocatalyst development, flow-cell design (potential membrane-less setup), process optimization, feed composition and temperature effect.Author contributions
Conceptualization: RL, HY, and HZ. Data curation: RL, HY, HZ, MS, JG, and KL. Investigation: RL, HY, HZ, MS, AF, and PP. Software analysis: MS and AF. Visualization: ZG, XL, and RL. Writing: RL, HY, and HZ. Review & editing: PP, XW, JG, MS, XL, and AS. Supervision: AS.Conflicts of interest
There are no conflicts to declare.Acknowledgements
This work was partly supported by Fonds de recherche du Québec – Nature et technologies (FRQNT) Master Scholarship, FRQNT New Researchers Fund, Eugenie Ulmer Lamothe (EUL) Summer Scholarship, NSERC Discovery Grant, Canada Research Chair, and CFI-JELF. The synchrotron XAS was done at the Canadian Light Source (CLS) in Saskatchewan, Canada.References
- S. Ma, Y. Lan, G. M. J. Perez, S. Moniri and P. J. A. Kenis, ChemSusChem, 2014, 7, 866–874 CrossRef CAS PubMed.
- A. Löwe, M. Schmidt, F. Bienen, D. Kopljar, N. Wagner and E. Klemm, ACS Sustain. Chem. Eng., 2021, 9, 4213–4223 CrossRef.
- W. Guo, S. Liu, X. Tan, R. Wu, X. Yan, C. Chen, Q. Zhu, L. Zheng, J. Ma, J. Zhang, Y. Huang, X. Sun and B. Han, Angew Chem. Int. Ed. Engl., 2021, 60, 21979–21987 CrossRef CAS PubMed.
- W. J. Teh, O. Piqué, Q. H. Low, W. Zhu, F. Calle-Vallejo and B. S. Yeo, ACS Catal., 2021, 11, 8467–8475 CrossRef CAS.
- H. Yang, Y. Wu, G. Li, Q. Lin, Q. Hu, Q. Zhang, J. Liu and C. He, J. Am. Chem. Soc., 2019, 141, 12717–12723 CrossRef CAS PubMed.
- X. Wang, Z. Wang, F. P. García de Arquer, C.-T. Dinh, A. Ozden, Y. C. Li, D.-H. Nam, J. Li, Y.-S. Liu, J. Wicks, Z. Chen, M. Chi, B. Chen, Y. Wang, J. Tam, J. Y. Howe, A. Proppe, P. Todorović, F. Li, T.-T. Zhuang, C. M. Gabardo, A. R. Kirmani, C. McCallum, S.-F. Hung, Y. Lum, M. Luo, Y. Min, A. Xu, C. P. O'Brien, B. Stephen, B. Sun, A. H. Ip, L. J. Richter, S. O. Kelley, D. Sinton and E. H. Sargent, Nat. Energy, 2020, 5, 478–486 CrossRef CAS.
- J. E. Huang, F. Li, A. Ozden, A. Sedighian Rasouli, F. P. García de Arquer, S. Liu, S. Zhang, M. Luo, X. Wang, Y. Lum, Y. Xu, K. Bertens, R. K. Miao, C.-T. Dinh, D. Sinton and E. H. Sargent, Science, 2021, 372, 1074–1078 CrossRef CAS PubMed.
- C. T. Dinh, T. Burdyny, M. G. Kibria, A. Seifitokaldani, C. M. Gabardo, F. P. G. de Arquer, A. Kiani, J. P. Edwards, P. De Luna, O. S. Bushuyev, C. Q. Zou, R. Quintero-Bermudez, Y. J. Pang, D. Sinton and E. H. Sargent, Science, 2018, 360, 783–787 CrossRef CAS PubMed.
- F. P. García de Arquer, C.-T. Dinh, A. Ozden, J. Wicks, C. McCallum, A. R. Kirmani, D.-H. Nam, C. Gabardo, A. Seifitokaldani, X. Wang, Y. C. Li, F. Li, J. Edwards, L. J. Richter, S. J. Thorpe, D. Sinton and E. H. Sargent, Science, 2020, 367, 661–666 CrossRef PubMed.
- C. M. Gabardo, A. Seifitokaldani, J. P. Edwards, C.-T. Dinh, T. Burdyny, M. G. Kibria, C. P. O'Brien, E. H. Sargent and D. Sinton, Energy Environ. Sci., 2018, 11, 2531–2539 RSC.
- C.-T. Dinh, F. P. García de Arquer, D. Sinton and E. H. Sargent, ACS Energy Lett., 2018, 3, 2835–2840 CrossRef CAS.
- M. Jouny, W. Luc and F. Jiao, Ind. Eng. Chem. Res., 2018, 57, 2165–2177 CrossRef CAS.
- M. G. Kibria, J. P. Edwards, C. M. Gabardo, C. T. Dinh, A. Seifitokaldani, D. Sinton and E. H. Sargent, Adv. Mater., 2019, 31, e1807166 CrossRef PubMed.
- J. Qiao, Y. Liu and J. Zhang, Electrochemical Reduction of Carbon Dioxide: Fundamentals and Technologies, CRC Press, Taylor & Francis Group, Boca Raton, 2016 Search PubMed.
- W. Li, D. Xiong, X. Gao and L. Liu, Chem. Commun., 2019, 55, 8744–8763 RSC.
- S. Verma, S. Lu and P. J. A. Kenis, Nat. Energy, 2019, 4, 466–474 CrossRef CAS.
- J. Na, B. Seo, J. Kim, C. W. Lee, H. Lee, Y. J. Hwang, B. K. Min, D. K. Lee, H. S. Oh and U. Lee, Nat. Commun., 2019, 10, 5193 CrossRef PubMed.
- A. Vass, A. Kormanyos, Z. Koszo, B. Endrodi and C. Janaky, ACS Catal., 2022, 12, 1037–1051 CrossRef CAS PubMed.
- H. Liu, D. Guo, W. Zhang and R. Cao, J. Mater. Res., 2017, 33, 568–580 CrossRef.
- H. Chu, D. Zhang, B. Jin and M. Yang, Appl. Catal., B, 2019, 255, 117744 CrossRef CAS.
- J. Tong, W. Ma, L. Bo, T. Li, W. Li, Y. Li and Q. Zhang, J. Power Sources, 2019, 441, 227166 CrossRef CAS.
- Z. Gohari-Bajestani, X. Wang, A. Guiet, R. Moury, J.-M. Grenèche, A. Hémon-Ribaud, Y. Zhang, D. Chartrand, V. Maisonneuve, A. Seifitokaldani, N. Kornienko and J. Lhoste, Chem Catal., 2022, 2, 1114–1127 CrossRef CAS.
- X. Du, L. Yin, W. Zhang, M. Zhang, K. Su and Z. Li, J. Mater. Sci. Technol., 2023, 135, 26–33 CrossRef CAS.
- J. Lan, J. Lin, Z. Chen and G. Yin, ACS Catal., 2015, 5, 2035–2041 CrossRef CAS.
- P. Hauke, T. Merzdorf, M. Klingenhof and P. Strasser, Nat. Commun., 2023, 14, 4708 CrossRef CAS PubMed.
- S. Barwe, J. Weidner, S. Cychy, D. M. Morales, S. Dieckhöfer, D. Hiltrop, J. Masa, M. Muhler and W. Schuhmann, Angew. Chem., Int. Ed., 2018, 57, 11460–11464 CrossRef CAS PubMed.
- E. de Jong, M. A. Dam, L. Sipos and G. J. M. Gruter, in Biobased Monomers, Polymers, and Materials, American Chemical Society, 2012, ch. 1, vol. 1105, pp. 1–13 Search PubMed.
- N. Heidary and N. Kornienko, Chem. Commun., 2019, 55, 11996–11999 RSC.
- J. Bi, Q. Zhu, W. Guo, P. Li, S. Jia, J. Liu, J. Ma, J. Zhang, Z. Liu and B. Han, ACS Sustain. Chem. Eng., 2022, 10, 8043–8050 CrossRef CAS.
- J. Wu, Z. Kong, Y. Li, Y. Lu, P. Zhou, H. Wang, L. Xu, S. Wang and Y. Zou, ACS Nano, 2022, 16, 21518–21526 CrossRef CAS PubMed.
- J. Guo, M. Abdinejad, A. Farzi, M. Salehi and A. Seifitokaldani, Energy Adv., 2023, 2, 877–885 RSC.
- R. Latsuzbaia, R. Bisselink, A. Anastasopol, H. van der Meer, R. van Heck, M. S. Yagüe, M. Zijlstra, M. Roelands, M. Crockatt, E. Goetheer and E. Giling, J. Appl. Electrochem., 2018, 48, 611–626 CrossRef CAS.
- S. R. Kubota and K.-S. Choi, Chemsuschem, 2018, 11, 2138–2145 CrossRef CAS PubMed.
- B. You, N. Jiang, X. Liu and Y. Sun, Angew. Chem., Int. Ed., 2016, 55, 9913–9917 CrossRef CAS PubMed.
- B. You, N. Jiang, M. Sheng, M. W. Bhushan and Y. Sun, ACS Catal., 2016, 6, 714–721 CrossRef CAS.
- B. You, X. Liu, N. Jiang and Y. Sun, J. Am. Chem. Soc., 2016, 138, 13639–13646 CrossRef CAS PubMed.
- Y. Sun, J. Wang, Y. Qi, W. Li and C. Wang, Adv. Sci., 2022, 9, e2200957 CrossRef PubMed.
- B. Liu, S. Xu, M. Zhang, X. Li, D. Decarolis, Y. Liu, Y. Wang, E. K. Gibson, C. R. A. Catlow and K. Yan, Green Chem., 2021, 23, 4034–4043 RSC.
- S. Choi, M. Balamurugan, K.-G. Lee, K. H. Cho, S. Park, H. Seo and K. T. Nam, J. Phys. Chem. Lett., 2020, 11, 2941–2948 CrossRef CAS PubMed.
- Y. Yang and T. Mu, Green Chem., 2021, 23, 4228–4254 RSC.
- Z. Huang, R. G. Grim, J. A. Schaidle and L. Tao, Energy Environ. Sci., 2021, 14, 3664–3678 RSC.
- K. Oen, Master, Norwegian University of Science and Technology 2017 Search PubMed.
- ChemAnalyst,Ethylene Price Trend and Forecast, https://www.chemanalyst.com/Pricing-data/ethylene-40, (accessed July 15, 2023) Search PubMed.
- H. Kim, J. Choi, J. Park and W. Won, Green Chem., 2020, 22, 7070–7079 RSC.
- W. Li, L. Xin, X. Xu, Q. Liu, M. Zhang, S. Ding, M. Zhao and X. Lou, Sci. Rep., 2015, 5, 9277 CrossRef CAS PubMed.
- K. Wang, Y. Si, Z. Lv, T. Yu, X. Liu, G. Wang, G. Xie and L. Jiang, Int. J. Hydrogen Energy, 2020, 45, 2504–2512 CrossRef CAS.
- S. Enzo, G. Fagherazzi, A. Benedetti and S. Polizzi, J. Appl. Crystallogr., 1988, 21, 536–542 CrossRef.
- F. S. Zhang, J. W. Wang, J. Luo, R. R. Liu, Z. M. Zhang, C. T. He and T. B. Lu, Chem. Sci., 2018, 9, 1375–1384 RSC.
- R. Lin, M. Salehi, J. Guo and A. Seifitokaldani, iScience, 2022, 25, 104744 CrossRef CAS PubMed.
- M. Fleischmann, K. Korinek and D. Pletcher, J. Electroanal. Chem. Interfacial Electrochem., 1971, 31, 39–49 CrossRef CAS.
- M. S. E. Houache, K. Hughes, A. Ahmed, R. Safari, H. Liu, G. A. Botton and E. A. Baranova, ACS Sustain. Chem. Eng., 2019, 7, 14425–14434 CrossRef CAS.
- M. T. Bender, Y. C. Lam, S. Hammes-Schiffer and K. S. Choi, J. Am. Chem. Soc., 2020, 142, 21538–21547 CrossRef CAS PubMed.
- J. van Drunen, T. W. Napporn, B. Kokoh and G. Jerkiewicz, J. Electroanal. Chem., 2014, 716, 120–128 CrossRef CAS.
- Z. Li, X. Dou, Y. Zhao and C. Wu, Inorg. Chem. Front., 2016, 3, 1021–1027 RSC.
- J. Masa, S. Barwe, C. Andronescu, I. Sinev, A. Ruff, K. Jayaramulu, K. Elumeeva, B. Konkena, B. Roldan Cuenya and W. Schuhmann, ACS Energy Lett., 2016, 1, 1192–1198 CrossRef CAS.
- B. Zhang, H. Fu and T. Mu, Green Chem., 2022, 24, 877–884 RSC.
- N. Zhang, Y. Zou, L. Tao, W. Chen, L. Zhou, Z. Liu, B. Zhou, G. Huang, H. Lin and S. Wang, Angew. Chem., Int. Ed., 2019, 58, 15895–15903 CrossRef CAS PubMed.
- V. Chakarian and Y. U. Idzerda, J. Appl. Phys., 1997, 81, 4709 CrossRef CAS.
- P. Zhang, X. Sheng, X. Chen, Z. Fang, J. Jiang, M. Wang, F. Li, L. Fan, Y. Ren, B. Zhang, B. J. J. Timmer, M. S. G. Ahlquist and L. Sun, Angew. Chem. Int. Ed., 2019, 58, 9155–9159 CrossRef CAS PubMed.
- Y. Zhu, C. Cao, S. Tao, W. Chu, Z. Wu and Y. Li, Sci. Rep., 2014, 4, 5787 CrossRef CAS PubMed.
- T.-T. Zhuang, Z.-Q. Liang, A. Seifitokaldani, Y. Li, P. De Luna, T. Burdyny, F. Che, F. Meng, Y. Min, R. Quintero-Bermudez, C. T. Dinh, Y. Pang, M. Zhong, B. Zhang, J. Li, P.-N. Chen, X.-L. Zheng, H. Liang, W.-N. Ge, B.-J. Ye, D. Sinton, S.-H. Yu and E. H. Sargent, Nat. Catal., 2018, 1, 421–428 CrossRef CAS.
- C. Kim, Y. Lee, K. Kim and U. Lee, Catalysts, 2022, 12 Search PubMed.
- H. Shin, K. U. Hansen and F. Jiao, Nat. Sustain., 2021, 4, 911–919 CrossRef.
- S. Bello, P. Méndez-Trelles, E. Rodil, G. Feijoo and M. T. Moreira, Sep. Purif. Technol., 2020, 233 Search PubMed.
- C. Chen, L. Wang, B. Zhu, Z. Zhou, S. I. El-Hout, J. Yang and J. Zhang, J. Energy Chem., 2021, 54, 528–554 CrossRef CAS.
- P. Patel, D. Schwartz, X. Wang, R. Lin, O. Ajao and A. Seifitokaldani, ACS Sustain. Chem. Eng., 2022, 10, 4206–4217 CrossRef CAS.
- C. Triebl, V. Nikolakis and M. Ierapetritou, Comput. Chem. Eng., 2013, 52, 26–34 CrossRef CAS.
- V. M. Research, Potassium Formate Market Size and Forecast, https://www.verifiedmarketresearch.com/product/potassium-formate-market/, (accessed October 23, 2022) Search PubMed.
Footnotes |
| † Electronic supplementary information (ESI) available. See DOI: https://doi.org/10.1039/d3su00379e |
| ‡ These authors contributed equally to this work. |
| This journal is © The Royal Society of Chemistry 2024 |

