 Open Access Article
Creative Commons Attribution 3.0 Unported Licence
Sustainable low temperature carrier gas-free growth of graphene on non-catalytic substrates†
Laurance
Papale
 a,
Bronson
Philippa
 *a,
Boris
Makarenko
b,
Oomman K.
Varghese
 cd and
Mohan V.
Jacob
 *e
*e
aJames Cook University, 1/14-88 McGregor Road, Cairns, Australia. E-mail: bronson.philippa@jcu.edu.au
bDepartment of Chemistry, University of Houston, Houston, Texas 77204, USA
cNanomaterials and Devices Laboratory, University of Houston, Houston, Texas 77204, USA
dTexas Center for Superconductivity, University of Houston, Houston, Texas 77204, USA
eJames Cook University, James Cook University Drive, Townsville, Australia. E-mail: mohan.jacob@jcu.edu.au
First published on 1st February 2024
Abstract
Significant advancements have been made in the manufacturing of vertically aligned graphene; however a key limitation is that existing methods are largely unsustainable due to high energy usage, non-renewable precursors and carrier gases, and costly substrates. We address these key issues through the development of a novel methodology for vertically aligned graphene growth on soda-lime glass that utilizes low temperatures and sustainable materials without the need for catalytic substrates or carrier gases. Our analysis shows that it is possible to grow sustainable, device grade graphene using low-temperature plasma enhanced chemical vapour deposition. We further demonstrate how our vertically aligned graphene on glass can function as a humidity sensor with a response faster than a typical commercially available sensor, highlighting the potential of the proposed method for producing sustainable graphene-based sensors.
Sustainability spotlightGraphene is a highly versatile material aligned with several UN Sustainable Development Goals. Its properties enable advancements towards affordable clean energy (Goal 7), clean water for all (Goal 6), healthcare (Goal 3), industry innovation (Goal 9), and sustainable cities (Goal 11). However, current methods for graphene production are unsustainable. Our paper proposes a methodology for sustainable graphene growth using lower temperatures and renewable precursors and substrates, supporting responsible consumption and production (Goal 12) of this important material. We demonstrate that our sustainable graphene functions as a sensor for accurate measurement of humidity, supporting environmental monitoring for sustainable cities (Goal 11) and supporting climate action (Group 13). This work is a critical step towards sustainable production and utilisation of graphene. |
1 Introduction
Graphene and graphene-like materials have become some of the most researched materials of the 21st century.1 Their unique electrical, mechanical and optical properties have made them candidates for applications including energy conversion and storage,2–4 photovoltaics,5–7 electronics,8 water purification9 and electrolysis,10 sensing11–14 and bio-sensing,15 anti-corrosion films16 and biomedical applications.17–19 One promising material is vertically aligned graphene (VG) which consists of graphene sheets, typically with a few layers, that have been grown or attached perpendicular to a substrate. VG has favourable properties in a range of applications due its large specific surface area and high conductivity and abundance of exposed edges. It has shown promise in applications including electrodes for energy storage devices, including batteries and super-capacitors,20–22 as well as sensors for humidity,23,24 toxins25 and other gases.26 However, VG production is not currently considered sustainable.To be truly sustainable, a material must be producible on a large scale from renewable materials without negative impacts on the environment while minimising costs across the entire life cycle. More specifically a sustainable material must minimise the energy, water and resource usage without producing harmful wastes.27 By these criteria, most methods of graphene production are not sustainable.
While there are limited studies of the full life cycle analysis of graphene-like materials, a recent work28 outlined that graphene currently produced via top down synthesis is overall less sustainable than using activated carbon due to the energy used in production. Renewable precursors have been widely used for graphene production; however, advancements in technology are still required to address the high energy consumption and use of harsh chemicals.27
Vertically aligned graphene can be produced with consistent properties on a large area via bottom-up synthesis. While other methods including pyrolysis29 exist for bottom-up synthesis for graphene-like materials, chemical vapor deposition (CVD) and plasma enhanced chemical vapor deposition (PECVD)30 are the most widely used for sustainable bottom-up synthesis of graphene. In these processes, a carbon source is decomposed under a controlled atmosphere using heat alone (in CVD) or a combination of heat and plasma (in PECVD). The carbon is then able to form graphene on a substrate.
There are various parameters that should be controlled to produce high quality graphene. Not only does each parameter influence graphene growth, but they also contribute to the sustainability and cost effectiveness of the process. The key parameters used for graphene production via PECVD are the precursor, temperature, plasma power, carrier gases, growth time, and substrate. While all of these parameters affect sustainability, most works focusing on sustainable graphene production primarily emphasise the use of renewable and sustainable precursors.
By far the most common precursor for graphene production is methane.8,31 Solid carbon sources including graphite paper,32 fullerene soot33 and coal34 have been trialed with varying success, as have other hydrocarbons.35,36 Methane is considered an unsustainable precursor and leads to a high cost of production as a result of high transport and storage costs. Most works focusing on less costly and more sustainable graphene production have attempted to use alternative precursors. In early works, butter and honey were used as graphene precursors, which were estimated to have much lower cost of production.37,38 Other studies have used soybean oil,39 again recording a lower cost of production compared to methane. Various waste products including tires,40 agricultural waste,20 food wastes,41 animal wastes, and even insects have also been successfully trialed for graphene production.42
In general, biomasses from various sources are attractive precursors for the sustainable production of graphene. Both solid and liquid biomasses contain a high carbon content, have a low or negative monetary value, are easy to store and transport, and are renewable by nature. Orange oil43 and other essential oils44 have previously been used as graphene precursors for similar capacitively coupled PECVD apparatuses. These oils have the advantage over other precursors in that they can easily evaporated into a vacuum system at a controlled rate. Orange oil in particular is more attractive over other essential oils since it is a by-product of the juicing industry. This means that crops are not grown specifically for orange oil production; instead, orange oil is collected as waste,45 making it not only more sustainable but also considerably cheaper than other essential oils.46
Another important factor for the sustainability of a method is growth temperature. In general, higher temperatures require more energy, increasing cost and reducing sustainability. Early reports of bottom up graphene production via CVD required temperatures of greater than 1000 °C in order to produce high quality graphene samples.47–49 The use of a metal catalyst allowed the temperature to be reduced.50,51 When PECVD was identified as a method of graphene production, it promised a more efficient process requiring considerably lower temperatures in the range of 800 to 1000 °C. With the addition of energy via plasma, the overall temperature and heating time can be greatly reduced, resulting in an overall lower energy usage. PECVD also showed the ability to rapidly produce graphene, without metal catalysts and with the ability to grow vertically aligned graphene.52
More recently, graphene and VG has been manufactured at lower temperatures ranging from 450 °C to 800 °C.8,11,53,54 While this process still requires a catalyst, the lower temperature requirements and simpler apparatus lead to PECVD becoming a significant renewable and environmental friendly method of graphene production. While the addition of a catalyst may reduce the energy requirements for PECVD, the sustainability of the substrate, catalyst and its removal must also be taken into account.
Due to the high temperatures required for CVD, silicon and quartz substrates are typically used. These substrates are useful for sample analysis and are widely used for PECVD, however they are both costly and non-catalytic. In order to reduce the growth temperature, these substrates are usually coated with a catalyst, such as nickel or copper, or a catalyst is introduced via a hot wire55 or placed in close proximity to the substrate.56 When growth is complete the graphene is transferred to another substrate or the catalyst is removed using a range of methods. The additional steps can impact the quality of the graphene produced and reduce the sustainability of the procedure requiring harmful or unsustainable chemicals. Conversely, under specific conditions graphene can be produced via PECVD without a catalyst, allowing graphene to be grown on a wider range of substrates, reducing both complexity and cost. For example, with a reduction in temperature, sodium chloride could be used as a substrate which could then be easily removed by simply dissolving the substrate in water.57
The final parameter that must be controlled is the addition of carrier gasses. In the PECVD process, various gasses are introduced to control the growth of graphene and remove impurities including amorphous carbon. While the use of biomass as a precursor eliminated the need to supply high purity methane, the majority of biomass precursors are transported to the reaction chamber using carrier gasses including H2, Ar and N2.53 The use of carrier gasses increases both the material cost and apparatus cost as well as the complexity of the production.
In this article, we present an approach to produce graphene in a sustainable manner. We show that vertically aligned graphene can be grown directly on low cost and widely available soda-lime glass substrates using capacitively coupled PECVD and an inexpensive and renewable precursor. Our process does not require a carrier gas for the graphene growth. Moreover, the power and time requirements are not substantial for our process. To the best of our knowledge, this work is the first to produce vertically aligned graphene under such highly desirable conditions.
1.1 Original contributions
This paper demonstrates a methodology for the sustainable growth of vertically aligned graphene via capacitively coupled PECVD from a cheap and renewable precursor, without the use of a catalyst or carrier gasses. This method ensures that the overall cost of both apparatus and production is significantly reduced. Finally, the lower growth temperature allows for the production of graphene on more affordable soda-glass microscope slides instead of costly quartz or silicon substrates.2 Experimental
2.1 Materials and preparation
Standard 1′′ × 3′′ soda-lime microscope slides manufactured by Knittel Glass were cleaved into approximately 5 mm × 10 mm pieces along with silicon wafers with a thermal oxide layer and quartz. All substrates were sonicated and rinsed in isopropyl alcohol to ensure they were clean before they were dried with compressed air. Orange oil was supplied by Australian Botanical Products Ltd and consisting of 95% D-limonene, 2% β-myrcene, and various terpenes and aldehydes.58 Conductive varnish was manufactured by Kemo Electric.2.2 Graphene production
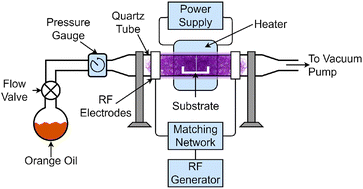
The apparatus shown in Fig. 1 was used for the production of graphene. A 50 mm quartz tube was used as a reaction chamber for capacitively coupled PECVD with a 450 mm electrode spacing. The substrates were placed in the reaction chamber, which was then heated using a tube heater. The chamber was then evacuated using an Edwards T-Station 85 pumping station. The substrates were heated under vacuum to the desired temperature.Once a stable temperature was obtained, a needle valve was opened allowing a pre-measured amount of orange oil precursor to flow into the reaction chamber. The valve was adjusted until a pressure of 10−1 mBar was obtained, and was further adjusted to maintain a stable plasma throughout the growth process. Finally, the chamber was ionized with a 13.56 MHz RF generator set to 500 W forward power through a matching network. This started the growth process, which was timed precisely for 3 minutes. This growth period was chosen as it allowed for consistent growth of VG across the entire substrate.
After the allocated time, the plasma source was deactivated, ending the growth phase. At this point, both the RF generator and heater were turned off to allow the substrates and newly-formed graphene to cool. The precursor was weighed after graphene growth to determine the quantity of orange oil consumed in the growth stage.
To confirm the lower temperature growth of graphene, standard silicon-oxide and quartz wafers were used across a range of temperatures. For comparison to standard temperatures used for catalyst free graphene production, 800 °C was first trialed. The temperature was then lowered to 600, 500 and 400 °C to grow the film on soda-lime glass.
2.3 Characterization
Graphene samples were characterised using Raman spectroscopy, scanning electron microscopy (SEM) and X-ray photoelectron spectroscopy (XPS). A WITec alpha300 Raman imaging microscope with a 532 nm excitation laser was used for the Raman study. Peak fitting performed using CasaXPS. SEM images were taken with a Hitachi SU 5000 to confirm the presence of vertically aligned graphene. In order to determine the chemical makeup and purity of the fabricated films, XPS analysis was performed using a Physical Electronics Model 5700 XPS instrument with monochromatic Al-Kα X-ray source and pass energy of 11.75 eV.2.4 Sensor manufacturing and testing
Graphene humidity sensors were created using a Wheatstone bridge where one arm of the bridge contained the sustainable grown graphene. Electrodes were attached directly to the graphene grown on glass substrates, along the short edges, using silver varnish. This gave a sensing area of approximately 5 mm × 5 mm. The bridge voltage was amplified by a Texas Instruments INA826 precision instrumentation amplifier and the amplified signal was then read using an Atmel ATmega2560 microcontroller. The graphene sensor was then compared to a Sensirion SHT-10 temperature and humidity sensor. The two sensors were placed in a small test chamber with two entry ports and one exhaust port. Another larger chamber housed a humidifier filled with demineralized water and a blower that fed moist air into one of entry ports. Another blower was connected to the second entry port and provided ambient air at a lower humidity. To ensure synchronization in reading both sensors as well as the state of the blowers were monitored by the same microcontroller. The temperature inside the test chamber was monitored to verify consistency in temperature between the humid and dry air. The sensors were exposed to a 30 seconds period of high humidity followed by low humidity for the same duration. This was repeated continuously for 10 minutes to ensure repeatability of the sensor.3 Results and discussion
3.1 Raman spectroscopy
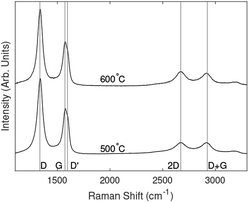
Normalised Raman spectra for each substrate and temperature are shown in Fig. 2. All samples grown above 400 °C showed strong D and G peaks with a notable D′ peak as well as 2D, D + G and 2D′ peaks. The presence of these peaks is consistent with the formation of vertically aligned graphene. The first-order G peak at 1576 cm−1 is an indication of graphitic carbon, while the presence of the 2D peak at 2671 cm−1 indicates the formation of graphene. A strong D peak at 1340 cm−1 suggests the formation of considerable edges and defects associated with vertically aligned graphene. A strong D′ peak at 1606 cm−1 also indicates defects or surface contamination.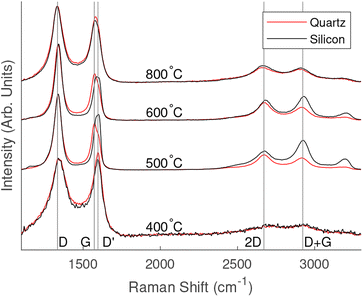 | ||
| Fig. 2 Comparison of Raman spectra for different PECVD growth temperatures and substrates. Lines have been shifted vertically for clarity. | ||
Raman spectra of the 400 °C grown samples showed weaker peaks than those fabricated at higher temperatures. The peaks related to silicon oxide were observed on the samples grown on silicon substrates. D and G peaks were present; however, there was no pronounced 2D peak. The spectra appeared to be arising from thin layer of amorphous carbon containing graphitic carbon.
The Raman spectra showed similar results for samples grown on both quartz and silicon oxide when grown at the same temperature. Table 1 shows a comparison of the average 2D peaks across the range of temperatures and substrates. The values in the low to mid 100 cm−1 range indicate the formation of graphene with a few layers. For the 800 °C and 600 °C samples the silicon substrate recorded a slightly higher full width half maximum (FWHM) and for the 500 °C the quartz substrate showed a slightly higher FWHM; however, the values are close across all samples grown under the same conditions suggesting that substrates did not effect the formation of vertically aligned graphene.
| Temperature (°C) | Substrate | 2D position (cm−1) | 2D FWHM (cm−1) |
|---|---|---|---|
| 800 | Silicon | 2673 | 154 |
| Quartz | 2673 | 151 | |
| 600 | Silicon | 2669 | 110 |
| Quartz | 2672 | 93 | |
| 500 | Silicon | 2667 | 102 |
| Quartz | 2672 | 108 | |
| 400 | Silicon | 2711 | — |
| Quartz | 2717 | — |
Comparing the spectra of all samples, the 600 °C samples showed a sharper 2D peak indicating fewer layers of graphene, however the strong D′ peak indicates that this is at the expense of graphene quality. The Raman spectra for 500 °C indicted a larger number of graphene layers but with fewer surface impurities.
Vertically aligned graphene was not formed at 400 °C, suggesting that a catalyst might be required to successfully reduce the temperature to or below this point under similar growth conditions used in this methodology. However, the similarities between samples grown at higher temperatures on different substrates suggest that the substrate does not significantly influence the graphene growth. It is therefore likely that non-catalytic materials including soda-lime, sodium chloride would make suitable low cost substrates.
3.2 SEM
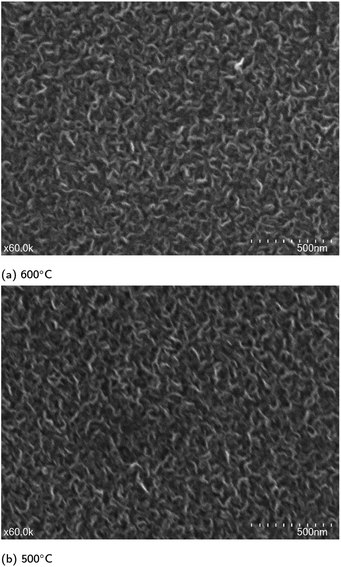
SEM images for graphene grown at 800 °C and 500 °C are shown in Fig. 3 with additional images in Fig. S1.† From these images it was clear that vertically aligned graphene was formed with significant well defined edges. The higher resolution images show that the graphene walls are substantial confirming of the presence of vertically aligned graphene with a few layers. The samples on quartz substrates show thinner walls and therefore fewer layers and higher quality compared to those on silicon substrates. The samples grown at 800 °C and 600 °C show very little impurities on the surface whereas the 500 °C samples do show some impurities. These results are consistent with the observed Raman spectra. While there were differences between the graphene grown on different substrates, the samples were similar enough to suggest that VG growth should occur on other non-catalytic substrates under the selected growth conditions.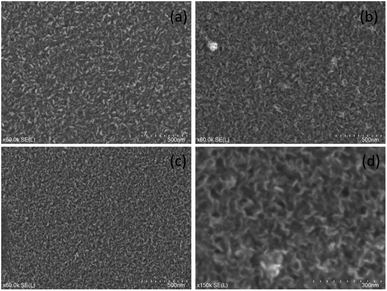 | ||
| Fig. 3 SEM images of various samples grown at (a) 800 °C on silicon (b) 800 °C on quartz (c) and (d) 500 °C on quartz. | ||
3.3 XPS
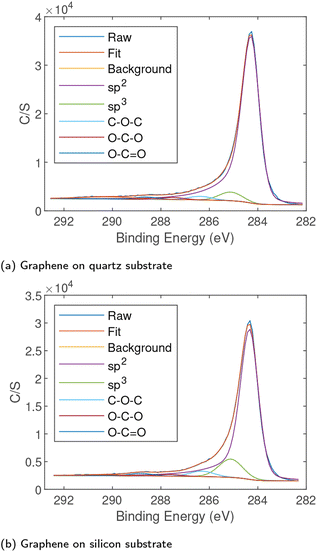
High-resolution XPS scans were performed on the carbon (C1s) peak arising from samples to determine the chemical state. The XPS data were fitted with an asymmetric peak for sp2 carbon and symmetric peaks for sp3 carbon and various carbon–oxygen bonds as shown in Fig. 4. The XPS confirmed that while some sp3 carbon and a small amount of oxygen were present, the vast majority was sp2 indicating high quality graphene. The peak locations and approximate concentrations are given in Table 2. The scans show a high percentage of sp2 bonds with a small percentage of sp3 bonds, notably the silicon substrate does appear to have a higher quantity of sp3 carbon. This is consistent with the Raman spectra where the silicon samples showed a stronger D′ peak. In both samples there were only very small quantities of oxygen present indicating high quality graphene production on both substrates. The C1s peak arising from graphene on soda-lime glass shown in Fig. S2(a)† was nearly identical to that emerging from graphene on quartz. The survey spectrum of film on glass is provided in Fig. S2(b)† and showed no elements other than carbon and a small amount of oxygen, originating primarily from the substrate.| Substrate | sp2 (284.3 eV) | sp3 (285.1 eV) | C–O–C/C–OH (286.3 eV) | O–CO (287.7 eV) | O–C![[double bond, length as m-dash]](https://www.rsc.org/images/entities/char_e001.gif) O (288.8 eV) O (288.8 eV) |
|---|---|---|---|---|---|
| Silicon | 83% | 12% | 3% | 1% | 1% |
| Quartz | 90% | 6% | 2% | 1% | 1% |
3.4 Glass substrates
Since our results confirmed that vertically aligned graphene could be grown on different substrates without significant difference in quality at lower temperatures, we grew graphene on soda-lime glass under identical conditions. The SEM images of the samples grown on these low cost substrates are shown in Fig. 5. As with the previous samples it is clear that vertically aligned graphene was formed. Both samples show an abundance of edges across the entire scan area. Unlike the previous 500 °C samples impurities were not seen on the vertically aligned graphene on glass. The Raman spectra for the samples grown on glass is shown in Fig. 6. The observed spectra were similar to those for the samples grown on silicon and quartz substrates with the presence for D, G, D′, 2D and D + G peaks consistent with the formation of VG. The FWHM for the 2D peak for grown at 600 °C and 500 °C were 98 cm−1 and 105 cm−1 respectively. This suggests the presence of few-layer graphene with less layers in the 600 °C sample. The D′ peak is more significant in the samples grown on the glass substrates. These results confirm that vertically aligned graphene can be grown on soda-lime glass substrates.3.5 Humidity sensing
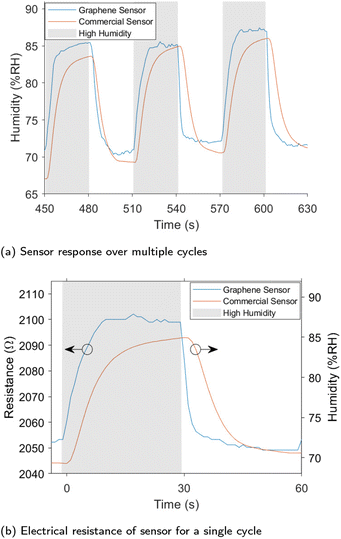
We fabricated a humidity sensor from VG grown on the glass and silicon substrates. The humidity sensor was shown to readily detect changes in humidity. Fig. 7 shows the humidity recorded by the commercial SHT-10 sensor as well as the electrical resistance of the sensor produced in this work samples grown at 500 °C. Recordings of both measurements over a 10 minute window are shown in Fig. S3† along with sensors produced at 600 °C in Fig. S5† on glass and 500 °C on silicon in Fig. S4.† For all sensors, an increase in humidity resulted in a rapid increase in resistance, while a reduction in humidity decreased the resistance. The response and recovery times were considerably faster than the commercial sensor, making the graphene humidity sensor more suitable for applications where rapid changes in humidity are present such as respiratory rate sensing.19,59 The silicon sensor recorded a lower resistance and sensitivity than the glass substrates. Throughout the testing, changes in the ambient temperature were observed; plots of these effects are shown in Fig. S6.† While temperature does affect the sensor's resistance, areas of high and low humidity can be easily distinguished. Compensation of this effect was implemented by obtaining true measurements of relative humidity. As outlined in the ESI† a number of machine learning models were trialed to predict relative humidity using sensor resistance as well as temperature. Linear regression was chosen over other models as it fit the data well and is easily interpreted. The plane used for the humidity prediction is shown in Fig. S7† with the data points used in its construction with a subset if the predicted results shown in Fig. 7. There is a strong correlation between the calculated humidity and the humidity measured by the SHT-10 sensor. The plane generated by linear regression showed a humidity sensitivity of 3.41 Ω per % RH and a temperature sensitivity of −0.22 Ω per °C.The average response time recorded for the graphene sensor grown at 500 °C was 8.8 seconds with a recovery time of just 4.3 seconds, compared to the commercial sensor with a rise-time of 11.3 seconds and recovery time of 12.5 s. These times were calculated as the time taken to reach 90% of the final value from the change in stimulus. This is significantly faster than other sensors utilising vertically aligned graphene. Response and recovery times of 16 seconds and 21 seconds respectively to a 10% change in humidity were recorded in a previous work.23 In another work,24 a response time of 11 seconds and a recovery time of 19 seconds to a 30% change in humidity. The graphene sensor was able to respond much faster to changes in humidity compared to the commercial sensors and other VG sensors in the literature, additionally it can be used to accurately measure humidity with straightforward compensation for temperature.
4 Conclusions
In summary, this work demonstrated a method for growing vertically aligned graphene production orange oil as a renewable precursor, without the need for carrier gasses or catalyst loaded substrates. VG was successfully grown on soda-lime glass at temperatures as low as 500 °C. Raman spectroscopy showed that graphene could not be formed when the temperature was reduced to 400 °C. This work shows that lower-temperature growth is feasible with renewable precursors, and that graphene growth is largely independent of substrate type, allowing growth on low-cost and more sustainable soda-lime glass. The sustainable graphene showed promise as a high response rate humidity sensor capable of detecting rapid changes in humidity as well as determining relative humidity in under ambient conditions. These findings taken together indicate that similar quality VG could be grown on cheaper and more sustainable substrates. Overall, this work has opened a carbon utilisation pathway for a sustainable future.Author contributions
LP: investigation, methodology, formal analysis, software, writing – original draft. MJ: conceptualisation, supervision, writing – review and editing. BP: conceptualisation, supervision, writing – review and editing. BM: investigation, formal analysis, writing – review and editing. OV: investigation, formal analysis, writing – review and editing.Conflicts of interest
There are no conflicts to declare.Acknowledgements
We thank Dr Stephanie Baker for useful discussion and comments on this manuscript. We also thank Dr Michael S. A. Kamel for their laboratory assistance. This work was supported by the Australian Government Research Training Program Scholarship.References
- A. Rasyotra, A. Thakur, B. Gaykwad, S. Chakrabarty, I. Bayad, J. Parikh and K. Jasuja, J. Mater. Sci., 2023, 58, 4359–4383 CrossRef CAS
.
- X. Zhao, E. Jiaqiang, G. Wu, Y. Deng, D. Han, B. Zhang and Z. Zhang, Energy Convers. Manage., 2019, 184, 581–599 CrossRef CAS
.
- S. Sollami Delekta, A. D. Smith, J. Li and M. Östling, Nanoscale, 2017, 9, 6998–7005 RSC
.
- Z. Ma, Y. Duan, Y. Deng, H. Quan, X. Yang, H. Li, L. Ye, B. Xu and L. Yan, RSC Sustainability, 2023, 1, 1006–1015 RSC
.
- X. Wang, D. Zhang, H. Jin, B. Z. Poliquit, B. Philippa, R. C. R. Nagiri, J. Subbiah, D. J. Jones, W. Ren, J. Du, P. L. Burn and J. Yu, Sol. RRL, 2019, 3, 1900042 CrossRef
.
- N. P. D. Ngidi, E. Muchuweni and V. O. Nyamori, RSC Adv., 2022, 12, 2462–2472 RSC
.
- E. Muchuweni, B. S. Martincigh and V. O. Nyamori, RSC Adv., 2020, 10, 44453–44469 RSC
.
- F. Xiong, J. Sun, M. T. Cole, W. Guo, C. Yan, Y. Dong, L. Wang, Z. Du, S. Feng, X. Li, T. Guo and Q. Yan, J. Mater. Chem. C, 2022, 10, 6794–6804 RSC
.
- L. Zhu, X. Guo, Y. Chen, Z. Chen, Y. Lan, Y. Hong and W. Lan, ACS Appl. Nano Mater., 2022, 5, 3643–3653 CrossRef CAS
.
- Y. Ding, K.-W. Cao, J.-W. He, F.-M. Li, H. Huang, P. Chen and Y. Chen, Chin. J. Catal., 2022, 43, 1535–1543 CrossRef CAS
.
- X. Cao, K. Zhang, G. Feng, Q. Wang, P. Fu and F. Li, Micromachines, 2022, 13, 681 CrossRef PubMed
.
- A. Beniwal, P. Ganguly, A. K. Aliyana, G. Khandelwal and R. Dahiya, Sens. Actuators, B, 2023, 374, 132731 CrossRef CAS
.
- A. D. Smith, K. Elgammal, X. Fan, M. C. Lemme, A. Delin, M. Råsander, L. Bergqvist, S. Schröder, A. C. Fischer, F. Niklaus and M. Östling, RSC Adv., 2017, 7, 22329–22339 RSC
.
- A. D. Smith, K. Elgammal, F. Niklaus, A. Delin, A. C. Fischer, S. Vaziri, F. Forsberg, M. Råsander, H. Hugosson, L. Bergqvist, S. Schröder, S. Kataria, M. Östling and M. C. Lemme, Nanoscale, 2015, 7, 19099–19109 RSC
.
- M. Machado, A. M. L. Oliveira, G. A. Silva, D. B. Bitoque, J. Tavares Ferreira, L. A. Pinto and Q. Ferreira, Nanomaterials, 2022, 12, 1624 CrossRef CAS PubMed
.
- T. A. Saleh, K. Haruna and A.-R. I. Mohammed, J. Mol. Liq., 2021, 325, 115060 CrossRef CAS
.
- Y. R. Mukhortova, A. S. Pryadko, R. V. Chernozem, I. O. Pariy, E. A. Akoulina, I. V. Demianova, I. I. Zharkova, Y. F. Ivanov, D. V. Wagner, A. P. Bonartsev, R. A. Surmenev and M. A. Surmeneva, Nano-Struct. Nano-Objects, 2022, 29, 100843 CrossRef CAS
.
- X. Gong, L. Zhang, Y. Huang, S. Wang, G. Pan and L. Li, RSC Adv., 2020, 10, 22222–22229 RSC
.
- G. Wang, Y. Zhang, H. Yang, W. Wang, Y.-Z. Dai, L.-G. Niu, C. Lv, H. Xia and T. Liu, RSC Adv., 2020, 10, 8910–8916 RSC
.
- R. Tamilselvi, M. Ramesh, G. S. Lekshmi, O. Bazaka, I. Levchenko, K. Bazaka and M. Mandhakini, Renewable Energy, 2020, 151, 731–739 CrossRef CAS
.
- K. K. Yadav, R. Wadhwa, N. Khan and M. Jha, Curr. Res. Green Sustainable Chem., 2021, 4, 100075 CrossRef CAS
.
- S. Sahoo, G. Sahoo, S. M. Jeong and C. S. Rout, J. Energy Storage, 2022, 53, 105212 CrossRef
.
- H. Wang, M. Zhao, W. Zhu, Z. Liu, G. Wang, S. Tang, D. Chen, J.-M. Lee, S. Yang and G. Ding, Mater. Lett., 2020, 277, 128343 CrossRef CAS
.
- H. Fang, D. Yao, X. Gao, Y. Sun, A. Shiwei, M. Lu and C. Lu, Sens. Actuators, A, 2023, 352, 114213 CrossRef CAS
.
- L. Wang, W. Zhang, S. Samavat, D. Deganello and K. S. Teng, ACS Appl. Mater. Interfaces, 2020, 12, 35328–35336 CrossRef CAS PubMed
.
- P. K. Roy, G. Haider, T.-C. Chou, K.-H. Chen, L.-C. Chen, Y.-F. Chen and C.-T. Liang, ACS Sens., 2019, 4, 406–412 CrossRef CAS PubMed
.
- M. Titirici, S. G. Baird, T. D. Sparks, S. M. Yang, A. Brandt-Talbot, O. Hosseinaei, D. P. Harper, R. M. Parker, S. Vignolini, L. A. Berglund, Y. Li, H.-L. Gao, L.-B. Mao, S.-H. Yu, N. Díez, G. A. Ferrero, M. Sevilla, P. Ágota Szilágyi, C. J. Stubbs, J. C. Worch, Y. Huang, C. K. Luscombe, K.-Y. Lee, H. Luo, M. J. Platts, D. Tiwari, D. Kovalevskiy, D. J. Fermin, H. Au, H. Alptekin, M. Crespo-Ribadeneyra, V. P. Ting, T.-P. Fellinger, J. Barrio, O. Westhead, C. Roy, I. E. L. Stephens, S. A. Nicolae, S. C. Sarma, R. P. Oates, C.-G. Wang, Z. Li, X. J. Loh, R. J. Myers, N. Heeren, A. Grégoire, C. Périssé, X. Zhao, Y. Vodovotz, B. Earley, G. Finnveden, A. Björklund, G. D. J. Harper, A. Walton and P. A. Anderson, J. Phys.: Mater., 2022, 5, 032001 Search PubMed
.
- M. Cossutta, V. Vretenar, T. A. Centeno, P. Kotrusz, J. McKechnie and S. J. Pickering, J. Cleaner Prod., 2020, 242, 118468 CrossRef CAS
.
- Y. Yan, Y. Meng, H. Zhao, E. Lester, T. Wu and C. H. Pang, Bioresour. Technol., 2021, 331, 124934 CrossRef CAS PubMed
.
- M. Bahri, S. H. Gebre, M. A. Elaguech, F. T. Dajan, M. G. Sendeku, C. Tlili and D. Wang, Coord. Chem. Rev., 2023, 475, 214910 CrossRef CAS
.
- J. bin Wang, Z. Ren, Y. Hou, X. li Yan, P. zhi Liu, H. Zhang, H. xia Zhang and J. jie Guo, New Carbon Mater., 2020, 35, 193–208 CrossRef
.
- W. Fu, X. Zhao and W. Zheng, Carbon, 2021, 173, 91–96 CrossRef CAS
.
- Z. Wang, Y. Li, J. Liu, G. Tian, G. Liu, M. Wang, H. Ogata, W. Gong, A. K. Vipin, G. J. H. Melvin, J. Ortiz-Medina, S. Morimoto, Y. Hashimoto, M. Terrones and M. Endo, Carbon, 2021, 172, 26–30 CrossRef CAS
.
- S. H. Vijapur, D. Wang and G. G. Botte, ECS Solid State Lett., 2013, 2, M45 CrossRef CAS
.
- S. Xu, S. Wang, Z. Chen, Y. Sun, Z. Gao, H. Zhang and J. Zhang, Adv. Funct. Mater., 2020, 30, 2003302 CrossRef CAS
.
- J.-Z. Huang, I.-C. Ni, Y.-H. Hsu, S.-W. Li, Y.-C. Chan, S.-Y. Yang, M.-H. Lee, S.-L. Shue, M.-H. Chen and C.-I. Wu, Nano Express, 2022, 3, 015003 CrossRef
.
- D. H. Seo, Z. J. Han, S. Kumar and K. K. Ostrikov, Adv. Energy Mater., 2013, 3, 1316–1323 CrossRef CAS
.
- D. Seo, A. Rider, S. Kumar, L. Randeniya and K. Ostrikov, Carbon, 2013, 60, 221–228 CrossRef CAS
.
- D. H. Seo, S. Pineda, J. Fang, Y. Gozukara, S. Yick, A. Bendavid, S. K. H. Lam, A. T. Murdock, A. B. Murphy, Z. J. Han and K. K. Ostrikov, Nat. Commun., 2017, 8, 14217 CrossRef CAS PubMed
.
- P. A. Advincula, D. X. Luong, W. Chen, S. Raghuraman, R. Shahsavari and J. M. Tour, Carbon, 2021, 178, 649–656 CrossRef CAS
.
- M. Z. Nurfazianawatie, H. Omar, N. F. Rosman, N. S. A. Malek, A. N. Afaah, I. Buniyamin, M. J. Salifairus, M. F. Malek, M. M. Mahat, M. Rusop and N. A. Asli, Mater. Today: Proc., 2023, 75, 127–132 CAS
.
- A. K. M. A. Iqbal, N. Sakib, A. K. M. P. Iqbal and D. M. Nuruzzaman, Materialia, 2020, 12, 100815 CrossRef CAS
.
- S. Alancherry, K. Bazaka, I. Levchenko, A. Al-jumaili, B. Kandel, A. Alex, F. C. Robles Hernandez, O. K. Varghese and M. V. Jacob, ACS Appl. Mater. Interfaces, 2020, 12, 29594–29604 CrossRef CAS PubMed
.
- A. Al-Jumaili, M. A. Zafar, K. Bazaka, J. Weerasinghe and M. V. Jacob, Carbon Trends, 2022, 7, 100157 CrossRef CAS
.
- M. Gavahian, Y.-H. Chu and A. Mousavi Khaneghah, Int. J. Food Sci. Technol., 2019, 54, 925–932 CrossRef CAS
.
- Auroma, 2021 Price Guide, 2021.
- R. Muñoz and C. Gómez-Aleixandre, Chem. Vap. Deposition, 2013, 19, 297–322 CrossRef
.
- X. Li, C. W. Magnuson, A. Venugopal, J. An, J. W. Suk, B. Han, M. Borysiak, W. Cai, A. Velamakanni, Y. Zhu, L. Fu, E. M. Vogel, E. Voelkl, L. Colombo and R. S. Ruoff, Nano Lett., 2010, 10, 4328–4334 CrossRef CAS PubMed
.
- L. Gao, W. Ren, H. Xu, L. Jin, Z. Wang, T. Ma, L.-P. Ma, Z. Zhang, Q. Fu, L.-M. Peng, X. Bao and H.-M. Cheng, Nat. Commun., 2012, 3, 699 CrossRef PubMed
.
- P. R. Somani, S. P. Somani and M. Umeno, Chem. Phys. Lett., 2006, 430, 56–59 CrossRef CAS
.
- R. Muñoz and C. Gómez-Aleixandre, Chem. Vap. Deposition, 2013, 19, 297–322 CrossRef
.
- Z. Ullah, S. Riaz, Q. Li, S. Atiq, M. Saleem, M. Azhar, S. Naseem and L. Liu, Mater. Res. Express, 2018, 5, 035606 CrossRef
.
- J. K. Saha and A. Dutta, Waste Biomass Valorization, 2022, 13, 1385–1429 CrossRef PubMed
.
- S. Hussain, E. Kovacevic, J. Berndt, N. M. Santhosh, C. Pattyn, A. Dias, T. Strunskus, M.-R. Ammar, A. Jagodar, M. Gaillard, C. Boulmer-Leborgne and U. Cvelbar, Nanotechnology, 2020, 31, 395604 CrossRef CAS PubMed
.
- N. A. binti Anuar, N. H. M. Nor, R. binti Awang, H. Nakajima, S. Tunmee, M. Tripathi, A. Dalton and B. T. Goh, Surf. Coat. Technol., 2021, 411, 126995 CrossRef
.
- Y. Ma, H. Jang, S. Kim, C. Pang and H. Chae, Nanoscale Res. Lett., 2015, 10, 308 CrossRef PubMed
.
- C. Graham, M. M. M. Frances, R. A. Maniyara, Y. Wen, P. Mazumder and V. Pruneri, Sci. Rep., 2020, 10, 7253 CrossRef CAS PubMed
.
- Australian Botanical Products Ltd, Safety Data Sheet Orange Oil Navel Cold Pressed Australian, 2019.
- S. Kano, N. Jarulertwathana, S. Mohd-Noor, J. K. Hyun, R. Asahara and H. Mekaru, Sensors, 2022, 22, 1251 CrossRef PubMed
.
Footnote |
| † Electronic supplementary information (ESI) available. See DOI: https://doi.org/10.1039/d3su00417a |
| This journal is © The Royal Society of Chemistry 2024 |

