 Open Access Article
Creative Commons Attribution 3.0 Unported Licence
Synthesis of a high dielectric constant graphene supported iron oxide and its electrocatalytic activity in a H2O2 fuel cell and as an efficient photocatalyst
Madhavi D.
Shete
 * and
J. B.
Fernandes
Department of Chemistry, Goa University, Taleigao, Goa 403206, India. E-mail: smadhavi91@gmail.com
First published on 15th April 2024
Abstract
The present work focuses on the study of the dielectric properties of iron oxide and graphene supported iron oxide and their relation towards electrocatalytic activity. Graphene supported iron oxide was synthesized and characterized by X-ray diffraction (XRD), infrared spectroscopy (IR), Raman spectroscopy, scanning electron microscopy (SEM), transmission electron microscopy, UV-Vis spectroscopy, LCR meter. The synthesized composite has a small particle size of 32.3 nm and a high surface area of 8.10 m2 g−1. Graphene supported iron oxide also showed a enhanced dielectric constant of 10.4 and an ac conductivity of 4.78 × 10⁻⁷ S cm−1 at 1 MHz. The composite was also studied for its electrocatalytic activity in a H2O2 fuel cell. The H2O2 fuel cell performance of iron oxide was high in the presence of graphene with a power density of 0.03 mW cm−2 and current density of 0.5 mA cm−2. A further improvement in the H2O2 fuel cell performance was obtained using hydrazine sulfate with a power density of 2.6 mW cm−2 and current density of 7.8 mA cm−2. Synthesized iron oxide/graphene also showed enhanced photocatalytic activity towards methylene blue dye degradation and good cycling stability.
Sustainability spotlightIn the present work, we report for the first time, the synthesis of graphene supported iron oxide and its application in the fuel cell and photocatalysis study. Herein, we report advanced oxidation process for the electrolytic oxygen evolution in the fuel cell study, such as in the H2O2 fuel cell. Another approach is to correlate newly study of the electrical properties and surface properties of the graphene supported iron oxide with that of its application. |
1. Introduction
Graphene based conductive materials have been widely investigated in photovoltaic, supercapacitors, gas sensors, and solar cells because of its low cost, low processibility of an exfoliation method, large surface area and interesting electrical properties. Other than this, graphene shows excellent thermal conductivity, mechanical properties and a flexible porous structure, and therefore one can choose it as a support material to gain a high activity or to improve the performance of a material.A reduced graphene oxide/maghemite composite was found to be reported for lithium ion batteries.1 Out of all the metal oxides, iron oxide is abundant, low cost and nontoxic with a high theoretical capacity of 1007 mA h g−1. Therefore, it attracted attention in battery applications. One can overcome the obstacle of flexibility and conductivity by combining both Fe2O3 and graphene. Fe2O3/polypyrrole/graphene oxide composites show a high activity for the oxygen reduction reaction in an alkaline electrolyte.2 Among all these, hematite is considered to be of prime importance in terms of its application in the areas of catalysis, photocatalysis, electrochemistry and biomedicines.3–7 Hematite is studied for its photocatalytic activity in the visible region due to its band gap of 2.1 eV and it is also considered to be an excellent candidate for the water splitting process.8,9 In the case of microbial fuel cells (MFC) different electron acceptors are being studied wherein they receive electrons from the cathode and therefore make a significant contribution to performance of the MFC. Ferric ions can be reduced to ferrous ions in the cathode chamber and gives faster reactions, higher standard potentials, biological degradability and the release of compounds such as phosphate in the MFC.10 The use of iron oxide as the electrocatalyst in fuel cells is rarely reported, likely because of the negligible activity of crystallized iron oxide on an oxygen reduction reaction (ORR).11 Metal nanoparticles (MNPs) allow electron transfer between redox systems and bulk-electrode materials based on their unique properties. MNPs have also established useful interfaces for the electrocatalysis of the redox processes of molecules (e.g., H2O2, O2 or NADH) involved in many significant biochemical reactions. Iron oxides can act as better electrocatalysts since they are well known for their electrochemical biosensing properties12
A fuel cell produces electricity by converting the fuel electrochemically. The performance of the fuel cell depends on the fuel used, oxidant and electrode material. A good electrocatalytic surface produces a faster electron transfer to the anode from electrochemical oxidation of the fuel, or reduces the anions at the cathode, delivering a high output current from the cell. First, the H2O2 fuel cell was introduced by using a Au plate as the anode and a Ag plate as the cathode and 0.2 V was obtained as the open circuit potential (OCP).13 Later, an iron phthalocyanine complex was used as the cathode and a Ni mesh as the anode, and the OCP obtained was 0.55 V.14 Ag as the anode and Prussian blue as the cathode gave an OCP of 0.53 V.15 Pt, Pd, Ni, or Au wire as the anode and Ag wire as cathode gave an OCP of 0.13 V.15 Fe3[Co(CN)6]2 as the anode and Ni mesh as cathode gave a 0.8 V OCP.16 Al as the anode and Prussian blue as the cathode gave an OCP of 0.58 V.17
S. Shinde et al.18 have also studied the effect of the physical properties of hematite thin films on photochemical solar cells. In the present investigation, the synthesis of graphene supported iron oxide was carried out. Synthesized iron oxide/graphene was further studied for its electrical properties and activity towards a H2O2 fuel cell and the photocatalytic degradation of methylene blue (MB) dye. The synthesized composite was found to have a high dielectric constant with an enhanced anodic property towards H2O2 fuel cells. Photocatalysis was carried out as additional studies since graphene supported materials are well known as photocatalysts and iron oxide as a visible light absorbing metal oxide materials.
2. Synthesis and characterization
2.1 Synthesis of α-Fe2O3/graphene
All the chemicals used were of analytical grade. Ferric nitrate, oxalic acid and urea were mixed together such that the respective ratio of ferric nitrate![[thin space (1/6-em)]](https://www.rsc.org/images/entities/char_2009.gif) :
:![[thin space (1/6-em)]](https://www.rsc.org/images/entities/char_2009.gif) urea
urea![[thin space (1/6-em)]](https://www.rsc.org/images/entities/char_2009.gif) :
:![[thin space (1/6-em)]](https://www.rsc.org/images/entities/char_2009.gif) oxalic acid is 1
oxalic acid is 1![[thin space (1/6-em)]](https://www.rsc.org/images/entities/char_2009.gif) :
:![[thin space (1/6-em)]](https://www.rsc.org/images/entities/char_2009.gif) 2
2![[thin space (1/6-em)]](https://www.rsc.org/images/entities/char_2009.gif) :
:![[thin space (1/6-em)]](https://www.rsc.org/images/entities/char_2009.gif) 1. The mixture was preheated uniformly up to 60 °C, thus forming a dry yellowish green color residue. Subsequently the entire dry residue was heated in a furnace at 400 °C for 2 h to obtain the final samples. The samples, in general, were designated as F-xyz where xyz is the molar ratio of ferric nitrate, urea and oxalic acid. The material was designated as F.
1. The mixture was preheated uniformly up to 60 °C, thus forming a dry yellowish green color residue. Subsequently the entire dry residue was heated in a furnace at 400 °C for 2 h to obtain the final samples. The samples, in general, were designated as F-xyz where xyz is the molar ratio of ferric nitrate, urea and oxalic acid. The material was designated as F.
Synthesis of α-Fe2O3/graphene was carried out by dispersing 15 mg of GO in 20 ml of distilled water and stirring for 1 h. To the dispersion of GO, 600 mg of F was added and the mixture was stirred for 2 h. The resulting mixture was later dried in oven at 60 °C and calcined at 200 °C for 2 h to get the final 2.5% graphene supported F-121 material, with the given code FG.
2.2 Characterization
Phase identification was carried out from the X-ray powder diffraction patterns (XRD) recorded on a Rigaku Ultima IV diffractometer, using Ni filtered CuKα radiation (λ = 1.5406 Å). The crystallite sizes were determined using the Scherrer formula t = 0.9λ/β![[thin space (1/6-em)]](https://www.rsc.org/images/entities/char_2009.gif) cos
cos![[thin space (1/6-em)]](https://www.rsc.org/images/entities/char_2009.gif) θ, where λ is the wavelength characteristic of the CuKα radiation, β is the full width at half maximum (in radians) and θ is the angle at which the 100 intensity peak appears. The IR spectrum was recorded in the 4000–400 cm−1 range on a Shimadzu IR Prestige-21 by diluting a few milligrams of the sample in KBr. SEM images were recorded on a Carl Zeiss electron microscope model no. EV 018 equipped with a carbon nitride detector. TEM analyses were carried out for the synthesized catalyst on a Phillips CM 200 with operating voltages of 20–200 kV and resolution of 2.4 Å. The absorption edges and band gap energies were determined using a UV-VIS spectrophotometer (Shimadzu UV-2450). Raman spectra of the solid samples were recorded using 785 nm radiation for excitation on an Agilton peak seeker pro Raman instrument. The BET surface area was determined by a multipoint BET method and the BJH pore size distribution analysis was on a Micromeritics instrument 2020 V 3.00 H. Electrical properties of the synthesized composites were studied by using a high frequency LCR meter 6500p series. The magnetic properties were measured on a Quantachrome Versa Lab vibrating sample magnetometer (VSM) at 300 K.
θ, where λ is the wavelength characteristic of the CuKα radiation, β is the full width at half maximum (in radians) and θ is the angle at which the 100 intensity peak appears. The IR spectrum was recorded in the 4000–400 cm−1 range on a Shimadzu IR Prestige-21 by diluting a few milligrams of the sample in KBr. SEM images were recorded on a Carl Zeiss electron microscope model no. EV 018 equipped with a carbon nitride detector. TEM analyses were carried out for the synthesized catalyst on a Phillips CM 200 with operating voltages of 20–200 kV and resolution of 2.4 Å. The absorption edges and band gap energies were determined using a UV-VIS spectrophotometer (Shimadzu UV-2450). Raman spectra of the solid samples were recorded using 785 nm radiation for excitation on an Agilton peak seeker pro Raman instrument. The BET surface area was determined by a multipoint BET method and the BJH pore size distribution analysis was on a Micromeritics instrument 2020 V 3.00 H. Electrical properties of the synthesized composites were studied by using a high frequency LCR meter 6500p series. The magnetic properties were measured on a Quantachrome Versa Lab vibrating sample magnetometer (VSM) at 300 K.
2.3 Catalytic tests
![[thin space (1/6-em)]](https://www.rsc.org/images/entities/char_2009.gif) :
:![[thin space (1/6-em)]](https://www.rsc.org/images/entities/char_2009.gif) 1 (v/v) mixture of 1 M H2O2 + 1 M NaCl at pH = 1. pH was adjusted by using a HCl and NaOH solution. Tafel polarization measurements were carried out by using Pt wire as the counter electrode, Ag/Ag+ as a reference electrode and the catalyst coated on GCE as working electrode.
1 (v/v) mixture of 1 M H2O2 + 1 M NaCl at pH = 1. pH was adjusted by using a HCl and NaOH solution. Tafel polarization measurements were carried out by using Pt wire as the counter electrode, Ag/Ag+ as a reference electrode and the catalyst coated on GCE as working electrode.
3. Results and discussion
3.1 Surface properties
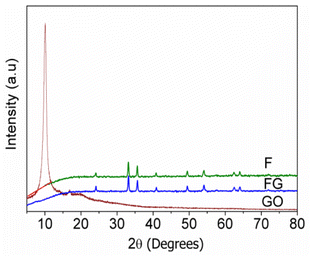
Fig. 1 gives XRD pattern of the synthesized graphene supported iron oxide (FG), where no peak corresponding to the GO at 10 °C is seen in case of FG. Crystallite sizes were calculated for F and FG and are given in Table 1. When graphene was used as the support material to synthesize iron oxide, its crystallite size decreased from 37 to 32.3 nm. Similar results were also reported by Meng et al.19 The decrease in the size of FG is due to the porous nature of graphene and a strong interaction between α-Fe2O3 and graphene, which prevents expansion of α-Fe2O3 particles. Lattice parameters were calculated from the XRD pattern and their respective values are given in Table 1. An increase in lattice parameter ‘a’ was observed, whereas lattice parameter ‘c’ decreases in FG, which indicates structural changes occur in F in the presence of graphene.| Catalyst code | Crystallite size (nm) | Lattice parameters | Band gap (eV) | Surface area (m2 g−1) | Pore volume (cc g−1) | Pore radius (Å) | |
|---|---|---|---|---|---|---|---|
| a = b | c | ||||||
| F | 37.0 | 5.036 | 13.780 | 1.83 | 7.77 | 0.033 | 62.28 |
| FG | 32.3 | 5.083 | 13.703 | 1.81 | 8.10 | 0.031 | 67.21 |
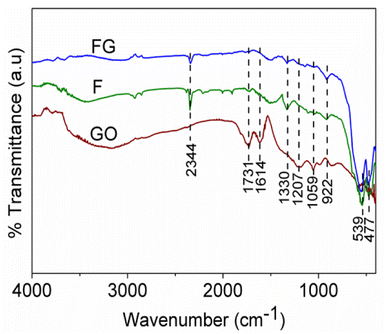
IR spectra of the GO, FG and F are shown in Fig. 2. The characteristic absorption in the range of 400–1000 cm−1 is due to Fe–O bond vibrations, the absorptions at 1731 cm−1, 1614 cm−1, 1207 cm−1 and 1059 cm−1 correspond to C![[double bond, length as m-dash]](https://www.rsc.org/images/entities/char_e001.gif) O, C
O, C![[double bond, length as m-dash]](https://www.rsc.org/images/entities/char_e001.gif) C, and C–O bonds in GO, while peaks in the range of 3432 cm−1 and 1330 cm−1 are due to the presence of hydroxyl groups.20,21 The absorptions at 1207 cm−1 and 1059 cm−1, which correspond to C–O bond vibrations, are absent in the FG sample. This is due to the reduction of GO to graphene in FG. Also, absorption at 1731 cm−1 due to the presence of C
C, and C–O bonds in GO, while peaks in the range of 3432 cm−1 and 1330 cm−1 are due to the presence of hydroxyl groups.20,21 The absorptions at 1207 cm−1 and 1059 cm−1, which correspond to C–O bond vibrations, are absent in the FG sample. This is due to the reduction of GO to graphene in FG. Also, absorption at 1731 cm−1 due to the presence of C![[double bond, length as m-dash]](https://www.rsc.org/images/entities/char_e001.gif) O in graphene oxide has almost vanished due to reduction of GO in the FG composite.
O in graphene oxide has almost vanished due to reduction of GO in the FG composite.
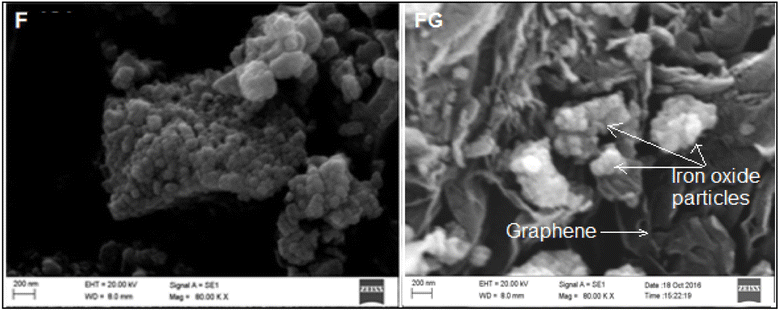
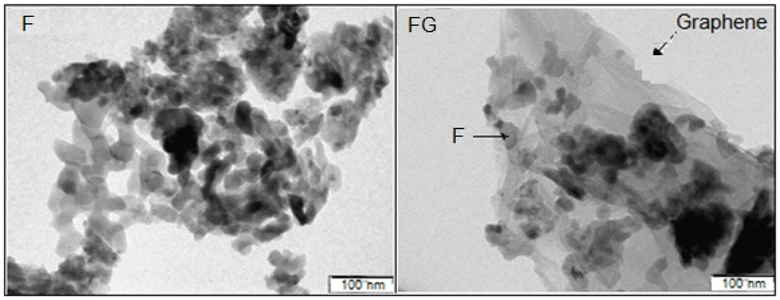
Graphene plays important role in inhibiting agglomeration of the nanoparticles by forming a layer around the particles, as seen in the SEM and TEM images in Fig. 3 and 4, which show iron oxide particles are well dispersed on graphene. The small crystallite size in FG is due to surface defects which originated from the oxygenated species in graphene. As reported by Seung-Keun Park et al., a higher defect will lead to a higher nucleation density and thus subsequently reduce the size of F.22,23Fig. 5. Gives the respective N2 adsorption–desorption isotherms and BJH pore size distribution as the inset. The surface area of the FG is higher than that of the F sample. The higher surface area of FG could be due to the presence of graphene as the support material. FG exhibits a higher pore radius of 67.21 Å than that of the F sample 62.28 Å.
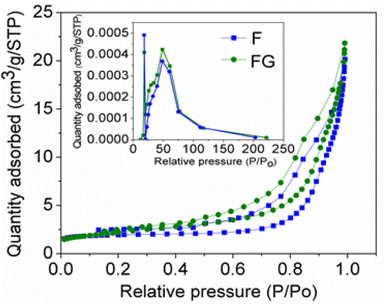 | ||
| Fig. 5 N2 adsorption–desorption isotherm for synthesized materials with the BJH pore size distribution as the inset. | ||
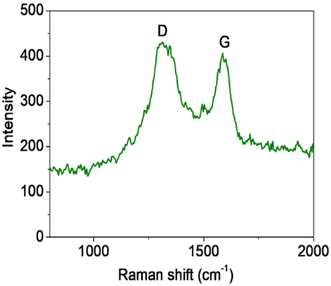
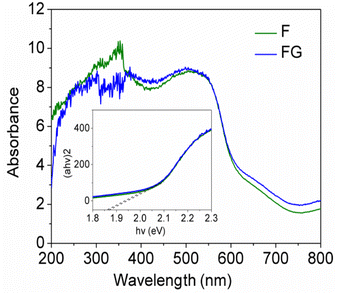
Raman spectroscopy is widely used to study the ordered/disordered crystalline structure of carbonaceous materials and usually Raman spectra show two peak, known as the G and D bands. Fig. 6 shows Raman spectra for the FG sample. The FG band at around 1594 cm−1 is characteristic of the presence of an sp2 carbon structure and the D band at 1332 cm−1 is associated with the presence of defects in hexagonal graphitic layers.24 UV-DRS absorption spectra were recorded for the synthesized graphene supported iron oxide, wherein for synthesized α-Fe2O3 (F) an absorption peak was observed at 662 nm, as seen in Fig. 7, and its calculated band gap is 1.83 eV. In the case of FG catalyst absorption, the peak shifts more in the visible region and the respective wavelength is 679 nm and its calculated band gap is 1.81 eV. This indicated that during syntheses, α-Fe2O3 is well incorporated into the structure of graphene. During the synthesis, oxygen containing functional groups on the graphene form a covalent bond with the semiconductor and form a localized state within it, therefore showing a decreased band gap in semiconductors upon reduction.25
3.2 Electrical properties
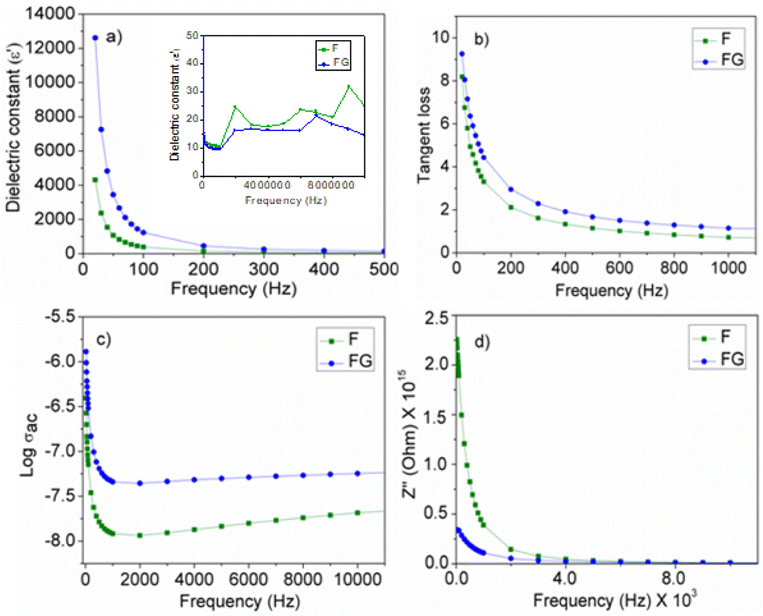
The electrical property of the metal oxide depends on its surface properties, such as its particle size, surface area, presence of a defect or imperfections in the lattice and also the presence of surface functionality. As seen in Fig. 8(a), the dielectric constant of F is increased in the presence of graphene as the support material. Graphene is associated with the presence of functional groups, such as –OH, –CHO, –CO and –COOH, and hence contributes to the enhanced dielectric property in the synthesized graphene supported composite. The increase in the dielectric constant in FG is due to the presence of defects, a small particle size and the surface functionality.26 The presence of surface functional groups improves the bonding between the metal oxide and graphene surface, which further improves the electrical contact and contributes to the interfacial polarization with an applied electric field. A high dielectric constant at a low frequency arises in the composite with the presence of interfacial polarization near the grain boundary interfaces. The high tangent loss at a low frequency is associated with a high leakage. A high leakage current is due to the small particle size of the FG. As the particle size decreases, the surface area increases and therefore decreases the interparticle distance and gives more leakage current. Along with dielectric constant and tangent loss, the conductivity was also increased in FG. The high conductivity FG is due to the presence of graphene, as graphene is known to have a high conductivity. High conductivity in FG represents an enhancement in the rate of the polaron hopping mechanism and will allow the flow of current readily.27 The presence of graphene not only improves the polaron hopping mechanism but also improves the conduction process. Improvement in the conduction process is seen by plotting the Bode plot as seen in Fig. 8d, which is a change in Z′′ with frequency. The change in Z′′ with frequency is due to the conduction process. As the frequency increases, conduction increases due to the release of space charge and therefore helps the electron hopping mechanism in the synthesized iron oxides.283.3 Decomposition of H2O2
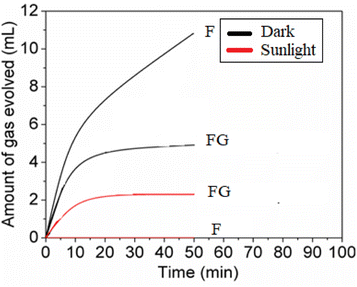
From the H2O2 decomposition results it is seen that after using graphene as the support for the F-121 catalyst, its activity for H2O2 decomposition was decreased in the dark. F was inactive for H2O2 decomposition in sunlight and its activity in sunlight is improved in the presence of graphene. In H2O2 decomposition in the dark, the Fenton process takes place in the presence of an iron oxide catalyst, whereas in sunlight the photo-Fenton process is initiated.29,30 In a Fenton like process, H2O2 will react with iron oxide and give H2O and O2, as shown in eqn (1). | (1) |
In this work, as seen from Fig. 9 and Table 2, the FG samples showed the least activity for the decomposition of H2O2. The evolution of O2 from H2O2 is assumed to follow a Fenton like process wherein Fe2+ is produced in situ from the ferric oxide.31
| Fe2O3(S) + 4H+ + H2O2 → 2Fe2+ + 3H2O + O2 | (2) |
| Catalyst code | Electrical properties at 1 MHz | H2O2 decomposition volume of gas evolved (mL) | ||||
|---|---|---|---|---|---|---|
| Dielectric constant (ε′) | Tangent loss | σ ac × 10−7 (S cm−1) | Impedance × 109 (Ohm) | Dark | Sunlight | |
| F | 10.4 | 0.08 | 4.78 | 2.15 | 11 | 0 |
| FG | 16.0 | 0.09 | 5.10 | 2.76 | 5 | 2 |
Fe2+ then generates further intermediates HO* and  , which are responsible for producing O2. The rate of production of Fe2+ would thus govern the rate of O2 liberation. Further, in the photo-Fenton process, the sunlight would excite an electron into the conduction band. This electron would cause reduction of the ferric iron from the oxide surface (eCB− + Fe3+ → Fe2+). Thus, the low activity for H2O2 decomposition would imply the non-availability of electron for the redox process.
The band gap values as obtained from UV-Vis spectra are generally reported to be around 2.10 eV.19 However, in the present case the samples showed relatively lower band gap values in the range 1.80–2.08 eV (Table 1). The lower band gap could facilitate the electron–hole pair recombination with the consequent non-availability of an electron for the Fe3+ reduction process. The electron from the conduction band may also be non-available by its dissipation of energy through a lattice relaxation process. Thus, a sample with a high activity in sunlight for H2O2 decomposition can be used for a further advanced photo-oxidation process.
The volume of oxygen gas collected is considered as a measure of the heterogeneous catalytic activity of the samples.32
In a H2O2 fuel cell, the following reactions occur
Anode: H2O2 → O2 + 2H+ + 2e−![[thin space (1/6-em)]](https://www.rsc.org/images/entities/char_2009.gif) Eo = 0.68 V Eo = 0.68 V | (3) |
Cathode: H2O2 + 2H+ + 2e− → 2H2O![[thin space (1/6-em)]](https://www.rsc.org/images/entities/char_2009.gif) Eo = 1.77 V Eo = 1.77 V | (4) |
Net reaction: 2H2O2 → O2 + 2H2O![[thin space (1/6-em)]](https://www.rsc.org/images/entities/char_2009.gif) Eocell = 1.09 V Eocell = 1.09 V | (5) |
The H2O2 fuel cell energy is produced by the anodic oxidation of hydrogen peroxide and its reduction at the cathode. Therefore, for fuel cell efficiency, it is important that H2O2 will not undergo a non-electrochemical decomposition in the presence of a catalyst. However, H2O2 is known to undergo heterogeneous catalytic decomposition (non-electrochemical, i.e., without electron transfer at the electrode electrolyte interface) on various transition metal oxides. It is therefore desirable to choose an appropriate catalyst that would have the minimum catalytic activity to liberate O2 during H2O2 decomposition.
3.4 Electrocatalytic activity
The open circuit potential was determined for one compartment fuel cell in a solution of 1 M H2O2 + 1 M NaCl at pH = 1. The electrodes were Ag wire and a GCE coated with the sample as the test electrode. The OCP obtained without catalyst was much lower at 0.56 V and further improved in the case of the iron oxide catalyst. The respective OCP values obtained are given in Table 3. F shows a lower OCP (0.63 V) than that of the FG (0.65 V) catalyst. FG shows a high electrocatalytic activity for the H2O2 fuel cell, although it has a low activity for H2O2 decomposition. The lower the activity for H2O2 decomposition, the more facile will be the reduction process at the cathode due to the availability of electrons coming from the anode.| Catalyst code | H2O2 decomposition vol. of O2 evolved (mL) | OCP (V) at pH = 1 | Peak power density (mW cm−2) | Current density (mA cm−2) at | |
|---|---|---|---|---|---|
| Dark | 0.2 V | 0.4 V | |||
| a 4.5 in F-4.5G-HySO4 is the amount of GO with respect to iron oxide to form graphene. | |||||
| F | 11 | 0.63 | 0.01 | 0.2 | 0.1 |
| FG | 5 | 0.65 | 0.03 | 0.5 | 0.1 |
| F-4.5G-HySO4 | — | 0.67 | 2.60 | 7.8 | 6.1 |
| Without catalyst | 0.5 | 0.56 | — | — | — |
Fig. 10(a) gives Tafel polarization curves. FG showed a much higher current than that of F. The FG sample showed a higher surface area (∼8.10 m2 g−1) with a smaller particle size (32.3 nm) than those of the F catalyst. The higher the surface area, the stronger will be the adsorption interaction of Fe3+ − O2−⋯H2O2 which will lead to the electrocatalytic reduction of H2O2. FG also showed a high ac conductivity which suggests that the electron transfer process on the electrode during the reaction is very facile.
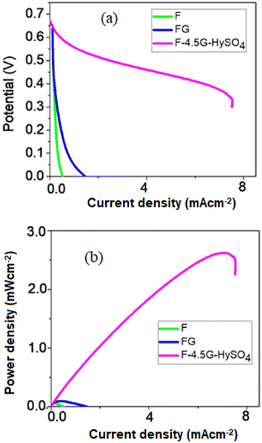 | ||
| Fig. 10 (a) Potential vs. current (b) power vs. current plots for synthesized materials electrocatalyst. | ||
The current density of FG was further improved with an increased amount of graphene and using hydrazine sulfate as the support material. It is well known that hydrazine increases the conductivity in graphene by restoring the sp2 hybridized network.33,34 The presence of graphene and hydrazine sulfate in the composite will collectively facilitate anchoring the H2O2 and facilitate electron transfer pathways for its electrochemical reduction.35
3.5 Photocatalytic activity
Photodegradation of methylene blue on the synthesized samples was carried out at pH = 7.5. Iron oxide with a low band gap value of 1.8 eV shows a high visible light activity, as seen in Fig. 11. The activity for methylene blue dye photodegradation was further improved when supported with graphene. The high activity of FG could be attributed to the higher separation efficiency of electron–hole pairs and the inhibition of recombination of electron–hole pairs, resulting in a greater number of holes available to undergo the photo-oxidation process. Also, graphene with a delocalized conjugated structure and superior electrical conductivity could efficiently transfer the photogenerated electrons. Photodegradation of methylene blue on FG was further improved in the presence of H2O2 as the oxidizing agent. In such cases, the Fe3+ species on the iron oxide surface can initiate the H2O2 activation by generating reactive radicals such as ˙OH and O2˙−, which will further degrade the organic dye.36 As seen from Fig. 11(b) synthesized FG catalyst can be easily recovered from the reaction mixture and reused several times without losing its activity.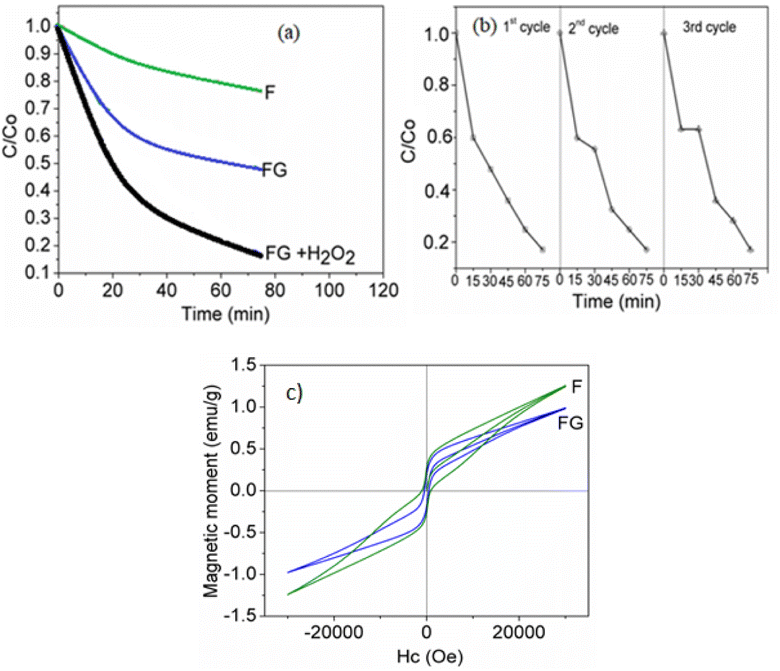 | ||
| Fig. 11 (a) Photodegradation of methylene blue dye in the presence and absence of H2O2. (b) Reusability of FG composite. (c) VSM magnetic hysteresis plot of the F and FG material catalysts. | ||
4. Conclusions
(1) Iron oxide was synthesized by using a combustion method and further supported with graphene. Synthesized graphene supported iron oxide showed a small particle size and high surface area with a high dielectric constant and high ac conductivity.(2) Electrocatalytic activity in the H2O2 fuel cell of graphene supported iron oxide was improved in the presence of hydrazine sulfate.
(3) Synthesized graphene supported iron oxide is highly active for methylene blue dye photodegradation and can be used several times without loss in its photocatalytic activity.
Conflicts of interest
There are no conflicts to declare.Acknowledgements
One of the authors, Madhavi D. Shete is grateful to the UGC- BSR fellowship for providing a student fellowship.References
- I. Kim, A. Magasinski, K. Jacob, G. Yushin and R. Tannenbaum, Carbon, 2013, 52, 56–64 CrossRef CAS.
- S. Re, M. Shaobo, Y. Yang and C. Hao, Electrochim. Acta, 2015, 178, 179–189 CrossRef.
- J. M. T. Desouza and M. Rangel, React. Kinet. Catal. Lett., 2004, 83, 93–98 CrossRef.
- R. Sugranez, J. Balbuena, M. Cruz-Yusta, F. martin, J. Morales and L. Sanchez, Appl. Catal., B, 2015, 165, 529–536 CrossRef CAS.
- K. Shimizu, A. Lasia and J. F. Boily, Langmuir, 2012, 28(20), 7914–7920 CrossRef CAS PubMed.
- N. Pariona, A. Martinez, H. Hdz-Garcia, L. Cruz and A. Hernandes- Valdes, Saudi J. Biol. Sci., 2017, 24, 1547–1554 CrossRef CAS PubMed.
- P. Dias, L. Andrade and A. Mendes, Nano Energy, 2017, 38, 218–231 CrossRef CAS.
- S. Shen, M. Li, L. Guo, J. Jiang and S. Mao, J. Colloid Interface Sci., 2014, 427, 20–24 CrossRef CAS PubMed.
- S. X. Izabela, H. V. V. Pacheco, E. Corecon and J. Fabris, Appl. Catal., B, 2012, 119–120, 175–182 Search PubMed.
- D. Ucar, Y. Zhang and I. Angelidaki, Front. Microbiol., 2017, 8, 643 Search PubMed.
- W. Zhou, L. Ge, Z. G. Chen, F. Liang, H. Y. Xu, J. Motuzas, A. Julbe and Z. Zhu, Chem. Mater., 2011, 23, 4193–4198 CrossRef CAS.
- M. Hasanzadeh, N. Shadjou and M. Guardian, TrAC, Trends Anal. Chem., 2015, 72, 1–9 CrossRef CAS.
- M. Skrzypkiewicz, I. L. Radziejewska and J. Jewulski, Int. J. Hydrogen Energy, 2015, 40, 13090–13098 CrossRef CAS.
- Y. Yamada, Y. Fukunishi, S. Yamazaki and S. Fukuzumi, Chem. Commun., 2010, 46, 7334–7336 RSC.
- S. A. M. Shaegh, N. T. Nguyen, S. M. M. Ehteshami and S. H. A. Chan, Energy Environ. Sci., 2012, 5, 8225–8228 RSC.
- S. Yamazaki, Z. Siroma, H. Senoh, T. Ioroi, N. Fujiwara and K. Yasuda, J. Power Sources, 2008, 178, 20–25 CrossRef CAS.
- Y. Yamada, M. Yoneda and S. Fukuzumi, Chem.–Eur. J., 2013, 19, 11733–11741 CrossRef CAS PubMed.
- S. Shinde, R. A. Bansode, C. H. Bhosale and K. Y. Rajpure, J. Semicond., 2011, 32(1), 013001–013008 CrossRef.
- F. Meng, J. Li, S. K. Cushing, J. Bright, M. Zhi, J. D. Rowley, Z. Hong, A. Manivannan, A. D. Bristow and N. Wu, ACS Catal., 2013, 3, 746–751 CrossRef CAS.
- D. Zvekic, V. Srdic, M. Karaman and M. Matavulj, Process. Appl. Ceram., 2011, 5, 41 CrossRef CAS.
- T. Kavitha, A. I. Gopalan, K. P. Lee and S. Y. Park, Carbon, 2012, 5, 2994 CrossRef.
- B. Zhao, Y. Zheng, F. Ye, X. Deng, X. Xu, M. Liu and Z. Shao, ACS Appl. Mater. Interfaces, 2015, 7, 14446–14455 CrossRef CAS PubMed.
- S. H. Yu, D. E. Conte, S. Baek, D. C. Lee, S. K. Park, K. J. Lee, Y. Piao, Y. E. Sung and N. Pinna, Adv. Funct. Mater., 2013, 23, 4293–4305 CrossRef CAS.
- D. Marcano, D. Kosynkin, J. Berlin, A. Sinitskii, Z. Sun, A. Slesarev, L. Alemany, W. Lu and J. Tour, ACS Nano, 2010, 4, 4806 CrossRef CAS PubMed.
- L. K. Putri, W. J. Ong, W. S. Chang and S. P. Chai, Appl. Surf. Sci., 2015, 358, 2–14 CrossRef CAS.
- R. K. Jammula, S. Pittala, S. Srinath and V. Srikanth, Phys. Chem. Chem. Phys., 2015, 17, 17237–17245 RSC.
- K. P. Priyanka, S. Joseph, S. Thankachan, E. M. Mohammed and T. Varghese, J. Basic Appl. Phys., 2013, 2, 4–7 Search PubMed.
- G. Vijayashri and R. N. Bhowmik, Res. Rev.: J. Pure Appl. Phys., 2015, 3, 30–37 Search PubMed.
- A. Kupreviciute, J. Banys and T. Ramoska, Ferroelectrics, 2011, 418, 94 CrossRef CAS.
- M. D. Shete and J. B. Fernandes, Mater. Chem. Phys., 2015, 165, 113–118 CrossRef CAS.
- M. Panda, V. Srinivas and A. K. Thakur, Appl. Phys. Lett., 2008, 93, 242908 CrossRef.
- S. Inamdar, P. Ingole and S. Haram, ChemPhysChem, 2008, 9, 2574–2579 CrossRef CAS PubMed.
- B. Seger and P. V. Kamat, J. Phys. Chem. C, 2009, 113, 7990–7995 CrossRef CAS.
- P. Mallick and B. N. Dash, Nanosci. Nanotechnol., 2013, 3, 130–134 Search PubMed.
- M. Dan, R. Zhong, S. Hu, H. Wu and Y. Zhou, Chem Catal., 2022,(2), 1919–1960 CrossRef CAS.
- K. Zhang and M. Dan, Adv. Funct. Mater., 2023, 33, 2302964 CrossRef CAS.
| This journal is © The Royal Society of Chemistry 2024 |

