 Open Access Article
Creative Commons Attribution 3.0 Unported Licence
Controlling the nanoparticle size and shape of a Pt/TiO2 catalyst for enhanced hydrogenation of furfural to furfuryl alcohol†
Heba
Alsharif
ab,
Matthew B.
Conway
 a,
David J.
Morgan
 a,
Thomas E.
Davies
a,
Stuart H.
Taylor
a,
Thomas E.
Davies
a,
Stuart H.
Taylor
 a and
Meenakshisundaram
Sankar
 *a
*a
aCardiff Catalysis Institute, Translational Research Hub, School of Chemistry, Cardiff University, Cardiff, CF24 4HQ, UK. E-mail: sankar@cardiff.ac.uk
bChemistry Department, Faculty of Science, Taibah University, 41477, Al-Madinah Al-Munawarah, Saudi Arabia
First published on 4th October 2024
Abstract
We report the selective liquid phase hydrogenation of furfural to 2-furfuryl alcohol using a Pt/TiO2 catalyst prepared by the wet-impregnation method under mild reaction conditions (30 °C and 3 bar H2 pressure). The effect of heat treatment protocols on the catalyst structures and the resultant catalytic properties of 4.2%Pt/TiO2 and 0.6%Pt/TiO2 was investigated. For both Pt loadings, the calcined + reduced catalyst exhibited higher activity compared to the reduced only catalyst, with the difference in activity being more pronounced for 4.2%Pt/TiO2 than for 0.6%Pt/TiO2. For the 4.2%Pt/TiO2 catalyst, the reduced-only sample achieved 25% conversion with 90% selectivity for 2-furfuryl alcohol after 6 hours, while the calcined + reduced sample reached 99% conversion with 59% selectivity under identical reaction conditions. For the 0.6%Pt/TiO2 catalyst, the reduced-only sample showed 70% conversion with 96% selectivity for 2-furfuryl alcohol, whereas the calcined + reduced sample achieved 97% conversion and 95% selectivity after a 2-h reaction. Characterisation of the samples using X-ray photoelectron spectroscopy, CO chemisorption and scanning transmission electron microscopy revealed that direct high temperature reduction resulted in a mixture of large Pt particles (>5 nm) with irregular shapes, small Pt nanoparticles (ca. 2 nm) and some sub-nm clusters. In contrast, calcination + reduction produced uniformly distributed Pt nanoparticles (ca. 2 nm) for both Pt loadings. Despite the presence of strong metal support interaction (SMSI) in Pt/TiO2 catalysts, no spectroscopic evidence for such a strong interaction was found in this study. Therefore, the observed difference in catalytic activity is attributed to the variations in the shapes and sizes of the Pt nanoparticles. During the synthesis of Pt/TiO2 catalysts, the calcination + reduction activation procedure is more beneficial for enhancing both activity and selectivity compared to a reduction only procedure.
Sustainability spotlightTo realise the NetZero goals and achieve a carbon-neutral society it is crucial to develop technologies to produce chemicals and fuels from renewable feedstock. Lignocellulosic (waste) biomass is an important alternative to the conventionally used fossil-fuel based feedstock to produce chemicals and fuel molecules. Catalysis plays a central role in this endeavour by reducing the temperature of the reaction and producing the desired compound selectively. Furfuraldehyde, derived from hemicellulose, is one of the potential biomass derived compounds that could replace fossil fuel derived platform molecules. This article reports strategies to enhance the activity of Pt/TiO2-based heterogeneous catalysts for the selective hydrogenation of furfural to furfuryl alcohol. Furfuryl alcohol is used as a monomer for producing polymers, fuel additives, dispersing agents and many more. Hence it is an important chemical in chemical and fuel production. This article targets the following UN SDGs: Affordable and Clean Energy (SDG 7), Industry, Innovation, and Infrastructure (SDG 9) and Climate Action (SDG 13). |
Introduction
The conversion of lignocellulosic biomass-derived platform molecules to replace fossil fuel-based feedstocks for producing chemicals and fuel components has gained significant attention due to the global effort to achieve NetZero emissions by 2050.1–3 The US Department of Energy (DoE) has identified furfural (FF), derived from hemicellulose, as one of the 12 potential platform molecules capable of replacing fossil fuel-based feedstocks for chemical and fuel production.4 FF is produced in excellent yields by dehydrating xylose using ionic liquids or other acidic catalysts.5–7 It can be converted into several industrially important chemicals through oxidation, hydrogenation and hydrogenolysis reactions.5,8,9 Catalytic hydrogenation of FF yields various industrially significant compounds, such as tetrahydro furan (THF), tetrahydro furfuryl alcohol (2-THFA),10 2-methyl furan (2-MF),11 and furfuryl alcohol (2-FFA),12 among others, as illustrated in Scheme 1. Among these compounds, 2-FFA is particularly valuable due to its diverse industrial applications, including its use as a monomer for furanic resins, a fuel component, and a dispersing agent.13,14 Furthermore, 2-FFA can be fully hydrogenated to tetrahydrofurfuryl alcohol (2-THFFA), an environmentally benign, biodegradable green solvent. The hydrodeoxygenation of 2-FFA produces 2-methyl furan (2-MF), which serves as a fuel additive.15,16 Therefore, developing an active heterogeneous catalyst for the selective hydrogenation of FF to 2-FFA is highly attractive from both industrial and academic perspectives.13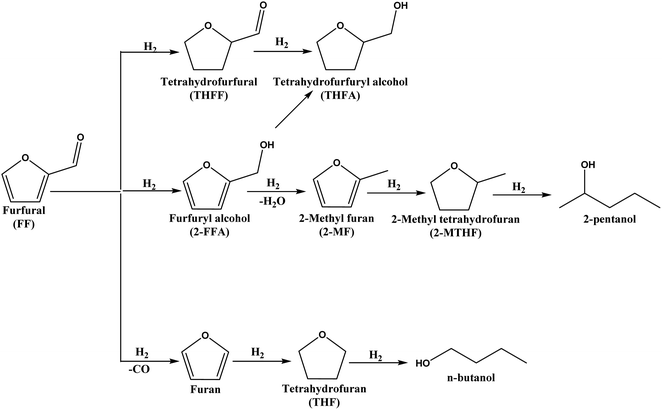 | ||
| Scheme 1 Schematic representation of the various products formed from the hydrogenation of furfural. | ||
The hydrogenation of FF results in several products, which can potentially reduce the selectivity to 2-FFA. Other possible side reactions include hydrogenation of the C![[double bond, length as m-dash]](https://www.rsc.org/images/entities/char_e001.gif) C bond, hydrogenolysis (hydrodeoxygenation), ring opening and decarbonylation reactions (Scheme 1).13,14,17 Consequently, designing catalysts for the selective conversion of FF to 2-FFA is challenging. Industrial production of 2-FFA involves the reduction of FF over a copper chromite catalyst at 180 °C and 70 to 100 bar of H2.18,19 However, during this reaction, the chromite catalyst converts to chromate which is toxic and harmful to the environment.18 Therefore, research efforts should focus on developing environmentally benign catalysts that are active and selective under mild reaction conditions. Although gas-phase hydrogenation20 and transfer hydrogenation21 have been reported for this transformation, catalytic hydrogenation using gaseous hydrogen under mild reaction conditions is highly desirable for the sustainable production of 2-FFA.22 These reactions are carried out at high temperatures (ca. 200 °C), in contrast to the ambient reaction condition reactions pursued in this work.
C bond, hydrogenolysis (hydrodeoxygenation), ring opening and decarbonylation reactions (Scheme 1).13,14,17 Consequently, designing catalysts for the selective conversion of FF to 2-FFA is challenging. Industrial production of 2-FFA involves the reduction of FF over a copper chromite catalyst at 180 °C and 70 to 100 bar of H2.18,19 However, during this reaction, the chromite catalyst converts to chromate which is toxic and harmful to the environment.18 Therefore, research efforts should focus on developing environmentally benign catalysts that are active and selective under mild reaction conditions. Although gas-phase hydrogenation20 and transfer hydrogenation21 have been reported for this transformation, catalytic hydrogenation using gaseous hydrogen under mild reaction conditions is highly desirable for the sustainable production of 2-FFA.22 These reactions are carried out at high temperatures (ca. 200 °C), in contrast to the ambient reaction condition reactions pursued in this work.
The nature of the metal, support, metal particle size, solvent, and reaction conditions, such as temperature, pressure, and catalyst concentration, influences the activity and selectivity of this reaction.23 For example, polar solvents have been reported to significantly improve the rate of the FF hydrogenation reaction, although they also promote the formation of acetyl and/or ester compounds. Dichloromethane, on the other hand, has been reported to promote the hydrodeoxygenation of FF to 2-MF.24–27 Wang et al. reported that higher H2 pressure favoured the hydrogenation of FF to 2-FFA, while lower pressure favoured the hydrogenolysis of FF to furan (F) over a supported Pt catalyst.28 Supported Pd catalysts favoured the complete hydrogenation of FF to tetrahydrofurfuryl alcohol instead of 2-FFA, whereas supported Pt catalysts favoured the formation of 2-FFA.24,27
Pt/TiO2 has been reported as an effective catalyst for the selective hydrogenation of FF to 2-FFA and is extensively studied for its strong metal support interaction (SMSI).29,30 SMSI is beneficial due to the electron rich metal-support interfacial sites and the oxygen vacancies on the TiO2 surface.31,32 This SMSI effect can be tuned by employing different heat treatment protocols during catalyst syntheses. Corma et al. reported that reducing 0.2%Pt/TiO2 at 450 °C results in a TiO2 overlayer over Pt nanoparticles (SMSI); this catalyst was found to be chemoselective (93% selectivity) whereas 0.2%Pt/TiO2 without any SMSI is found to be less chemoselective (42% selectivity) during the hydrogenation of 3-nitrostyrene to 3-aminostyrene.31 Recently, we reported a high temperature (450 °C) reduction-only treatment of the 0.5%Pt/TiO2 catalyst which resulted in substantial coverage of the Pt nanoparticles by a TiO2 overlayer, making it less active for the chemoselective hydrogenation of 3-nitrostyrene to 3-vinylaniline. However, when 0.5%Pt/TiO2 was calcined and reduced at 450 °C, the TiO2 coverage was much lower, and the catalyst was much more active.33 These examples illustrate that SMSI can be either beneficial or detrimental to the catalytic properties of Pt/TiO2. Several groups have reported a size dependent SMSI effect for Pt/TiO2 and Au/TiO2 catalysts.29,34 In supported metal catalysts, high temperature reduction increases the metal particle size and reduced catalytic activity.35 Therefore, understanding the relationship between heat treatment protocols, structural properties and catalytic properties is crucial. This work aims to understand the relationship between heat treatment protocols and the catalytic properties of Pt/TiO2 for the selective hydrogenation of FF to 2-FFA under mild reaction conditions.
Experimental
Materials and methods
All the chemicals used in this work were purchased from commercial sources and were used without any further purification: H2PtCl6·6H2O (Sigma-Aldrich, ≥37.50% Pt basis), titania P25 (99.9%, Degussa), furfural (99%, Sigma-Aldrich), furfuryl alcohol (98%, Sigma-Aldrich) and isopropanol (99.5%, Fisher Scientific).Catalytic testing
Catalyst characterisation
Results and discussion
Catalyst testing
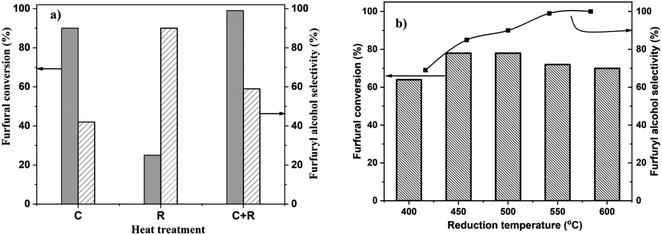
Heat treatment during catalyst synthesis plays a crucial role in determining the structural properties of Pt/TiO2 catalysts, particularly regarding the extent of strong metal support interactions (SMSIs), metal particle sizes and nanostructures. SMSI in Pt/TiO2 has been reported to significantly impact catalytic activity, selectivity and stability in various reactions, including hydrogenation of nitroarenes,31 CO2 hydrogenation,37 and propane dehydrogenation.38 Recently, we reported how heat treatment protocols tune the Pt loading-dependent SMSI on Pt/TiO2 and its effect on the chemoselective hydrogenation of 3-nitrostyrene.33 Similarly, heat treatment protocols play a crucial role in the catalytic activities of Pt/TiO2 during CO oxidation, photocatalytic alcohol oxidation and hydrogen evolution reactions.39–41 To study the relationship between Pt loading, heat treatment and the catalytic properties of Pt/TiO2 for the chemoselective hydrogenation of FF, we prepared 4.2 wt% Pt/TiO2 catalysts using the wet-impregnation method. The dried only catalyst was either reduced at 450 °C (R), calcined at 450 °C (C) or calcined at 450 °C followed by reduction at 450 °C for 4 h (C + R). To study the effect of catalyst heat treatment on FF hydrogenation activity, we tested 4.2%Pt/TiO2 (C), 4.2%Pt/TiO2 (R) and 4.2%Pt/TiO2 (C + R) materials. The results (Fig. 1a) show that 4.2%Pt/TiO2 (R) is the least active catalyst, with ca. 25% conversion with 90% selectivity to 2-FFA after 6 h. The 4.2%Pt/TiO2 (C) catalyst showed 90% conversion and 42% selectivity. However, the 4.2%Pt/TiO2 (C + R) catalyst exhibited the highest conversion (ca. 99%) with 59% selectivity to 2-FFA. Fig. 1 shows the selectivity data for 2-FFA only. A detailed selectivity profile is provided in Table S1 (ESI).†When alcohols are used as solvents in this reaction, FF and 2-FFA undergo acetylation, resulting in products referred to as solvent products in this article (ESI, Scheme S1†).27 However, these solvent products are formed in lower quantities (>5%). These reactions are catalyzed by the acidic sites on the TiO2 support. Numerous studies have quantified the acidic sites on the TiO2 material used in this research.42 The catalytic performance as a function of the reaction time for 4.2%Pt/TiO2 (R) and 4.2%Pt/TiO2 (C + R) shows a clear difference in the activity and selectivity between them (ESI, Fig. S1†). The lowest activity for 4.2%Pt/TiO2 (R) could be because of two reasons: (a) SMSI leading to loss of Pt surface atoms and (b) large Pt particle size because of high temperature reduction. Both phenomena have been reported during high temperature reduction of supported Pt nanoparticles.30,32,34,38,41 The difference in 2-FFA selectivity between 4.2%Pt/TiO2 (C) and 4.2%Pt/TiO2 (R) catalysts suggests that the Pt oxidation state plays an important role in the catalytic properties. Since 4.2%Pt/TiO2 (C + R) is the most active and selective catalyst for this reaction, C + R treatment was performed for all the other samples.
To study the effect of reduction temperature, the dried only catalyst was calcined at 450 °C and then reduced at different temperatures ranging from 400 °C to 600 °C. The catalytic results for all these materials are presented in Fig. 1b. 4.2%Pt/TiO2 (C + R) – 450 °C showed the highest FF conversion (78%) with 87% selectivity to 2-FFA. The 4.2%Pt/TiO2 (C + R) – 600 °C catalyst showed the highest 2-FFA selectivity (98%) but with a lower conversion (70%). The data presented in Fig. 2b show that the 2-FFA selectivity increases with an increase in the catalyst reduction temperature; however, the conversion is the highest for the catalyst reduced at 450 °C and 500 °C. All these results clearly show that heat treatment has a significant impact on the catalytic properties (activity and selectivity) of 4.2%Pt/TiO2 for the chemoselective hydrogenation of FF to 2-FFA.
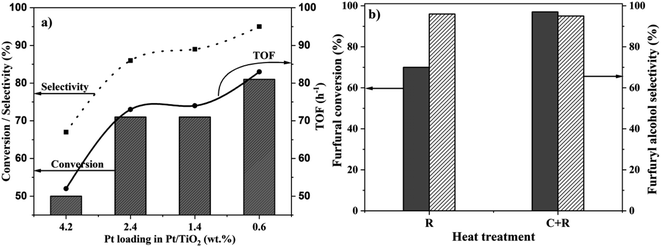
Pt loading on the support influences the particle size and the extent of SMSI, and hence the catalytic properties.29,33 To study this in detail, Pt/TiO2 catalysts, with four different Pt loadings (4.2 wt%, 2.4 wt%, 1.4 wt% and 0.6 wt%) were synthesized and calcined at 450 °C and reduced (C + R) at 450 °C for 4 h. All these catalysts were tested for the hydrogenation of FF and the results are presented in Fig. 2a. The corresponding catalytic performance as a function of the reaction time is presented in the ESI (Fig. S2–S4).† To normalize different Pt loadings, the catalyst masses were varied to maintain a constant FF![[thin space (1/6-em)]](https://www.rsc.org/images/entities/char_2009.gif) :
:![[thin space (1/6-em)]](https://www.rsc.org/images/entities/char_2009.gif) Pt molar ratio of 207. The catalytic data clearly show that the conversion increases substantially with the reduction in the Pt loading. 0.6% Pt shows the highest catalytic activity among all the catalysts tested. The conversion and selectivity for the catalysts with different Pt loadings followed the same trend – 4.2%Pt/TiO2 (50% conversion & 67% selectivity) < 2.4%Pt/TiO2 (71% conversion & 86% selectivity) < 1.4%Pt/TiO2 (71% conversion & 89% selectivity) < 0.6%Pt/TiO2 (81% conversion with 95% selectivity) after 2 h reaction time. The activities of 2.4%Pt/TiO2 and 1.4%Pt/TiO2 are similar suggesting that their structural features, most likely Pt particle sizes, are similar.
Pt molar ratio of 207. The catalytic data clearly show that the conversion increases substantially with the reduction in the Pt loading. 0.6% Pt shows the highest catalytic activity among all the catalysts tested. The conversion and selectivity for the catalysts with different Pt loadings followed the same trend – 4.2%Pt/TiO2 (50% conversion & 67% selectivity) < 2.4%Pt/TiO2 (71% conversion & 86% selectivity) < 1.4%Pt/TiO2 (71% conversion & 89% selectivity) < 0.6%Pt/TiO2 (81% conversion with 95% selectivity) after 2 h reaction time. The activities of 2.4%Pt/TiO2 and 1.4%Pt/TiO2 are similar suggesting that their structural features, most likely Pt particle sizes, are similar.
The effect of heat treatment (R vs. C + R) on the catalytic properties of the most active 0.6%Pt/TiO2 catalyst was investigated and the results are presented in Fig. 2b. Similar to the 4.2%Pt/TiO2 catalyst, the 0.6%Pt/TiO2 (C + R) catalyst is more active (97% conversion) than 0.6%Pt/TiO2 (R) (70% conversion) with the same 2-FFA selectivity (ca. 95%). However, the difference in catalytic activity between the two heat treated samples is much smaller for the 0.6%Pt/TiO2 catalyst (27%) compared to the 4.2%Pt/TiO2 catalyst (74%). This suggests that the extent of the role of heat treatment in the structural features of Pt/TiO2 depends on Pt loading. The catalytic performance data as a function of the reaction time of the 0.6%Pt/TiO2 catalyst (Fig. 2b) show a higher rate of FF conversion for the first 2 h (80% conversion) followed by a slower rate regime to reach >98% conversion after 6 h. Initially, the reaction was highly selective to 2-FFA (100% after 1 h); however, the selectivity decreased slightly with time (95% after 6 h). This reduction in selectivity is due to the formation of an acetylation product (ESI Scheme S1†). Among the catalysts tested in this work, 0.6%Pt/TiO2 (C + R) is the most active catalyst for the liquid phase chemoselective hydrogenation of FF to 2-FFA at 30 °C and is also one of the most active catalysts reported for this transformation (ESI, S3†).
Catalyst stability during the reaction and its reusability for subsequent reactions are crucial for heterogeneous catalysts. Reusability of the 0.6%Pt/TiO2 (C + R) catalyst was tested and the results are presented in Fig. 3.
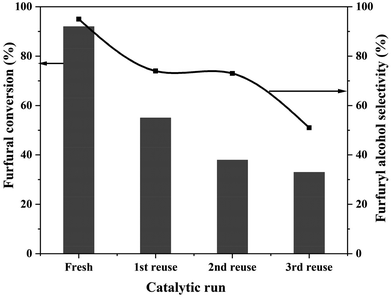 | ||
| Fig. 3 Reusability of the 0.6%Pt/TiO2 (C + R) catalyst. Reaction conditions: FF: 4.45 mmol; i-PrOH: 15 mL; temp: 30 °C; H2: 3 bar; substrate/metal molar ratio = 207; time: 3 h. | ||
0.6%Pt/TiO2 lost activity during reuse, decreasing from 90% conversion for the fresh catalyst to 35% conversion during the 3rd recycle. The 2-FFA selectivity also reduced from 95% to 51% during the 3rd recycle. There is a clear deactivation of this catalyst. Preliminary studies of the deactivated samples suggest that the deactivation is due to the sintering of particles and there is no leaching of Pt. However, detailed investigation is needed.
Catalyst characterisation
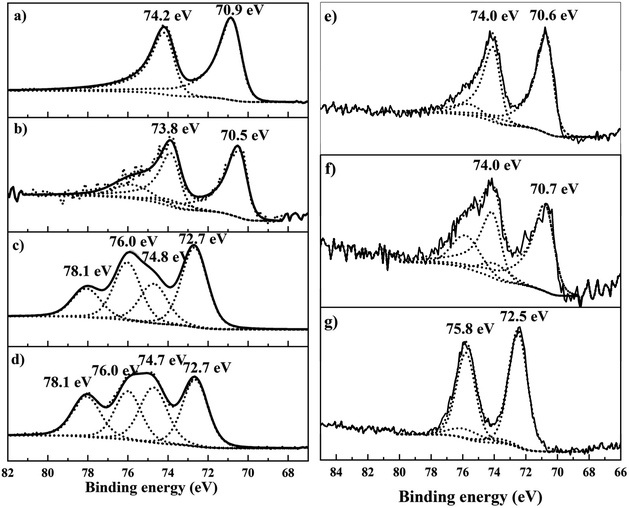
To understand the relationship between the observed catalytic behaviour, heat treatment protocols and metal loading, all the catalysts were characterized by XPS, TEM and CO chemisorption.To understand the effect of heat treatment protocols and Pt loading on the valence states, the dried only, reduced only and calcined + reduced materials were characterized by XPS (Fig. 4). The dried 4.2%Pt/TiO2 catalyst (Fig. 4d) revealed two Pt species; the first at 72.7 eV corresponding to Pt2+ in Pt(OH)2, whilst the peak at 74.7 eV is assigned to PtClx species, and supported by a significant corresponding chlorine signal (not shown). Calcination (Fig. 4c) reduces the total chloride content; however, some Pt–Cl species remain on the sample surface. Reductive treatment at 450 °C reveals the characteristic asymmetric shape of metallic Pt0(4f7/2) centered at 70.5 eV (Fig. 4b). For the calcined + reduced sample the Pt0(4f7/2) binding energy is slightly higher at 70.9 eV (Fig. 4a), and is expected for bulk metallic Pt, and this indicates the absence of a strong interaction between Pt and TiO2. The reduced only sample shows a high negative BE shift (ca. 0.4 eV) compared to the calcined + reduced sample. A strong electronic interaction between TiO2 and Pt or a large increase in the Pt metal particle size for the reduced only sample can explain this negative BE shift. A strong interaction between TiO2 and Pt results in the transfer of electrons from Ti3+ to Pt and can result in a negative shift of the Pt0(4f7/2) BE for the reduced only sample.29 Another interpretation could be the presence of large Pt nanoparticles in the reduced-only sample resulting in a negative BE shift because of the relaxation shift.43 For the 0.6%Pt/TiO2 sample, there is no difference in the Pt0 (4f7/2) binding energies between the reduced only and calcined + reduced samples (70.6 eV for the reduced only sample and 70.7 eV for the calcined + reduced sample). The XPS data clearly indicate the difference in Pt valence states for the reduced only and calcined + reduced samples of 4.2%Pt/TiO2 catalysts. However, no such difference in BE is observed for the 0.6%Pt/TiO2 sample and this matches the catalytic activity trend observed for these catalysts. A detailed BE assignment is provided in the ESI (Table S2).† To investigate the reason behind the negative shift in BE between the reduced only and the calcined + reduced samples of the Pt/TiO2 catalysts, they were characterised by CO chemisorption (Table 1).
For both loadings, the reduced only sample has a lower Pt surface area compared to the calcined + reduced samples. However, the difference between them is more pronounced in the 4.2%Pt/TiO2 catalyst; the calcined + reduced sample has 10-fold more Pt surface area compared to the reduced only sample. However, for the 0.6%Pt/TiO2 catalyst, the calcined + reduced sample has ca. 3-fold more Pt surface area compared to the reduced only sample. This trend matches well with the observed catalytic trend for all these samples. Either Pt particle size changes or the extent of TiOx covering the Pt surface (typically called SMSI) can influence the Pt surface area derived from CO chemisorption measurements.
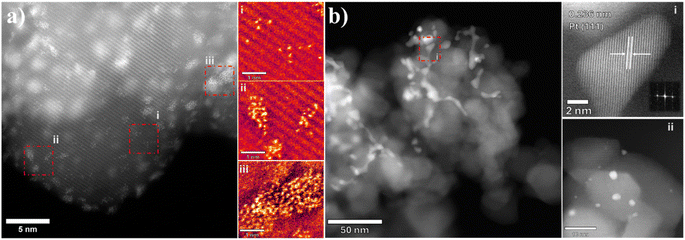
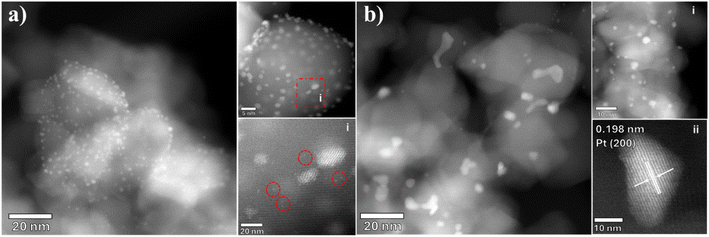
Selected Pt/TiO2 samples were characterized by scanning transmission electron microscopy (STEM) to assess the Pt particle size distribution (Fig. 5 and 6). The 4.2%Pt/TiO2 (C + R) sample (Fig. 5a) displays a narrow particle size distribution with most of the particles being disordered finite aggregates of atoms in the range of ca. 1–2 nm (Fig. 5a(ii) and (iii)). Several sub-nm Pt clusters and single atoms of Pt can also be seen (Fig. 5a(i)). On the other hand, the 4.2%Pt/TiO2 (R) sample has a heterogeneous distribution of Pt particles (Fig. 5b). A large proportion of the particles are coral-like structures (>50 nm) with irregular shapes with a smaller number present as faceted nanoparticles with diameters of approximately 1–5 nm (Fig. 5b(ii)). This clearly indicates that the observed negative shift in BE for the Pt0(4f7/2) peak is due to large (>5 nm) Pt nanoparticles and not because of SMSI. Lattice measurements of the larger particles give a spacing of 0.236 nm consistent with the (111) plane in cubic Pt (ICDD 00-004-0802) (Fig. 5b(i)). Careful analyses of the STEM images did not provide any evidence of a TiOx layer covering the Pt nanoparticles' surface. This rules out the possibility of a strong metal support interaction between Pt and TiO2. Fig. S5 (ESI)† shows the lower magnification images of these samples further highlighting the presence of large Pt nanoparticles with highly irregular shapes in the reduced only samples. This is consistent with the CO chemisorption data. The observed difference in catalytic activity between 4.2%Pt/TiO2 (R) and 4.2%Pt/TiO2 (C + R) is therefore determined to be due to the clear and distinct difference in particle size and morphology. The STEM images of 0.6%Pt/TiO2 (Fig. 6a and b) show a similar trend. 0.6%Pt/TiO2 (C + R) (Fig. 6a) has a mixture of small Pt particles (<2 nm) and some sub-nm Pt clusters and Pt atoms (Fig. 6a(i)). However, 0.6%Pt/TiO2 (R) shows a mixture of large Pt particles (>20 nm) with irregular shapes (Fig. 6b) and small (<2 nm) Pt particles (Fig. 6b(ii)). Again, the lattice fringe measurements determine the particle to be Pt as opposed to PtOx (Fig. 6b(i)). This is consistent with the difference in Pt surface area (Table 1) observed for these two samples. Due to the presence of single atoms, clusters, non-uniform corals and quasi-spherical Pt particles a meaningful particle size distribution for these catalysts could not be calculated.
Preliminary investigations were conducted to understand the reason for the deactivation of the 0.6%Pt/TiO2 catalyst. XPS spectra of the spent catalyst (after 3 runs) show no difference in the Pt0(4f7/2) BE compared to that of the fresh sample (ESI, Fig. S7†), suggesting no change in the oxidation state or the particle sizes of Pt in the deactivated catalyst. The Pt content of the fresh and the spent samples of 0.6%Pt/TiO2, analysed by ICP-MS, (ESI, Table S3†) did not show any change, ruling out Pt leaching during the reaction. Preliminary low-resolution TEM analyses of the fresh and deactivated samples (ESI, Fig. S8†) did not show any major changes in the Pt particle size which aligns with the XPS results of the spent sample. As mentioned above, all these catalysts contain a heterogeneous mixture of Pt single atoms, sub-nm clusters and large nanoparticles. Hence, a meaningful particle size distribution cannot be calculated. Due to this uncertainty in the Pt particle size distribution sintering cannot be completely ruled out. Further investigation is necessary to find out the reason for catalyst deactivation.
Conclusions
Here we report that 0.6%Pt/TiO2 calcined and reduced at 450 °C is an active and selective catalyst for the liquid phase hydrogenation of furfural to 2-furfuryl alcohol at 30 °C under 3 bar H2. This is one of the most active catalysts reported in the literature (ESI, Table S4†). XPS, CO chemisorption and STEM characterization of this catalyst revealed small Pt particles (<2 nm) with uniform distribution, making it one of the most active catalysts reported for this transformation. For both 4.2%Pt/TiO2 and 0.6%Pt/TiO2 catalyst heat treatment plays a crucial role. Direct high temperature reduction at 450 °C results in a mixture of large Pt particles (>5 nm) with irregular shapes, small nanoparticles (ca. 2 nm) and some sub-nm clusters. STEM characterization did not provide any evidence for a strong metal support interaction (SMSI) in the reduced only samples. However, calcination followed by reduction at 450 °C results in a more uniform distribution of Pt nanoparticles. Consequently, the calcined + reduced catalysts are more active than the reduced only catalysts. The difference between the two heat treated samples is more pronounced in 4.2%Pt/TiO2.Data availability
The data supporting this article have been included as part of the ESI.†Conflicts of interest
There are no conflicts to declare.Acknowledgements
HA thanks the Kingdom of Saudi Arabia and Taibah University for funding her PhD studies. MC and MS acknowledge the funding by the Engineering and Physical Sciences Research Council via the Prosperity Partnership EP/V056565/1 with bp and Johnson Matthey plc in collaboration with Cardiff University and the University of Manchester. XPS data collection was performed at the EPSRC National Facility for XPS (“HarwellXPS”), operated by Cardiff University and UCL, under Contract No. PR16195. The authors would like to thank the CCI-Electron Microscopy Facility which has been partially funded by the European Regional Development Fund through the Welsh Government and The Wolfson Foundation.References
- G. W. Huber, S. Iborra and A. Corma, Chem. Rev., 2006, 106, 4044–4098 CrossRef CAS PubMed.
- G. Li, R. Wang, J. Pang, A. Wang, N. Li and T. Zhang, Chem. Rev., 2024, 124, 2889–2954 CrossRef CAS PubMed.
- A. S. Rathore and A. Singh, J. Chem. Technol. Biotechnol., 2022, 97, 597–607 CrossRef CAS.
- T. Werpy and G. Petersen, Top Value Added Chemicals from Biomass, Volume I, Results of Screening for Potential Candidates from Sugar and Synthesis Gas, US Department of Energy DOE/GO-102004-1992, 2004, http://www.eere.energy.gov/biomass/pdfs/35523.pdf Search PubMed.
- A. Jaswal, P. P. Singh and T. Mondal, Green Chem., 2022, 24, 510–551 RSC.
- S. Peleteiro, S. Rivas, J. L. Alonso, V. Santos and J. C. Parajó, Bioresour. Technol., 2016, 202, 181–191 CrossRef CAS PubMed.
- V. Choudhary, S. I. Sandler and D. G. Vlachos, ACS Catal., 2012, 2, 2022–2028 CrossRef CAS.
- R. Mariscal, P. Maireles-Torres, M. Ojeda, I. Sádaba and M. López Granados, Energy Environ. Sci., 2016, 9, 1144–1189 RSC.
- X. Li, P. Jia and T. Wang, ACS Catal., 2016, 6, 7621–7640 CrossRef CAS.
- J. Wu, X. Zhang, Q. Chen, L. Chen, Q. Liu, C. Wang and L. Ma, Energy Fuels, 2019, 34, 2178–2184 CrossRef.
- Q. Yuan, J. Pang, W. Yu and M. Zheng, Catalysts, 2020, 10(11), 1304 CrossRef CAS.
- A. C. Matsheku, M. C. Maumela and B. C. E. Makhubela, RSC Sustainability, 2023, 1, 1471–1483 RSC.
- A. Racha, C. Samanta, S. Sreekantan and B. Marimuthu, Energy Fuels, 2023, 37, 11475–11496 CrossRef CAS.
- Z. An and J. Li, Green Chem., 2022, 24, 1780–1808 RSC.
- J. Chuseang, R. Nakwachara, M. Kalong, S. Ratchahat, W. Koo-amornpattana, W. Klysubun, P. Khemthong, K. Faungnawakij, S. Assabumrungrat, V. Itthibenchapong and A. Srifa, Sustainable Energy Fuels, 2021, 5, 1379–1393 RSC.
- M. Thewes, M. Muether, S. Pischinger, M. Budde, A. Brunn, A. Sehr, P. Adomeit and J. Klankermayer, Energy Fuels, 2011, 25, 5549–5561 CrossRef CAS.
- Y. Wang, D. Zhao, D. Rodríguez-Padrón and C. Len, Catalysts, 2019, 9, 796 CrossRef.
- Q. Yang, D. Gao, C. Li, S. Cao, S. Li, H. Zhao, C. Li, G. Zheng and G. Chen, Fuel, 2022, 311, 122584 CrossRef CAS.
- F. Hao, J. Zheng, S. He, H. Zhang, P. Liu, H. Luo and W. Xiong, Catal. Commun., 2021, 151, 106266 CrossRef CAS.
- K. Vikrant and K. Kim, Sci. Total Environ., 2023, 904, 166882 CrossRef CAS PubMed.
- L. Grazia, A. Lolli, F. Folco, Y. Zhang, S. Albonetti and F. Cavani, Catal. Sci. Technol., 2016, 6, 4418 RSC.
- X. Li, P. Jia and T. Wang, ACS Catal., 2016, 6(11), 7621 CrossRef CAS.
- Z. Yu, X. Lu, X. Wang, J. Xiong, X. Li, R. Zhang and N. Ji, ChemSusChem, 2020, 13, 5185–5198 CrossRef CAS PubMed.
- R. Albilali, M. Douthwaite, Q. He and S. H. Taylor, Catal. Sci. Technol., 2018, 8, 252–267 RSC.
- X. Gao, S. Tian, Y. Jin, X. Wan, C. Zhou, R. Chen, Y. Dai and Y. Yang, ACS Sustain. Chem. Eng., 2020, 8, 12722–12730 CrossRef CAS.
- J. Wang, C.-Q. Lv, J.-H. Liu, R.-R. Ren and G.-C. Wang, Int. J. Hydrogen Energy, 2021, 46, 1592–1604 CrossRef CAS.
- M. J. Taylor, L. J. Durndell, M. A. Isaacs, C. M. A. Parlett, K. Wilson, A. F. Lee and G. Kyriakou, Appl. Catal., B, 2016, 180, 580–585 CrossRef CAS.
- C. Wang, J. Luo, V. Liao, J. D. Lee, T. M. Onn, C. B. Murray and R. J. Gorte, Catal. Today, 2018, 302, 73–79 CrossRef CAS.
- Z. Wu, Y. Li and W. Huang, J. Phys. Chem. Lett., 2020, 11, 4603–4607 CrossRef CAS PubMed.
- A. Beck, H. Frey, X. Huang, A. H. Clark, E. D. Goodman, M. Cargnello, M. Willinger and J. A. van Bokhoven, Angew. Chem., Int. Ed., 2023, 62, e202301468 CrossRef CAS PubMed.
- A. Corma, P. Serna, P. Concepción and J. J. Calvino, J. Am. Chem. Soc., 2008, 130, 8748–8753 CrossRef CAS PubMed.
- T. Pu, W. Zhang and M. Zhu, Angew. Chem., Int. Ed., 2023, 62, e202212278 CrossRef CAS PubMed.
- M. Macino, A. J. Barnes, S. M. Althahban, R. Qu, E. K. Gibson, D. J. Morgan, S. J. Freakley, N. Dimitratos, C. J. Kiely, X. Gao, A. M. Beale, D. Bethell, Q. He, M. Sankar and G. J. Hutchings, Nat. Catal., 2019, 2, 873–881 CrossRef CAS.
- X. Du, Y. Huang, X. Pan, B. Han, Y. Su, Q. Jiang, M. Li, H. Tang, G. Li and B. Qiao, Nat. Commun., 2020, 11, 5811 CrossRef CAS PubMed.
- C. T. Campbell, Acc. Chem. Res., 2013, 46, 1712–1719 CrossRef CAS PubMed.
- G. Bergeret and P. Gallezot, Particle Size and Dispersion Measurements, in Handbook of Heterogeneous Catalysis, ed. G. Ertl, H. Knözinger, F. Schüth and J. Weitkamp, 2008, DOI:10.1002/9783527610044.hetcat0038.
- W. Zhang, H. Lin, Y. Wei, X. Zhou, Y. An, Y. Dai, Q. Niu, T. Lin and L. Zhong, ACS Catal., 2024, 14, 2409–2417 CrossRef CAS.
- J. Zhu Chen, J. Gao, P. R. Probus, W. Liu, X. Wu, E. C. Wegener, A. J. Kropf, D. Zemlyanov, G. Zhang, X. Yang and J. T. Miller, Catal. Sci. Technol., 2020, 10, 5973–5982 RSC.
- J. Cai, Z. Yu, X. Fan and J. Li, Molecules, 2022, 27(12), 3875 CrossRef CAS PubMed.
- J. L. Falconer and K. A. Magrini-Bair, J. Catal., 1998, 179, 171–178 CrossRef CAS.
- R. Rajalakshmi, G. Srividhya, C. Viswanathan and N. Ponpandian, Appl. Catal., B, 2023, 339, 123089 CrossRef CAS.
- F. Giraud, C. Geantet, N. Guilhaume, S. Loridant, S. Gros, L. Porcheron, M. Kanniche and D. Bianchi, Catal. Today, 2021, 373, 69 CrossRef CAS.
- B. A. Sexton, A. E. Hughes and K. Foger, J. Catal., 1982, 77, 85–93 CrossRef CAS.
Footnote |
| † Electronic supplementary information (ESI) available. See DOI: https://doi.org/10.1039/d4su00388h |
| This journal is © The Royal Society of Chemistry 2024 |


