 Open Access Article
Creative Commons Attribution 3.0 Unported Licence
Recovery of graphite from industrial lithium-ion battery black mass†
Xiaochu Wei‡
 a,
Zhenyu Guo‡
 a,
Yuanzhu Zhaoa,
Yuqing Sunb,
Anna Hankin
 a and
Magda Titirici
 *ac
*ac
aDepartment of Chemical Engineering, Imperial College London, London SW7 2AZ, UK. E-mail: m.titirici@imperial.ac.uk
bDepartment of Chemistry, Imperial College London, London W12 7TA, UK
cAdvanced Institute for Materials Research (WPI-AIMR), Tohoku University, 2-1-1 Katahira, Aobaku, Sendai, Miyagi 980-8577, Japan
First published on 30th October 2024
Abstract
The escalating production of commercial lithium-ion batteries (LIBs) is anticipated to result in a substantial accumulation of waste upon end-of-life disposal of LIBs, which however also represents a secondary source of raw materials. Among the components of LIBs, graphite anode is a critical material and its production via high-temperature carbonisation is highly energy- and cost-intensive. One of the major challenges regarding recycling of graphite materials from spent LIBs is the presence of residual metal and organic species that are difficult to eliminate, preventing direct reuse as anodes. Here, we propose a recycling workflow to eliminate the various impurities and regenerate the graphite materials from industrially sourced black mass, composed of mixed cathode materials, anode materials, aluminium and copper current collectors, Li salts, and polyvinylidene fluoride binders. After selective extraction of high-value transition metal ions, such as Li, Ni, and Co, from the black mass, the proposed workflow for graphite recovery involves a second step of acid leaching for the removal of Al, Cu, and other residual metal species, and mild-temperature pyrolysis for the removal of polyvinylidene fluoride (PVDF). The regenerated graphite (AG-2.0M-800) demonstrates an initial specific charge capacity of 387.44 mA h g−1 at 0.1C (35 mA g−1) in lithium half cells, on par with commercial battery-grade graphite. This workflow provides a promising approach to the recycling of spent graphite that could be integrated with existing cathode materials' recycling processes developed in the industry.
Sustainability spotlightThe rise of electric vehicles has led to increased production of lithium-ion batteries (LIBs), presenting significant environmental challenges and raw material shortages due to end-of-life battery waste. Graphite recycling is often neglected because of the complexity and cost associated with impurity removal. Our study seeks to enhance the sustainability of the LIB supply chain by reducing the need for energy-intensive graphite production, which typically requires carbonising raw materials at over 2800 °C. We explored various recycling methods to recover graphite from industrial LIB black mass, with a focus on minimising energy costs. This comprehensive recycling strategy addresses a critical gap in the LIB recycling industry and offers a scalable solution adaptable to different compositions of black mass. Integrating this process with existing cathode recycling techniques would result in a comprehensive and eco-friendly solution. This work directly supports the UN Sustainable Development Goals: affordable and clean energy (SDG 7), industry, innovation, and infrastructure (SDG 9), and responsible consumption and production (SDG 12). |
Introduction
In the global transition to net-zero carbon emissions, the electric vehicle revolution is poised to transform the automotive industries,1 driving the global lithium-ion battery (LIB) market to increase tenfold by 2030.2 Consequently, the continuing accumulation of end-of-life LIBs poses a substantial safety and environmental risk arising from the flammable and hazardous organic substances and the inevitable leaching of heavy metals upon improper disposal.3,4 However, spent LIBs represent a valuable secondary source of strategic elements and critical materials, reducing the environmental footprint and improving the sustainability of the LIB supply chain.5,6 Currently, the recycling of LIBs mainly focuses on cathode materials to recover high-value critical materials such as Co, Ni, and Li.7 The recovery of graphite anodes, however, is overlooked and they are subjected to disposal after separating cathode materials from the black mass, mainly due to the difficulty and complexity in the complete removal of residual impurities.8 Graphite anodes account for approximately 20% of the total weight in a battery pack, and the production of graphite by carbonising raw materials such as petroleum coke at temperatures above 2800 °C is energy intensive with the cost reaching up to $15000 per ton.9 Alongside economic benefits, regulatory policy and a strong push towards sustainability and circular economy are other drivers for developing economically viable recovery processes of spent graphite anodes.Several recycling strategies have been reported to recover and regenerate graphite from spent LIBs. Yang et al. used citric acid as the extraction reagent to recover Li and regenerate spent graphite, demonstrating a discharge capacity of 330 mA h g−1 after 80 cycles at 0.5C (1C = 372 mA g−1).2 Wang et al. developed a facile water-treatment method to remove residual Li and the solid electrolyte interphase (SEI) layer, utilising the hydrogen evolution reaction.10 More recently, Chen et al. proposed a flash Joule heating process to decompose residual metal oxides and Li salts and regenerate spent graphite anodes.9 Some alternative methods have also been proposed, such as the subcritical CO2-assisted electrolyte extraction process11 and the froth flotation method.12 However, spent graphite anodes used in most of these studies were the anode coating layer that was manually disassembled and separated from spent LIBs with a surprisingly high initial purity of above 95 wt% before any treatment.2,10,13–15
In the LIB recycling industry, cathode and anode coating layers are recovered as a mixture, referred to as black mass, through the shredding/crushing process, which also brings other cell components such as copper and aluminium current collectors, PVDF binders, and Li salts to the black mass. It remains unclear whether the processes previously reported for graphite recycling would be effective for industrial black mass with a variety of impurities at high quantities. It is highly desirable to develop a graphite anode recycling process that can address this issue and that ideally can be integrated with the existing hydrometallurgical process for cathode material recovery.16–18 This process should also accommodate variations in the composition of black mass, as different cell chemistries from different LIB manufacturers are often mixed together for recycling.
In this study, we employed industrially sourced black mass produced from a combination of three prevailing cell chemistries, namely, lithium manganese oxide (LMO), lithium nickel manganese cobalt oxide (NMC), and lithium iron phosphate (LFP). Graphite content in the black mass was ∼40 wt%, while that of metal was ∼40 wt% and phosphorus and fluorine ∼20 wt%. We explored several methods including physical sieving, acid leaching, calcination, and pyrolysis, both individually and in combination, to provide a comprehensive analysis of their efficiency in removing various metal and organic impurities from spent graphite. Our findings indicated Al and F as primary sources affecting overall purification efficiency, while the remaining metal and phosphorus can be readily eliminated. By integrating acid-leaching with mild-temperature pyrolysis (Scheme 1), high-quality graphite was regenerated with a purity of 99.80% from ∼40% initially. The regenerated graphite exhibited excellent rate performance and electrochemical stability, both comparable or superior to pristine battery-grade graphite.
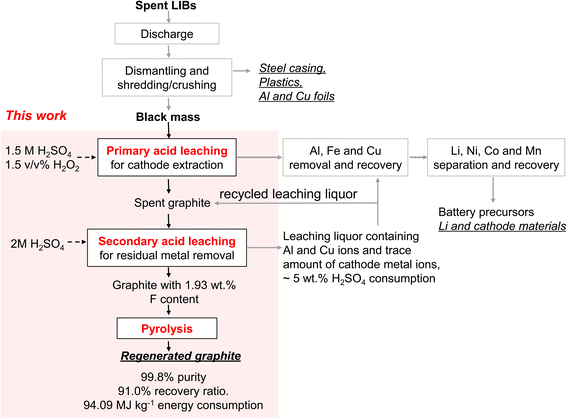 | ||
| Scheme 1 Recycling of LIBs. The workflow for the graphite recovery proposed in this work is highlighted in the red-shaded area. Underscored are potential products to be recovered. | ||
Experimental methods
Pretreatment of industrial black mass via acid leaching
Black mass was provided in-kind by Altilium, UK. The black mass was leached with sulfuric acid (H2SO4) or citric acid, with or without adding H2O2, to extract high-value metals (mainly those in cathode materials). After leaching, the solid residue was filtered, sieved, and dried. The resulting powder was designated as spent graphite. All leaching processes were conducted using a 1.5 M acid concentration with a solid–liquid ratio of 100 g L−1 at 90 °C for 40 minutes, with and without the addition of 1.5% (v/v) H2O2 (30% w/w) as a reducing agent.Recycling of anode materials
For the combination of secondary acid leaching and air calcination, the obtained spent graphite was first subjected to calcination at 500 °C for 1–3 hours in the air to oxidise Cu current collectors and remove binders. Subsequently, both calcined and non-calcined spent graphite samples were subjected to another step of leaching under identical conditions using 1–2 M H2SO4, with a solid-to-liquid ratio of 50 g L−1 at 90 °C for 3 hours, to remove residual metal ions. The resulting acid-leached graphite was filtered, washed, and dried at 120 °C for 12 hours.For the combination of secondary acid leaching and N2 pyrolysis, acid leaching was performed before pyrolysis under the same conditions stated previously, to avoid the undesired graphite consumption due to reactions with the residual cathode at high temperatures. Pyrolysis duration was set at 6 hours for all experiments. After pyrolysis, the samples were washed with deionised water and dried at 120 °C for 12 hours, yielding regenerated graphite.
Structural characterisation
Graphite samples were subjected to microwave digestion (MARS 6, CEM) and digested solutions were analysed by inductively coupled plasma mass spectrometry (ICP-MS 7900, Agilent Technologies) to quantify the composition and percentage of metals in the samples. Thermogravimetry analysis (TGA) was conducted in a TGA800, PerkinElmer and programmed to heat the sample at a rate of 10 °C min−1 up to 1000 °C with a hold time of 45 min. The morphology of the samples was determined by scanning electron microscopy and energy dispersive spectrometry (SEM-EDS; JEOL 6010LA). X-ray diffraction analysis (XRD) was performed using an XRD Panalytical X-Pert with Cu Kα radiation. Raman spectroscopy was carried out using a Renishaw Raman spectrometer with a 532 nm laser. X-ray photoelectron spectroscopy (XPS) was performed using a ThermoFisher X-ray spectrometer with an Al Ka monochromated X-ray source.Electrochemical characterisation
Coin cell components (CR2032), and Li metal foil were purchased from Guangdong Canrd New Energy Technology Co., Ltd. The electrolyte 1.0 M LiPF6 in ethylene carbonate (EC) and dimethyl carbonate (DMC) electrolyte, sodium carboxymethyl cellulose binder (CMC, Mw ≈ 250![[thin space (1/6-em)]](https://www.rsc.org/images/entities/char_2009.gif) 000) and Whatman GF/A glass microfiber were purchased from Sigma Aldrich. All chemicals were used as received without further purification.
000) and Whatman GF/A glass microfiber were purchased from Sigma Aldrich. All chemicals were used as received without further purification.
All the slurries including commercial graphite, spent graphite, acid-leached graphite, and regenerated graphite were prepared by mixing 90 wt% graphite powder with 10 wt% sodium carboxymethyl cellulose (Mw ≈ 250![[thin space (1/6-em)]](https://www.rsc.org/images/entities/char_2009.gif) 000) binder solution (5 wt% in deionized water). The slurries were well-mixed in a centrifugal mixer (Thinky, ARE-250 CE) for 10 min at 2000 rpm. The electrodes were then coated from slurries onto battery-grade Cu foil (9 μm in thickness). The coated electrodes were dried at room temperature for 6 hours followed by vacuum drying for 18 hours. The 1.0 cm circular electrodes were cut with mass loading ranging from 2.5 to 3.0 mg cm−2. Coin cells were then assembled inside a glovebox (H2O < 0.5 ppm, O2 < 0.5 ppm) against Li metal 12 mm in diameter. The Whatman GF/A glass microfiber separator was saturated with 100 μL of 1 M LiPF6 (EC/DMC, 1
000) binder solution (5 wt% in deionized water). The slurries were well-mixed in a centrifugal mixer (Thinky, ARE-250 CE) for 10 min at 2000 rpm. The electrodes were then coated from slurries onto battery-grade Cu foil (9 μm in thickness). The coated electrodes were dried at room temperature for 6 hours followed by vacuum drying for 18 hours. The 1.0 cm circular electrodes were cut with mass loading ranging from 2.5 to 3.0 mg cm−2. Coin cells were then assembled inside a glovebox (H2O < 0.5 ppm, O2 < 0.5 ppm) against Li metal 12 mm in diameter. The Whatman GF/A glass microfiber separator was saturated with 100 μL of 1 M LiPF6 (EC/DMC, 1![[thin space (1/6-em)]](https://www.rsc.org/images/entities/char_2009.gif) :
:![[thin space (1/6-em)]](https://www.rsc.org/images/entities/char_2009.gif) 1 by vol). Three independent cells were tested to confirm the reproducibility.
1 by vol). Three independent cells were tested to confirm the reproducibility.
Results and discussion
Separation of spent graphite from black mass
Due to the lack of material separation in the shredding/crushing process, black mass produced in the recycling industry normally contains significant amounts of Al and Cu current collectors and organic materials, alongside cathode and anode materials. We sourced black mass from the industry, and this black mass was produced mainly from LMO and NMC cell chemistries with a minor proportion of LFP. High-value metals, including Li, Co, Ni and Mn, constituted 26.7% of the total weight of the black mass, while Al and Cu current collectors contributed 12.8 wt%, as quantified by ICP-MS (Tables 1, S1 and S2†). The F content of 17.94%, as calculated from the XPS spectrum (Fig. S1†), can be attributed to PVDF binders and lithium hexafluorophosphate salt, LiPF6.| Composition (wt%) | |||||||||
|---|---|---|---|---|---|---|---|---|---|
| Li | Co | Ni | Mn | Fe | P | Al | Cu | F | |
| Black mass | 2.53 | 1.78 | 6.43 | 15.95 | 0.57 | 1.34 | 4.79 | 8.08 | 17.94 |
| Spent graphite | 0.24 | 0.08 | 0.13 | 0.11 | 0.60 | 0.95 | 5.51 | 1.44 | 7.51 |
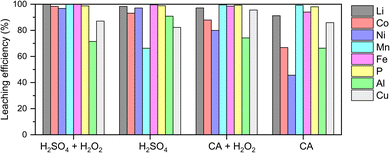
Prior to graphite recovery, we conducted acid leaching to extract high-value metals from the black mass using H2SO4 and organic citric acid (Fig. 1). This leaching process can be described as occurring in two distinct stages: an initial rapid phase, governed by solution pH and temperature, with limited influence from redox reactions, followed by a slower second stage driven by electrochemical processes and surface-controlled dissolution.19 The dissolution of transition metal oxides during the second stage is inherently a reduction reaction, and therefore requires the presence of a reductant. Fe, Cu and Al, which are already present in the raw material, could act as reductants due to their lower redox potential than transition metal oxides (Tables S3 and S4,† reaction mechanisms are described using eqn S1–S7†).20–23 Nevertheless, excess dissolution of Cu and Al into the leach liquor significantly reduces the efficiency of subsequent steps for separating and recovering Co, Ni, and Mn (not explored in this work, Scheme 1).24 Hence, we added a small volume of H2O2 (1.5 vol%) as a competing reducing agent21,23 (eqn S3†) and achieved the highest extraction efficiency of cathode materials, particularly Li, Co, and Ni, while decreasing the dissolution of Al and Cu, under the condition of 1.5 M H2SO4 with 1.5 vol% H2O2.
Residual solids obtained after the optimised acid leaching were dried and sieved to remove large pieces of plastics and undissolved Al and Cu foils, yielding an underflow fraction of ≤125 μm. The resulting solids, composed primarily of graphite, were designated as spent graphite for further experiments in this study. The composition and morphology of spent graphite were characterised using ICP-MS, XPS, and SEM. F, Al and Cu became the major impurities in spent graphite with a weight percentage of 7.51, 5.51, and 1.44 wt%, respectively, where Al existed in both metallic and oxide forms (Table 1 and Fig. 2). The weight percentage of Li, Co, Ni, and Mn was below 0.3 wt% (Table 1 and Fig. S2†), substantiating the efficacy of acid leaching regarding the extraction of cathode materials.
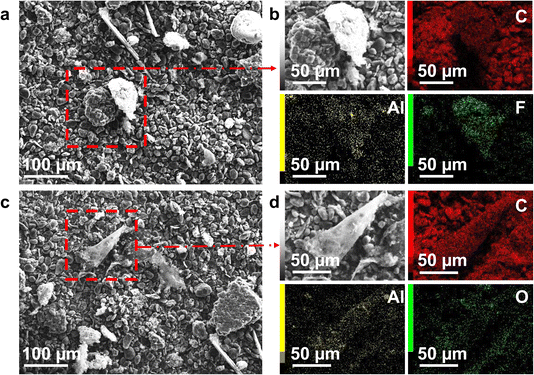 | ||
| Fig. 2 SEM images of spent graphite anodes. (a and b) SEM-EDS mapping of Al foils detected in graphite. (c and d) SEM-EDS mapping of Al2O3 particles detected in graphite. | ||
Secondary acid leaching for residual metal removal
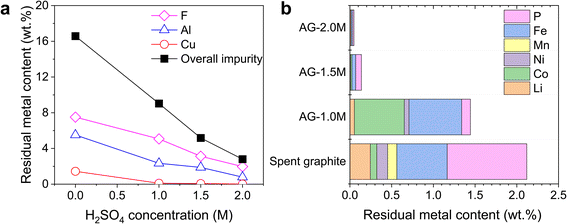
An additional step of acid leaching is required to remove residual metals from spent graphite. This serves a different purpose from the previous acid-leading step, which aims at the selective extraction of metals from cathode materials. Generally, acid concentration, temperature, reaction time, and solid-to-liquid ratios are critical factors influencing the efficiency of metal removal. Among these parameters, we focused on the investigation of acid concentration, as it is the most important factor that has a direct impact on the dissolution rates.Fig. 3 shows the weight percent of remaining impurities in spent graphite as a function of acid concentration, with samples designated as AG-X, where X represents H2SO4 concentrations. Higher removal efficiencies were achieved for all impurities on increasing acid concentration, showing the lowest overall impurity content of 0.8 wt% in AG-2.0M, in contrast to 9.04 wt% before acid leaching. Metals from cathode materials (i.e., Li, Co, Ni, and Mn) and Cu were eliminated nearly in full at a H2SO4 concentration higher than 1.5 M, while Al, Fe and P required a concentration of 2 M. Al remained as a major impurity under all conditions with the predominance of Al2O3 versus metallic Al as detected in SEM-EDS (Fig. S3†). The standard reduction potential (E0) of metallic Al (−1.66 V versus the standard hydrogen electrode) indicates a strong thermodynamic affinity for electron donation and oxidation and the redox reaction with protons readily produces Al3+ and hydrogen gas. In contrast, the chemical dissolution of Al2O3 poses significant challenges due to the passivating layer that acts as a protective barrier, thereby hindering further leaching processes.25 Therefore, the rate-limiting step of Al removal is not the electrochemical dissolution of Al to Al3+, but rather the chemical dissolution of Al2O3 to Al3+. More aggressive leaching at higher acid concentrations may further reduce the content of metal impurities by breaking down the complex compounds. However, higher acid concentrations were not explored due to the safety considerations and higher costs associated with the procurement, storage, handling and disposal of concentrated acids, especially under the setting of potential industrial applications at large scale.
To underscore the necessity of employing a two-step leaching process, with primary leaching for cathode extraction and secondary leaching for residual metal removal, a control experiment of one-step leaching was conducted. Using a 2 M acid concentration, a solid–liquid ratio of 50 g L−1 at 90 °C, and 1.5% (v/v) H2O2 (30% w/w), the results from ICP-MS (Table S5†) revealed a residual impurity content of ∼5 wt% in all solids. This confirms that one-step leaching is inadequate for complete graphite purification. With an acid consumption of only ∼5% per cycle, the leaching liquor from the secondary acid leaching stage could be potentially recycled until the concentrations of metal ions reach sufficient levels (Scheme 1), enabling higher metal recovery and lower energy cost.
Calcination and pyrolysis for PVDF removal
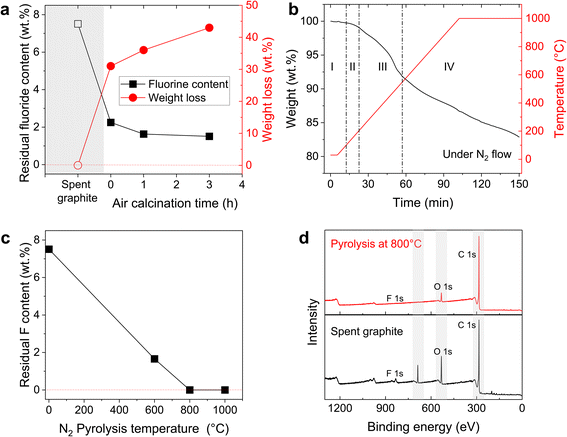
Previous studies on graphite recovery often overlook the challenge of removing PVDF binders, which are inevitably introduced into the black mass during the shredding and crushing process. While acid leaching is effective for metal removal, it proves inadequate for PVDF removal, leaving a fluorine content of 2.25 and 1.97 wt% in AG-1.5M and AG-2.0M, respectively (Fig. S4†). Air calcination is widely used in LIB cathode recycling to thermally decompose PVDF, which has an onset decomposition temperature of around 380 °C.26–28 As temperatures greater than 600 °C lead to rapid combustion of graphite,15,28 we chose an air calcination temperature of 500 °C. After 1 h of air calcination, followed by secondary acid leaching using 1.5 M H2SO4, F content decreased to 1.51 wt% (Fig. 4a). Prolonging the calcination time to 3 h resulted in a further decreased F content of 1.38 wt% accompanied by an additional weight loss of 7 wt%. We attribute the weight loss to the incomplete combustion of graphite, which commences at temperatures above 400 °C and produces CO and CO2.29 While air calcination can decompose a certain amount of PVDF, the undesired graphite oxidation and combustion render this method less practical for graphite recovery (Fig. 4a). Furthermore, Fig. S5 and S6† indicate that calcination has limited efficacy on the removal of other impurities.Pyrolysis, akin to calcination but under inert gas, can concurrently fulfil the requirements of thermal decomposition of PVDF and preservation of the structural integrity of graphite, while also providing opportunities to repair structural defects in spent graphite. Thermal gravimetric analysis (TGA) of black mass reveals distinct degradation stages during pyrolysis in Fig. 4b.30 During the initial stages (I and II) below 200 °C, moisture evaporation and the decomposition of organic species occur. In stage III, PVDF undergoes rapid thermal decomposition between 450 and 550 °C, with maximum weight loss at 500 °C. Above 500 °C, decomposition releases various fluorinated compounds,31 and also involves hydrogen fluoride release and polymer chain scission.32 At stage IV, the weight loss can be attributed to the reduction reaction of residue metal oxides with graphite, Al and F, producing simpler metal oxides, metals and LiF.33 We note that pyrolysis in the presence of reducing agents (such as Al and graphite) is widely deployed in the pyrometallurgical process for LIB recycling to extract Cu, Ni, and Co as metal alloys.34 These findings emphasise the necessity to eliminate residual metal oxides from the black mass prior to the thermal treatment, in order to prevent graphite loss and ensure the complete removal of fluorine.
To evaluate the efficiency of F removal, we performed pyrolysis at 600, 800, and 1000 °C under a N2 atmosphere (Fig. 4c, d, S7 and S8†). Complete F removal requires a pyrolysis temperature of at least 800 °C, while extending the temperature further doesn't necessarily improve the purity of graphite. Thus, 800 °C was identified as the optimal temperature for the pyrolysis process to eliminate F compounds and repair degraded graphite by eliminating oxygen groups from the graphite surface. After pyrolysis, graphite samples were washed, ground, and sieved, yielding an overall 91.0% recovery, accounting for both the secondary acid leaching and pyrolysis steps. The weight loss for AG-1.5M-800 and AG-2.0M-800 samples before and after sieving was negligible (∼2 wt%).
Characterisation of regenerated graphite
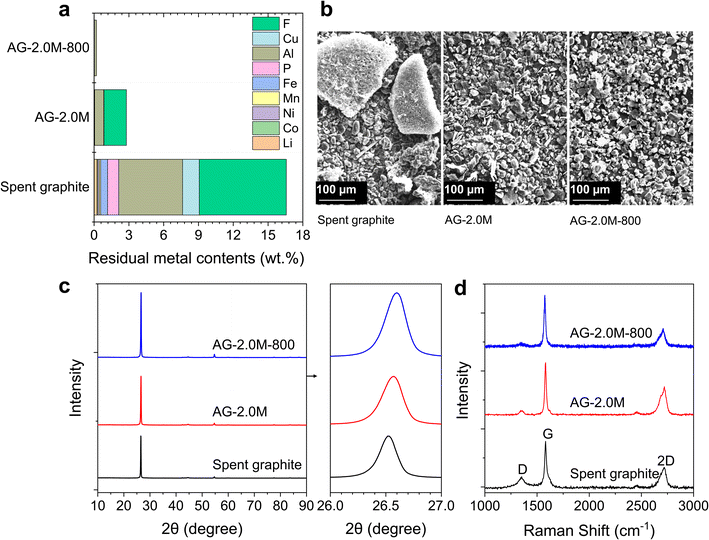
The regenerated samples (AG-1.5M-800 and AG-2.0M-800), acid-leached spent graphite (AG-1.5M and AG-2.0M) and the original spent graphite were thoroughly characterised to compare their composition, morphology, and microstructure. Chemical compositions are summarised in Fig. 5a and S8.† AG-2.0M-800 demonstrates a high graphite purity of 99.80 wt%. Despite Al being the predominant impurity across all samples, its concentration has markedly decreased from 5.51 wt% in spent graphite to less than 0.17 wt% in AG-2.0M-800. Large aggregates were found in spent graphite due to the presence of residual binders (Fig. 5b). The degree of agglomeration is significantly reduced in AG-2.0M and AG-2.0M-800 (Fig. 5b and S9†), showing an average particle size below 30 μm with a certain distribution. This explains the negligible loss of graphite after sieving (sieve size 45 μm). Graphite particle size is a critical factor in the processes of ink preparation and anode electrode manufacturing, with a preferred size in the range of 8 to 30 μm, where our regenerated graphite falls within.35The microstructure of these graphite samples was analysed using XRD, Raman spectroscopy and XPS as shown in Fig. S9–S12,† 5c, d and 6. All graphite samples, including spent graphite, exhibited a characteristic diffraction peak at 2θ = 26.5°, corresponding to the (002) crystal plane, without any noticeable impurity peak. This suggests the structural stability and resilience of graphite towards long-term cycling and recycling processes, laying the foundation of graphite recycling and reuse. The (002) peak shifted slightly from 26.52° for spent graphite to 26.55° for AG-2.0M and further 26.56° for AG-2.0M-800, equivalent to an interlayer distance (d002) of 0.3359, 0.3355, and 0.3350 nm, respectively, based on the Bragg equation 2d![[thin space (1/6-em)]](https://www.rsc.org/images/entities/char_2009.gif) sin
sin![[thin space (1/6-em)]](https://www.rsc.org/images/entities/char_2009.gif) θ = nλ. The larger d002 in spent graphite originates from the structural changes (and potential degradation) due to the repeated intercalation/deintercalation of Li ions during battery cycling.36 The reduced d002 in AG-2.0M-800 highlights the added benefit of the pyrolysis step in restoring the interlayer spacing of spent graphite, in addition to F removal.
θ = nλ. The larger d002 in spent graphite originates from the structural changes (and potential degradation) due to the repeated intercalation/deintercalation of Li ions during battery cycling.36 The reduced d002 in AG-2.0M-800 highlights the added benefit of the pyrolysis step in restoring the interlayer spacing of spent graphite, in addition to F removal.
Three distinct characteristic peaks were observed in the Raman spectra of all samples at 1350, 1580, and 2720 cm−1, corresponding to D, G and 2D bands, respectively. The D band is associated with defects and disorder in the graphite lattice, while the G band corresponds to the degree of graphitisation and crystallinity. Therefore, the ratio of the intensity of the D peak (ID) to that of the G peak (IG) represents the defect density in the graphite structure.9 As expected, spent graphite exhibited the highest ID/IG ratio of 0.24 and AG-2.0M-800 the lowest of 0.09, in line with the results of XRD.
XPS spectra in Fig. S1 and S3† show that C and O are the primary components in all graphite samples, with characteristic peaks around 285 and 532 eV, respectively. According to the high-resolution XPS spectra (Fig. 6), the C 1s peaks can be deconvoluted into five components: sp2 C (284.8 eV), sp3 C (285.89 eV), C–O (286.51 eV), C![[double bond, length as m-dash]](https://www.rsc.org/images/entities/char_e001.gif) O (288.01 eV), and C–F or π–π* transition (290.89 eV).37 Of note, the component at 290.89 eV can be attributed to both C–F and electron excitation from the π bonding orbital to the π* antibonding orbital, as documented in the literature and observed previously in pristine graphite.38–40 The substantial reduction in the components of C–O, C
O (288.01 eV), and C–F or π–π* transition (290.89 eV).37 Of note, the component at 290.89 eV can be attributed to both C–F and electron excitation from the π bonding orbital to the π* antibonding orbital, as documented in the literature and observed previously in pristine graphite.38–40 The substantial reduction in the components of C–O, C![[double bond, length as m-dash]](https://www.rsc.org/images/entities/char_e001.gif) O, and C–F for AG-2.0M-800, relative to spent graphite and AG-2.0M, is in agreement with results from XRD and Raman spectra. The components at 532.49 and 533.33 eV in O 1s spectra correspond to C
O, and C–F for AG-2.0M-800, relative to spent graphite and AG-2.0M, is in agreement with results from XRD and Raman spectra. The components at 532.49 and 533.33 eV in O 1s spectra correspond to C![[double bond, length as m-dash]](https://www.rsc.org/images/entities/char_e001.gif) O and C–O bonds, respectively. Peak areas for C–O and C
O and C–O bonds, respectively. Peak areas for C–O and C![[double bond, length as m-dash]](https://www.rsc.org/images/entities/char_e001.gif) O are the highest in spent graphite among all the samples, particularly for the C
O are the highest in spent graphite among all the samples, particularly for the C![[double bond, length as m-dash]](https://www.rsc.org/images/entities/char_e001.gif) O peak, indicating a high concentration of oxygen-containing functional groups in spent graphite. Analysis of C 1s and O 1s in XPS spectra confirms that pyrolysis under N2 can effectively remove F and oxygen elements from the graphite materials.41,42
O peak, indicating a high concentration of oxygen-containing functional groups in spent graphite. Analysis of C 1s and O 1s in XPS spectra confirms that pyrolysis under N2 can effectively remove F and oxygen elements from the graphite materials.41,42
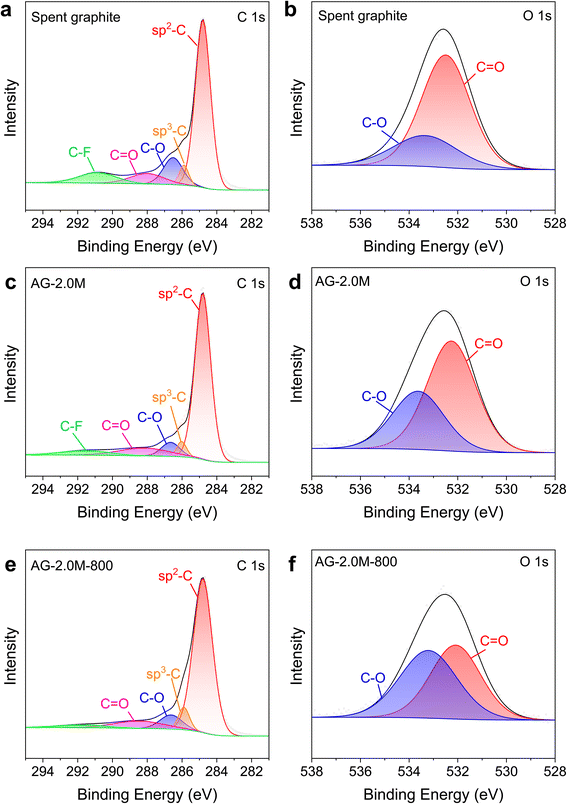 | ||
| Fig. 6 High-magnification XPS spectra for C 1s and O 1s. (a and b) Spent graphite. (c and d) AG-2.0M. (e and f) AG-2.0M-800. | ||
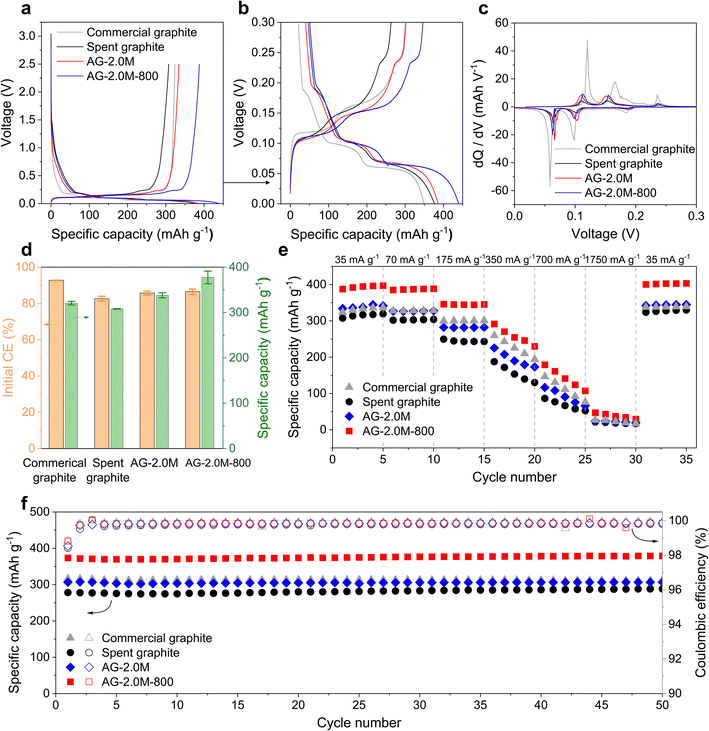
In the first charge–discharge cycles (Fig. 7a and S13a†), the initial voltage drops from the open circuit voltage to approximately 1.5 V are consistent across all samples, indicating similar initial reactions including electric double layer, polarisation, and charge accumulation in the batteries. The most notable difference lies in the sloping region from approximately 1.5 V to about 0.2 V, where Li ions are adsorbed mainly by the defects, functional groups, and porous surfaces of graphite.43 Commercial graphite exhibits the smallest sloping capacity, in agreement with the lower ID/IG ratio in the Raman spectrum. By contrast, all recycled graphite samples show higher sloping capacities due to their more defective structures. This increased sloping capacity results in higher irreversibility as solid electrolyte interphase (SEI) forms during the first cycles, thereby lowering the initial coulombic efficiency (CE).44
To elucidate the lithiation process, differential capacity plots (dQ/dV) were derived for the plateau region between 0 and 0.3 V (Fig. 7b and c). Commercial graphite exhibited three prominent peaks at 0.18, 0.1, and 0.06 V, corresponding to the formation of different lithium intercalation compounds (LiCx, x = 1–6), respectively.45 These peaks showed lower intensities for cells assembled with regenerated graphite and became faint for that with spent graphite. The reduced intensities are associated with the presence of defects and mixed surface chemistry, while pristine graphite exhibits a highly crystalline structure with a fixed d-spacing that provides consistent energy to Li ions.
In rate tests, AG-2.0M-800 exhibited the highest specific capacity among all samples and an initial discharge capacity of 387.44 mA h g−1 at a current of 0.1C (35 mA g−1), slightly higher than the theoretical capacity of graphite (372 mA h g−1). We attribute this to the high purity and presence of defects in AG-2.0M-800, allowing additional Li ion storage, as supported by results previously reported in the literature.4,15,36 In long cycling tests performed following the rate test for the same cells, AG-2.0M-800 demonstrated an initial specific charge capacity of 373.45 mA h g−1 at 0.5C (175 mA g−1) and no apparent capacity decay (Fig. 7f). Overall, these electrochemical analyses indicate that the rate capability and cycling stability of AG-2.0M-800 are comparable or superior to those of commercial graphite, confirming its viability for reuse as an anode material in LIBs.
Conclusion
In summary, this study presents a streamlined process for recycling spent graphite from industrial black mass. The optimised recycling workflow comprises a primary acid leaching step, a secondary acid leaching step, and final mild-temperature pyrolysis, under the following operating conditions:(1) Initial acid leaching: a mixture of H2SO4 (1.5 M) and H2O2 (1.5 v/v%), a temperature of 90 °C, a solid–liquid ratio of 100 g L−1, and a leaching duration of 40 min.
(2) Secondary acid leaching: H2SO4 (2 M), a temperature of 90 °C, solid–liquid ratio of 50 g L−1, and leaching duration of 3 hours.
(3) Pyrolysis: temperature of 800 °C under N2 over 6 hours.
In the primary acid leaching stage, we optimised the leaching conditions by utilising self-contained Al, Cu, and LFP as reductants to maximise metal extraction from cathode materials. Following this, a secondary acid leaching process was conducted with a higher acid concentration and prolonged reaction time to remove residual impurities, particularly Al2O3. The acid leaching processes effectively minimised the levels of cathode materials and F content, preventing unnecessary graphite loss from reduction reactions of residual cathode materials during pyrolysis. Pyrolysis is beneficial not only for the complete removal of PVDF binders but also for repairing the structural defects in spent graphite, with the mild temperature minimising the operational costs. The overall purity of regenerated graphite reached 99.8% with a total recovery ratio of 91% as summarised in Scheme 1. The graphite loss is primarily due to size sieving and transferring at each step, with further optimisation being possible during the scale-up process.
Despite only partial recovery of structural crystallinity and slightly lower coulombic efficiency, graphite recycled from this workflow demonstrated high specific charge capacity and high capacity retention during long cycling, both superior to pristine battery-grade graphite. A preliminary economic analysis was conducted to compare the proposed recycling method with the conventional coal-based synthetic method for producing 1 kg of battery-grade graphite. We estimated the total inputs and outputs, including energy, water, and materials, for each stage of the proposed process, as outlined in Table S6 and Fig. S14.†9 The proposed recycling method resulted in significant reductions in energy and water consumption, achieving 75% and 81% savings, respectively, compared to graphite production from coal.9 These improvements are primarily attributed to the elimination of the mining and refining steps, responsible for approximately 81% of the total energy and water usage in conventional methods. Importantly, the workflow can integrate with existing facilities and cathode recycling processes, offering opportunities for the recycling of all critical materials from spent LIBs with minimal adjustments.
Data availability
The authors confirm that the data supporting the findings of this study are available within the article and its ESI.† Raw data that support the findings of this study are available in figshare at https://figshare.com/s/90994df100eb2c7aaf7f.Author contributions
XW: conceptualisation, methodology, data curation, validation, writing and review. ZG: battery tests, battery data analysis, XPS and Raman tests, and review. YZ: battery tests and battery data analysis. YS: ICP-MS measurement. AH: supervision, resources and review. MT: supervision, resources, funding acquisition and review.Conflicts of interest
The authors declare no conflict of interest.Acknowledgements
We thank Altilium for providing the black mass. XW, AH and MT gratefully acknowledge funding from Innovate UK (CAMEV 10048761).References
- G. Harper, R. Sommerville, E. Kendrick, L. Driscoll, P. Slater, R. Stolkin, A. Walton, P. Christensen, O. Heidrich, S. Lambert, A. Abbott, K. Ryder, L. Gaines and P. Anderson, Nature, 2019, 575, 75–86 CrossRef CAS PubMed.
- J. Yang, E. Fan, J. Lin, F. Arshad, X. Zhang, H. Wang, F. Wu, R. Chen and L. Li, ACS Appl. Energy Mater., 2021, 4, 6261–6268 CrossRef CAS.
- J. Wu, M. Zheng, T. Liu, Y. Wang, Y. Liu, J. Nai, L. Zhang, S. Zhang and X. Tao, Energy Storage Mater., 2023, 54, 120–134 CrossRef CAS.
- S. Ji, A. Zhang, W. Hua, S. Yan and X. Chen, Battery Energy, 2024, 3, 20230067 CrossRef.
- Lithium-ion Battery Market Size, Share & Growth Report, 2030, https://www.grandviewresearch.com/industry-analysis/lithium-ion-battery-market?gad_source=1%26gclid=Cj0KCQjww5u2BhDeARIsALBuLnPc-hSsVO9vO-i2KJtF2elpRgwhGtUo7jRVrs3VVipF61ZddTDgOXkaAgEFEALw_wcB, (accessed 28 June 2024).
- B. K. Sovacool, Extr. Ind. Soc., 2019, 6, 915–939 Search PubMed.
- M. Olutogun, A. Vanderbruggen, C. Frey, M. Rudolph, D. Bresser and S. Passerini, Carbon Energy, 2024, 6, e483 CrossRef CAS.
- B. Markey, M. Zhang, I. Robb, P. Xu, H. Gao, D. Zhang, J. Holoubek, D. Xia, Y. Zhao, J. Guo, M. Cai, Y. S. Meng and Z. Chen, J. Electrochem. Soc., 2020, 167, 160511 CrossRef CAS.
- W. Chen, R. V. Salvatierra, J. T. Li, C. Kittrell, J. L. Beckham, K. M. Wyss, N. La, P. E. Savas, C. Ge, P. A. Advincula, P. Scotland, L. Eddy, B. Deng, Z. Yuan and J. M. Tour, Adv. Mater., 2023, 35, 2207303 CrossRef CAS PubMed.
- H. Wang, Y. Huang, C. Huang, X. Wang, K. Wang, H. Chen, S. Liu, Y. Wu, K. Xu and W. Li, Electrochim. Acta, 2019, 313, 423–431 CrossRef CAS.
- S. Rothermel, M. Evertz, J. Kasnatscheew, X. Qi, M. Grützke, M. Winter and S. Nowak, ChemSusChem, 2016, 9, 3473–3484 CrossRef CAS PubMed.
- J. Liu, H. Wang, T. Hu, X. Bai, S. Wang, W. Xie, J. Hao and Y. He, Miner. Eng., 2020, 148, 106223 CrossRef CAS.
- L. Barbosa, F. Luna-Lama, Y. González Peña and A. Caballero, ChemSusChem, 2020, 13, 838–849 CrossRef CAS PubMed.
- J. Zhang, J. Hu, Y. Liu, Q. Jing, C. Yang, Y. Chen and C. Wang, ACS Sustainable Chem. Eng., 2019, 7, 5626–5631 CrossRef CAS.
- X. Ma, M. Chen, B. Chen, Z. Meng and Y. Wang, ACS Sustainable Chem. Eng., 2019, 7, 19732–19738 CrossRef CAS.
- I. Rey, C. Vallejo, G. Santiago, M. Iturrondobeitia and E. Lizundia, ACS Sustainable Chem. Eng., 2021, 9, 14488–14501 CrossRef CAS.
- A. Chernyaev, A. Kobets, K. Liivand, F. Tesfaye, P. M. Hannula, T. Kallio, L. Hupa and M. Lundström, Miner. Eng., 2024, 208, 108587 CrossRef CAS.
- S. Natarajan and V. Aravindan, Adv. Energy Mater., 2020, 10, 2002238 CrossRef CAS.
- M. Joulié, E. Billy, R. Laucournet and D. Meyer, Hydrometallurgy, 2017, 169, 426–432 CrossRef.
- A. Porvali, A. Chernyaev, S. Shukla and M. Lundström, Sep. Purif. Technol., 2020, 236, 116305 CrossRef CAS.
- A. Chernyaev, J. Partinen, L. Klemettinen, B. P. Wilson, A. Jokilaakso and M. Lundström, Hydrometallurgy, 2021, 203, 105608 CrossRef CAS.
- A. Chernyaev, Y. Zou, B. P. Wilson and M. Lundström, Sep. Purif. Technol., 2022, 281, 119903 CrossRef CAS.
- Y. Zou, A. Chernyaev, M. Ossama, S. Seisko and M. Lundström, Sci. Rep., 2024, 14, 1–14 CrossRef CAS PubMed.
- R. Zhang, Z. Meng, X. Ma, M. Chen, B. Chen, Y. Zheng, Z. Yao, P. Vanaphuti, S. Bong, Z. Yang and Y. Wang, Nano Energy, 2020, 78, 105214 CrossRef CAS.
- S. Shukla, A. Chernyaev, P. Halli, J. Aromaa and M. Lundström, Metals, 2023, 13, 1118 CrossRef CAS.
- Y. Shin, S. Kim, S. Park, J. Lee, J. Bae, D. Kim, H. Joo, S. Ban, H. Lee, Y. Kim and K. Kwon, Renewable Sustainable Energy Rev., 2023, 187, 113693 CrossRef CAS.
- N. Zhang, Z. Xu, W. Deng and X. Wang, Electrochem. Energy Rev., 2022, 5, 1–38 Search PubMed.
- S. Kim, J. Bang, J. Yoo, Y. Shin, J. Bae, J. Jeong, K. Kim, P. Dong and K. Kwon, J. Cleaner Prod., 2021, 294, 126329 CrossRef CAS.
- X. Luo, J.-C. Robin and S. Yu, Nucl. Eng. Des., 2004, 227, 273–280 CrossRef CAS.
- L. A. Gomez-Moreno, A. Klemettinen and R. Serna-Guerrero, iScience, 2023, 26, 107782 CrossRef CAS PubMed.
- S. S. Choi and Y. K. Kim, J. Anal. Appl. Pyrolysis, 2012, 96, 16–23 CrossRef CAS.
- G. Zhang, Y. He, Y. Feng, H. Wang and X. Zhu, ACS Sustainable Chem. Eng., 2018, 6, 10896–10904 CrossRef CAS.
- S. Babanejad, H. Ahmed, C. Andersson, C. Samuelsson, A. Lennartsson, B. Hall and L. Arnerlöf, J. Sustain. Met., 2022, 8, 566–581 CrossRef.
- M. Chen, X. Ma, B. Chen, R. Arsenault, P. Karlson, N. Simon and Y. Wang, Joule, 2019, 3, 2622–2646 CrossRef CAS.
- J. Asenbauer, T. Eisenmann, M. Kuenzel, A. Kazzazi, Z. Chen and D. Bresser, Sustainable Energy Fuels, 2020, 4, 5387–5416 RSC.
- R. Li, S. Zeng, L. Wang, X. Yu, H. Zeng, W. Liu, D. Fu and X. Liu, J. Alloys Compd., 2024, 993, 174691 CrossRef CAS.
- J. Yu, M. Lin, Q. Tan and J. Li, J. Hazard. Mater., 2021, 401, 123715 CrossRef CAS PubMed.
- X. Li, J. Shen, C. Wu and K. Wu, Small, 2019, 15, 1805567 CrossRef CAS PubMed.
- Q. Xu, Q. Wang, D. Chen, Y. Zhong, Z. Wu, Y. Song, G. Wang, Y. Liu, B. Zhong and X. Guo, Green Chem., 2021, 23, 4531–4539 RSC.
- X. Yang, R. Li, J. Yang, H. Liu, T. Luo, X. Wang and L. Yang, Carbon, 2022, 199, 215–223 CrossRef CAS.
- Y. H. Xiao, J. Li, W. G. Huang, L. H. Wang and J. Luo, J. Mater. Sci.: Mater. Electron., 2022, 33, 16740–16752 CrossRef CAS.
- S. Xu, C. Liu, F. Ye, Y. Guo and J. Wiezorek, Colloids Surf., A, 2017, 515, 1–11 CrossRef CAS.
- L. Zhao, B. Ding, X.-Y. Qin, Z. Wang, W. Lv, Y.-B. He, Q.-H. Yang, F. Kang and L. Zhao, Adv. Mater., 2022, 34, 2106704 CrossRef CAS PubMed.
- T. Placke, V. Siozios, R. Schmitz, S. F. Lux, P. Bieker, C. Colle, H. W. Meyer, S. Passerini and M. Winter, J. Power Sources, 2012, 200, 83–91 CrossRef CAS.
- H. Fujimoto, H. Kiuchi, S. Takagi, K. Shimoda, K. Okazaki, Z. Ogumi and T. Abe, J. Electrochem. Soc., 2021, 168, 040509 CrossRef CAS.
Footnotes |
| † Electronic supplementary information (ESI) available. See DOI: https://doi.org/10.1039/d4su00427b |
| ‡ These authors contributed equally. |
| This journal is © The Royal Society of Chemistry 2024 |

