 Open Access Article
Reduction of CO2 captured in basic solutions with biomass as reducing agent and metallic catalysts†
Maira I. Chinchillaab,
Ángel Martínab,
J. McGregor c,
Fidel A. Matoab and
María D. Bermejo
 *ab
*ab
aResearch Institute on Bioeconomy – BioEcoUVa, PressTech Group, Universidad de Valladolid, Dr Mergelina s/n., Valladolid, 47011, Spain. E-mail: mariadolores.bermejo@uva.es
bDepartment of Chemical Engineering and Environmental Technology, Universidad de Valladolid, Dr Mergelina s/n., Valladolid, 47011, Spain
cSchool of Chemical, Materials and Biological Engineering, University of Sheffield, Sheffield S1 3JD, UK
First published on 21st November 2024
Abstract
CO2 capture and utilization technologies can make an important contribution to the decarbonization of industry. However, capture processes entail significant economic and energy costs, mainly associated with the purification, compression and transport of CO2. These costs would be reduced if captured CO2 could be transformed in situ into useful products, avoiding purification, compression and transport costs. This work presents a hydrothermal process in which CO2 absorbed in aqueous solutions as bicarbonate is reduced with biomass waste to give formic acid as a joint product of the biomass and CO2 transformation, and acetic and lactic acids as byproducts from the decomposition of the biomass. Several biomass materials are applied as reductants: softwood, sugarcane bagasse, sugar beet, cork, pine needles, vermicompost and pure cellulose as reference material. Moreover, different catalysts are tested to improve conversion yield: Pd(5%)/C and Pd(10%)/C, Ru(5%)/C and activated carbon. The best results (18% formic acid yield) are obtained using pure cellulose as biomass and Pd(5%)/C catalyst. The next best results are obtained with the biomasses with the highest cellulose content, such as wood (11%) and sugarcane bagasse (9%). Experiments performed with labelled H13CO3− as carbon source at 300 °C using the Pd(5%)/C catalyst demonstrate that over 70% of the produced formic acid is formed from the inorganic bicarbonate carbon source. These high yields of conversion using renewable biomass as reductant can contribute to improve the technical and economic feasibility of CO2 capture technology.
Sustainability spotlightCurrently there is great effort in reducing CO2 emissions, but the cost of capturing and storage is very high. Developing technologies for producing useful chemicals and fuels from CO2 will contribute to reduce their cost. In the present work a technology for simultaneously transforming CO2 and biomass waste in formic acid and other organic waste. The main advantage of this technology is that can be directly coupled with absorption of CO2 with NaOH and the effluent of the absorber can be taken directly to the reactor, avoiding purification, compression and transport of CO2 that are the most expensive and energy consuming. It is aligned with several UN SDG, but more clearly with the 13th: climate actions. |
1. Introduction
Nowadays many efforts are being made to limit the increase in global temperature. In the last three decades, the emission of greenhouse gases has increased by 43%, with 65% of this being emissions of CO2. To reduce the emission rates of CO2 into the atmosphere, research and innovation is being targeted at the development of new technologies promoting the conversion and utilization of this compound.1–5The utilization of CO2 has aroused great interest since this compound can be used as raw material for manufacturing products of high value for industry such as formic acid, ethylene, ethanol, etc.,3,6–9 thus providing an economic revenue to compensate the capture costs and, in a longer term, a sustainable alternative to the current fossil-fuel based organic chemical industry. CO2 can be directly used in carbonatation processes, or it can be converted to other compounds by means of electrochemical reduction, photoreduction or reduction with H2, among other alternatives. However, the high thermodynamic stability of the CO2 molecule must be overcome to obtain high conversion rates.10–14
Hydrothermal reduction has been considered as an alternative for the conversion of CO2 because of the peculiar properties of water at high temperature and pressure, such as low dielectric constant, density and viscosity. Water at temperatures near 300 °C and pressures high enough to maintain it in the liquid state is characterized by a high ionic product and therefore a high concentration of H+ and HO− ions, which can promote acid/base catalysed reactions.
The hydrothermal reduction of CO2 has been particularly successful in forming formic acid when starting with CO2 dissolved in slightly basic solutions as bicarbonates or carbamates, such as those formed when CO2 is captured by amines or ammonia. These processes have the advantage that the well-known absorption CO2 capture process can be associated with an in situ reaction process in which the feed of the reactor is the effluent of the absorption column, without the intermediate separation steps and their associated costs.
The reaction can be performed using metals such as Al, Fe or Zn as reductants14–17 or directly with gaseous H2.13,18 Yields of formic acid can be higher than 60% in residence times of 1–2 h using bicarbonate at temperatures between 250 °C and 300 °C. In combination with catalysts and using gaseous H2 as reductant, reaction temperature can be reduced to temperatures near 200 °C (ref. 14,17) or even to 120 °C in the case of ammonium carbamate or CO2 captured by amines.13,18 Among the catalysts studied, Pd/C catalysts have presented an especially good performance.13,14
Jin et al. were the first to prove that CO2 captured as bicarbonate could also be reduced to formic acid using organic substances with alcohol groups such as glycerine or isopropanol.19–21 This opened the possibility to simultaneously transform CO2 and biomass, as it is well known that lignocellulosic biomass can be dissolved and hydrolysed in hydrothermal media to form sugars such as glucose and other subproducts with alcohol groups.22–27 In 2018, Andérez et al. showed that a number of compounds derived from the hydrothermal decomposition of lignocellulosic biomass could react with bicarbonate at 300 °C, pressures above 20 MPa to ensure liquid phase conditions and a residence time of 2 h to produce formic acid.28 Further studies made with glucose as model organic reductant showed that part of the formic acid proceeded from inorganic CO2 and the other was originated by glucose decomposition, and that this combined reaction increased the selectivity of the transformation of glucose to formic acid.29 In 2022, Chinchilla et al.30 showed the effect of several catalysts in the production of formic acid in solutions of sodium bicarbonate. Yields of formic, lactic and acetic acid were higher using sodium bicarbonate as inorganic carbon source than with ammonium carbamate, and the global yield was not improved or only slightly improved with the catalysts tested. However, with Pd and Ru supported in carbon, the proportion of formic acid coming from inorganic CO2 increased.
The possibility to perform the reduction of CO2 with biomass residues allows to valorise lignocellulosic material that is commonly considered as residue. To convert these residues into products of high added value promoting the reutilization of biomass material and the reduction of CO2 emissions into the atmosphere is becoming of great interest. Some authors are implementing microalgae residues from biodiesel extraction or molecules derived from proteins to be utilized as reducing agents for the conversion CO2 captured.31,32 Andérez et al.33 presented results of the simultaneous conversion of CO2 and biomass (pine needles and sugarcane bagasse) at temperatures up to 275 °C, resulting in low yields of formic, lactic and acetic acid. Nevertheless, there is possibility to improve the yields of reaction of formic by adding catalyst that promote the hydrogenation of the CO2 captured. Also, in the previous work the origin of the formic acid was not investigated. Thus, to advance in this investigation, a systematic study encompassing a wider range of biomass reductants and catalysts and assessing the origin of the organic products (either the inorganic CO2 source or biomass decomposition) is required.
In the present work, the conversion of sodium bicarbonate at 300 °C using different biomass reductants (microcrystalline cellulose, soft wood, pine needles, sugarcane bagasse, vermicompost and sugar beet and cork waste) and catalysts (granular and powder activated carbon, Pd(5%)/C and Pd(10%)/C and Ru(5%)/C) is studied. The origin of formic acid produced in reactions at 200 °C and 300 °C is evaluated performing experiments with labelled H13CO3− as inorganic carbon source, with Pd(5%)/C as catalyst and the different biomasses tested. This research aims at assessing the best properties of biomass to act as CO2 reductant in the hydrothermal process, as well as the best combinations of reductant and catalyst.
2. Material and methods
2.1. Materials
All solutions were prepared with deionized water (conductivity 2 μS cm−1). Sodium bicarbonate (99.7%), sodium bicarbonate 13C (98.5%), acetic acid (99.7%), lactic acid (88%), formic acid (97.5%), galacturonic acid (99%), D-glucose (99%), glycolic acid (99%), glycerin (99.5%), formaldehyde (37%), ethyleneglycol (99.8%), 1–2 propanediol (99.5%), acrylic acid (99%), ethanol (99.8%), acetone (99.5%), 5-HMF (99%), microcrystalline cellulose, lignin (99%), furfural (99%) and sulfuric acid (96%) were purchased from Sigma-Aldrich. Activated carbon and metal supported catalysts (Pd(5%)/C, Pd(10%)/C) were acquired from Sigma-Aldrich, Ru(5%)/C (50% wet paste) was purchased from Strem Chemicals.Xylose (99%), arabinose (99%) and glucose (99%) were used (Sigma-Aldrich) as standards for measuring sugars carbohydrates and lignin in biomass.
Biomass materials used as reducing agents were obtained from different sources: pine needles and sugarcane bagasse (kindly provided by prof. James McGregor, University of Sheffield), sugar beet (kindly provided by AB Azucarera Iberia S.L.U.), vermicompost (elaborated and kindly provided by Eyup Yildirir from Usak University, Turkey) and soft wood chips (purchased from Vitakraft S.L.).
2.2. Preparation of biomass
All biomasses were grounded and sieved in a mesh of 100 μm. The sifting obtained was used to carry out the experiments.2.3. Humidity
The moisture content of all samples was measured with a Sartorius Model MAT 160. 80 °C was set as the drying temperature.2.4. Batch hydrothermal reactions
Solutions of sodium bicarbonate (SB) 0.5 M and SB13C 0.5 M were prepared gravimetrically in deionized water. 4.5 cm3 of this solution was charged in each high-pressure batch reactor. In experiments, additionally 0.1 g of catalyst and 0.1 g biomass were charged in the reactor. Mass ratio catalyst to biomass was always 1![[thin space (1/6-em)]](https://www.rsc.org/images/entities/char_2009.gif) :
:![[thin space (1/6-em)]](https://www.rsc.org/images/entities/char_2009.gif) 1, except in the experiments in which the influence of the amount of biomass was studied in which amounts of 1, 0.05 and 0.025 g of biomass were used, but the amount of catalyst was kept constant in 0.1 g.
1, except in the experiments in which the influence of the amount of biomass was studied in which amounts of 1, 0.05 and 0.025 g of biomass were used, but the amount of catalyst was kept constant in 0.1 g.
The reactors used consist of stainless-steel high-pressure tubing of ½′′ diameter and 10 cm3 of inner volume, closed with high pressure caps in the end.14,28,30 A thermocouple was installed in the reactor to measure the inner temperature of the system. For safety reasons and to avoid overpressure during heating, reactors were filled up with liquids only up to 45% of their volume. The final pressure is thus the vapor pressure of the water of the solution, plus the pressure generated by the gases released. Thus, a fraction of reactor volume not filled with liquid is necessary to avoid overpressure due to this possible gas release. Pressure was not measured inside of the reactor. The pressure inside the reactors was estimated as the saturation pressure of water at the working temperature.
Once filled and closed, the reactors were introduced in a horizontal position in a custom-made fluidized bed oven already preheated at the operational temperature. This oven consists of a bed of alumina fluidized by air and containing electrical resistances. It can work at temperatures as high as 400 °C, and the fluidization allows a rapid and uniform heating. Experiments were carried out at 200 °C, 250 °C and 300 °C. In experiments performed in a reactor equipped with a thermocouple it has been determined that the interior of the reactor reaches the operation temperature in 6–7 minutes. The reactors are kept inside the oven for 2 h and then, the reaction was stopped by quenching the reactor in cold water at 10 °C.
Once cooled, the reactors were opened. No appreciable amount of gases was collected, thus the initial assumption that the inner pressure of the reactor is the vapor pressure of water is correct.
All experiments were repeated at least twice. The uncertainty in the yields was estimated with the standard deviation of replications.
The yield of the desired products was calculated by dividing the molar concentration of the product by the initial concentration of SB or SB 13C as indicated in eqn (1).
 | (1) |
Although only part of the formic acid comes from bicarbonate and the lactic and acetic acid come entirely from biomass, the yields have been expressed with respect to bicarbonate to facilitate comparison.
2.5. Analysis of solid samples of biomass
 | (2) |
The solid phase was collected and placed in crucibles and located in the furnace at 575 °C. Samples were treated for 24 hours. Samples were weighed before and after the treatment.
The ash content was calculated as indicated in eqn (3).
 | (3) |
The percentage of acid insoluble lignin (%AIL) was calculated as shown in eqn (4).
 | (4) |
The percentage of structural carbohydrates with five and six carbon atoms after the hydrolysis of biomass was calculated as shown in eqn (5) and (6), respectively.
 | (5) |
 | (6) |
2.6. Analysis of solid samples of catalysts
BSEs (Backscattered electrons) for SEM images was carried out at 15 kV and a low vacuum of 30 Pa in a “FlexSEM1000” of the HITACHI brand.
These last stages allow the total liberation of F− of the solution to avoid the formation of insoluble fluorides and corrosion of the quartz parts of the ICP used. Finally, after digestion, the sample is diluted with MQ water and filtered with a 0.45 μm filter.
To measure concentration the digested sample was introduced in a Microwave-ULTRAWAVE (Milestone) and 725-ES ICP-Optical Emission Spectrometer (Agilent).
2.7. Analysis of liquid samples
Liquid samples coming from the hydrothermal reaction were collected and filtered with 0.22 μm nylon filter to be furtherly analyzed by HPLC or NMR. The gas phase was not analyzed, as in all experiments no gas or a very small amount of gas was produced, and it was not possible to collect it.For structural carbohydrates analysis, a Shodex® column was used. Temperatures of column and detector were 60 °C and 30 °C, respectively. As mobile phase, a 0.8 mL min−1 flow of 0.25 mM H2SO4 was used.
![[thin space (1/6-em)]](https://www.rsc.org/images/entities/char_2009.gif) 250 Hz, a total of 16 transients and 1.048 s acquisition time. The inverse gated decoupling technique to suppress the nuclear Overhauser effect (NOE) was used to obtain quantitative measurements. The acquisition parameters for 1H NMR spectra were: 25 °C, 70 s relaxation delay between transients, 90° pulse width, spectral width of 8012.8 Hz, a total of 4 transients and 2.044 s acquisition time. The PRESAT sequence was used in order to suppress the strong signal of water.
250 Hz, a total of 16 transients and 1.048 s acquisition time. The inverse gated decoupling technique to suppress the nuclear Overhauser effect (NOE) was used to obtain quantitative measurements. The acquisition parameters for 1H NMR spectra were: 25 °C, 70 s relaxation delay between transients, 90° pulse width, spectral width of 8012.8 Hz, a total of 4 transients and 2.044 s acquisition time. The PRESAT sequence was used in order to suppress the strong signal of water.1H and 13C NMR chemical shifts (δ) were reported in parts per million (ppm) and referenced to tetramethylsilane (TMS). For all the samples, a capillary tube filled with chloroform was inserted into the NMR tubes to assure lock conditions.
3. Results
3.1. Biomass characterization
In Table 1, the measured properties of the biomass samples before the reaction are reported. Table 2 presents the results of the elemental analysis of these samples.| Biomass | % Humidity | % Total solid content | % Ash | % Acid insoluble lignin | % C5 | % C6 |
|---|---|---|---|---|---|---|
| Softwood | 4.8 | 95.2 | 0.6 | 30 | 18 | 33 |
| Sugarcane bagasse | 6.6 | 93.4 | 1.1 | 25 | 23 | 31 |
| Sugar beet | 8.1 | 91.9 | 1.8 | 36 | 16 | 23 |
| Cork | 3.7 | 96.3 | 0.1 | 75 | 6 | 4 |
| Pine needles | 6.3 | 93.7 | 0.1 | 44 | 10 | 16 |
| Vermicompost | 4.6 | 95.4 | 38.7 | 29 | 2 | 2 |
| Biomass | Element | H/C | O/C | |||
|---|---|---|---|---|---|---|
| % N | % C | % H | % O | |||
| Softwood | 0.00 | 48 | 6.1 | 43.3 | 1.5 | 0.7 |
| Sugarcane bagasse | 3.4 | 44.9 | 5.6 | 42.2 | 1.5 | 0.7 |
| Sugar beet | 0.2 | 46.9 | 5.7 | 41.5 | 1.4 | 0.7 |
| Cork | 0.4 | 60.5 | 7.6 | 27.5 | 1.5 | 0.3 |
| Pine needles | 2.0 | 48.1 | 5.9 | 37.7 | 1.5 | 0.6 |
| Vermicompost | 1.8 | 24.1 | 2.6 | 20.8 | 1.3 | 0.6 |
3.2. Catalysts characterization
In Fig. 1, the SEM images of the physical structure of the catalysts is presented. It can be observed that C granular (Fig. 1(a)), C powder (Fig. 1(b)), Pd(5%)/C (Fig. 1(c)), and Pd(10%)/C (Fig. 1(d)) presented an inner tubular structure. On the other hand, Ru(5%)/C (Fig. 1(e)) presents an amorphous structure.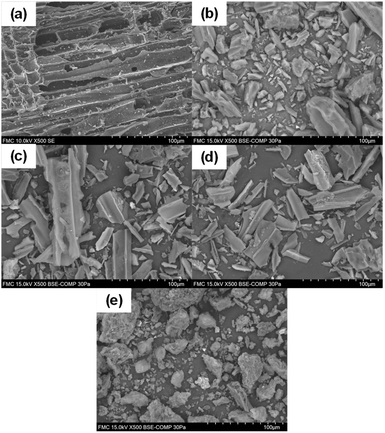 | ||
| Fig. 1 SEM of catalyst before reaction: C granular (a), C powder (b), Pd(5%)/C (c), Pd(10%)/C (d), Ru(5%)/C (e). | ||
In Fig. 2 XRD patterns for all the catalysts before reaction experiments are presented. In Fig. 2(a), the typical XRD pattern of activated carbon in powder form presenting two broad diffraction peaks around 24°–26° and 42°–47° are observed.34 All catalysts are carbon-based materials, thus these two wide peaks are repeated in all the XRD patterns of all studied materials. XRD pattern for C granular (Fig. 2(b)) presents several narrow peaks that correspond to crystalline structures that are identified as rests of calcite and quartz that can come from the origin source of this type of carbon. Pd(5%)/C and Pd(10%)/C (Fig. 2(c) and (d)) catalysts presented two narrow peaks around 40° and 47° that corresponded to the face-centered cubic structure of Pd supported.34 For Ru(5%)/C narrow peaks around 44° correspond to Ru diffraction planes, the other narrow peaks corresponded to rests of quartz remaining in the carbon support.35,36
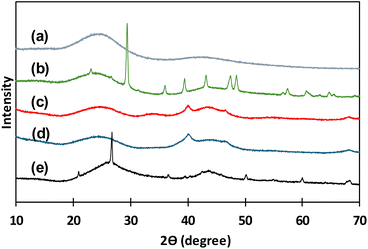 | ||
| Fig. 2 XRD patterns for catalysts before use: C powder (a), C granular (b), Pd(10%)/C (c), Pd(5%)/C (d), Ru(5%)/C (e). | ||
In Table 3 the diameter and BET surface of the materials is presented. The C granular presented the lower surface area in comparison with the rest of the materials.
| Catalyst | Average diameter | BET surface (m2 g−1) |
|---|---|---|
| C granular | 2 mm | 75 |
| C powder | 55 μm | 650 |
| Pd(5%)/C | 45 μm | 948 |
| Pd(10%)/C | 45 μm | 880 |
| Ru(5%)/C | 50 μm | 844 |
3.3. Influence of the catalyst in the simultaneous reaction of biomass and CO2
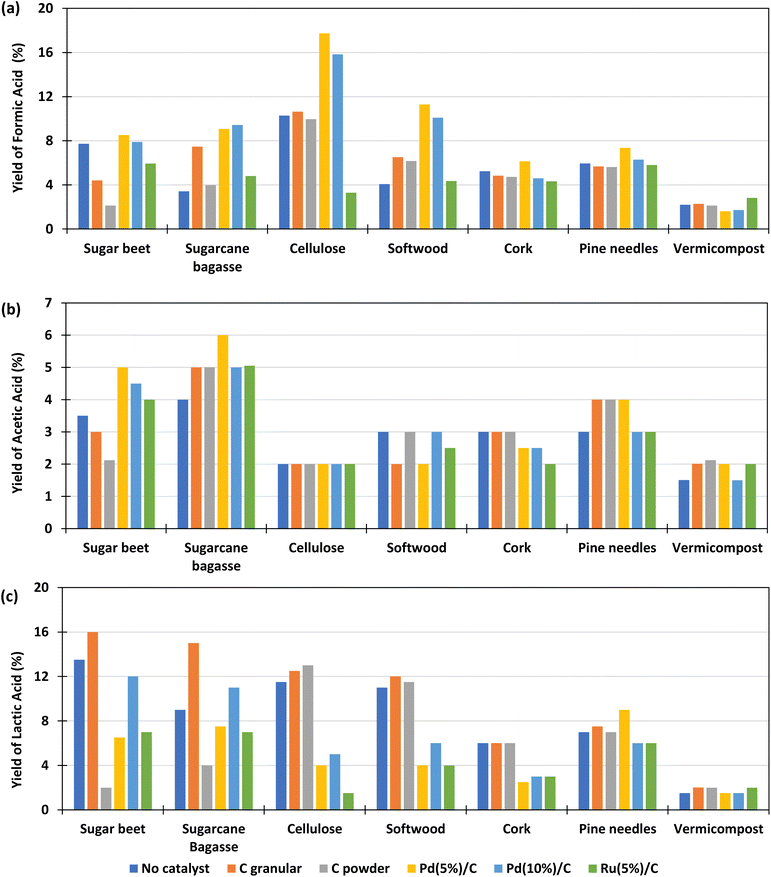
The main products obtained in all reactions are formic acid (FA), acetic acid (AA), lactic acid (LA). Glyceraldehyde, glycolaldehyde, formaldehyde, ethylene glycol, acetone, pyruvaldehyde, galacturonic acid, 5-HMF, among others, were detected to a lesser extent. All these components are typical products derived from biomass decomposition in hydrothermal media.22,23 The experiments to determine the influence of the different catalysts for the different biomass were carried out at a temperature of 300 °C with 0.1 g of catalyst and 0.1 g of biomass and 2 h of reaction time. The 2 h residence time was selected based on previous literature results which suggest that shorter reaction times are less effective in enhancing formic acid production.19,20,28–30,33 The FA yields obtained under these conditions are shown in Fig. 3(a) (go to Section 1.1, 2.1, and 3.1 of the ESI to see the tabulated data†).It is observed that, using Pd(5%)/C catalyst, for most samples of biomass, the global FA yield was higher than without catalyst, in contrast to the results observed by Chinchilla et al.30 in experiments with glucose as model organic reductant at 200 and 250 °C. In the cases of granular and powder carbon, the yields of formic acid are of the same order than without catalyst and in the case of Ru(5%)/C they are much lower. The best results were obtained with Pd(5%)/C catalyst, with yields that were even higher than those using Pd(10%)/C. The highest yield of FA obtained was 18%. This yield was obtained using pure cellulose as a biomass derivative (black circles), and with the Pd(5%)/C catalyst; followed by a 16% yield also obtained with cellulose and Pd(10%)/C (black circles). With the softwood biomass, a maximum FA yield of 12% and 10% was obtained using Pd(5)%/C and Pd(10%)/C (navy blue cross), respectively. The yield of formic acid is lower for cork (less than 6%) and pine needles (less than 7%). If we compare it with the composition of the different biomass presented in Table 3, it is observed that samples of biomass rich in cellulose presented higher yields of conversion to formic acid. The biomass with the lowest yield of FA was vermicompost (less than 2% and not improved by using any catalyst), probably due to the high amount of ashes and the low amounts of C5 and C6 compounds (see Table 2).
The results of the yields of acetic acid obtained in the experiments are presented in Fig. 3(b). It is observed that, in most cases, the yield of acetic acid improved with the use of catalysts and in general presented similar values for the different biomass samples, with the best results again being achieved with Pd(5%)/C. It is observed that the sugar beet produced lower acetic acid yields with powder and granular C catalysts. Cork presented lower values for Pd and Ru catalysts and soft wood presented lower yields of acetic acid with Ru(5%)/C catalyst. The biomasses with which the highest amounts of acetic acid were obtained are sugarcane bagasse (4–6%), sugar beet (3.5–5%) and pine needles (3–4%). The biomass that produced the lowest yield of acetic acid was, in general, cellulose (2%). This can be explained because acetic acid is produced from the hydrolysis and oxidation of the sugars generated by the hydrolysis of hemicellulose and cellulose, but, additionally, the dissolution of hemicelluloses releases acetyl groups that are part of the hemicellulose structure.37,38 Furthermore, the release of acid increments the hydrolysis reaction rate due to an autocatalytic effect.39 Pd/C and Ru/C are some of the heterogeneous catalysts most used for hydrogenation applications. The high surface area (around 850 to 950 m2 g, see Table 3) than allows palladium and ruthenium to disperse uniformly on the solid support, this provide high activity to the catalyst, which can explain the high yields of FA obtained when Pd(5%)/C is used in the reaction. However, Ru/C decompose formic acid and hydrogenate other compounds such as levulinic acid in acid media,36 this decomposition can be promoting the lower yields of formic acid obtained in the reaction at 300 °C with this catalyst. Regarding C powder and C granular, these materials have low BET surface (75 and 650, respectively, see Table 3) which reduce the activity of the material. Besides the low BET surface, it is noted that the addition of the metal in the carbon support enhances the activity of the carbon materials.
Fig. 3(c) shows the lactic acid yields. It can be observed that the highest lactic acid yields were obtained when using granular C as catalyst and sugarcane bagasse (15%) and beetroot (16%) as biomass. It is observed that the LA yield slightly increase when using granular C in biomasses rich in sugar such as beet (from 14 to 16%) and sugarcane bagasse (from 9 to 15%). This is possibly due to the presence of saccharose (a dimer made of glucose and fructose), which decomposes faster than structural carbohydrate, and fructose released, that is rapidly converted to lactic acid promoted by the slightly basic media.40 In the case of vermicompost and cork it is observed that the LA yield did not change significantly when using a different catalyst.
3.4. Influence of the temperature in the simultaneous reaction of biomass and CO2
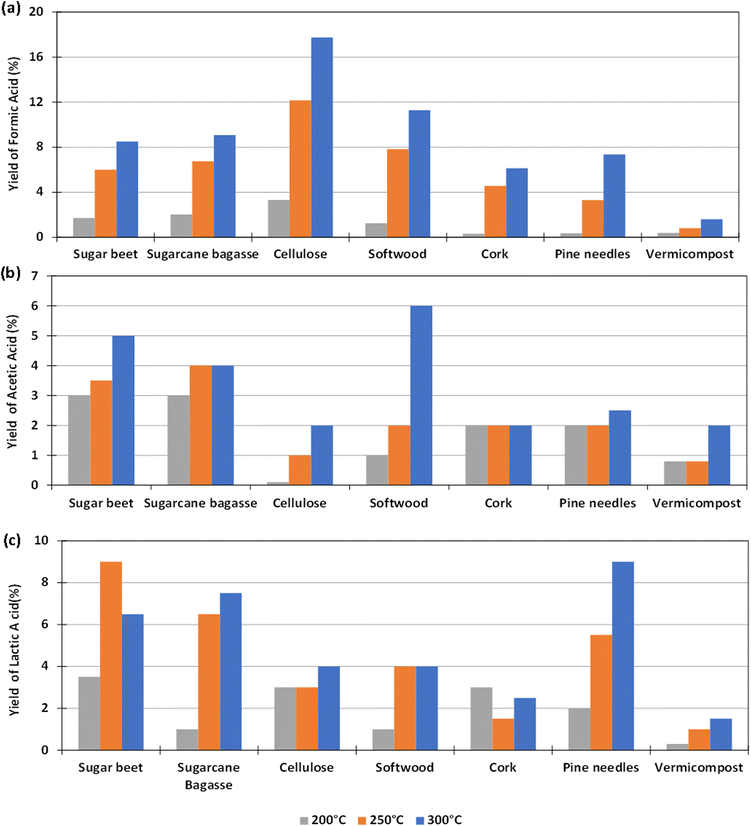
The experiments to determine the influence of the reaction temperature for the different biomass were carried out using Pd(5%)/C as catalyst, as this gave the highest yield of formic acid, as reported in Section 3.2. The aim was to determine if the use of the catalyst could make possible the operation at lower reaction temperatures. Temperatures of 200, 250 and 300 °C were considered. 0.1 g of catalyst and 0.1 g of biomass were used and the reaction time was fixed again in 2 h (go to Section 1.3, 2.3 and 3.3 of the ESI to see the tabulated data†).The yields of formic acid at different temperatures are shown in Fig. 4(a). It can be observed that the that the higher the reaction temperature, the higher the yield of formic acid obtained. For example, using pure cellulose, which is the biomass derivative that produces the highest FA yield, a yield of FA of 18% at 300 °C is obtained, a value that drops down to almost 4% at 200 °C. In the case of softwood, the yield falls from 11% at 300 °C to 1% at 200 °C. Similar behavior was observed in experiments with other biomass reductants.
Fig. 4(b) shows that in most cases the AA yield increases slightly by increasing temperature. In the case of pine needles, the yield of AA remained approximately constant in the temperature range tested. In the case of sugar beet residues and sugarcane bagasse, it was observed that the AA yield was higher when increasing temperature from 200 °C to 300 °C (increasing from 3 to 5% and from 3 to 4% respectively). The same result was observed with cellulose, softwood, cork, and vermicompost (increasing from 0 to 2%, 1 to 6%, 2 to 3%, 1 to 2%).
With respect to the yield to lactic acid (Fig. 4(c)), it was observed in most cases that this yield increased by increasing temperature, except when using sugar beet, with which the maximum yield of lactic acid was achieved at 250 °C. This increase was considerable in the cases of sugarcane bagasse and pine needles (from 2 to 9% and from 1 to 6.5%, respectively). With vermicompost, cellulose, cork and softwood, the LA yield increased slightly by increasing temperature (from 0 to 1.5%, from 3 to 4%, from 1.5 to 3%, and from 1 to 4%, respectively).
3.5. Influence of the amount of biomass in the simultaneous reaction with CO2
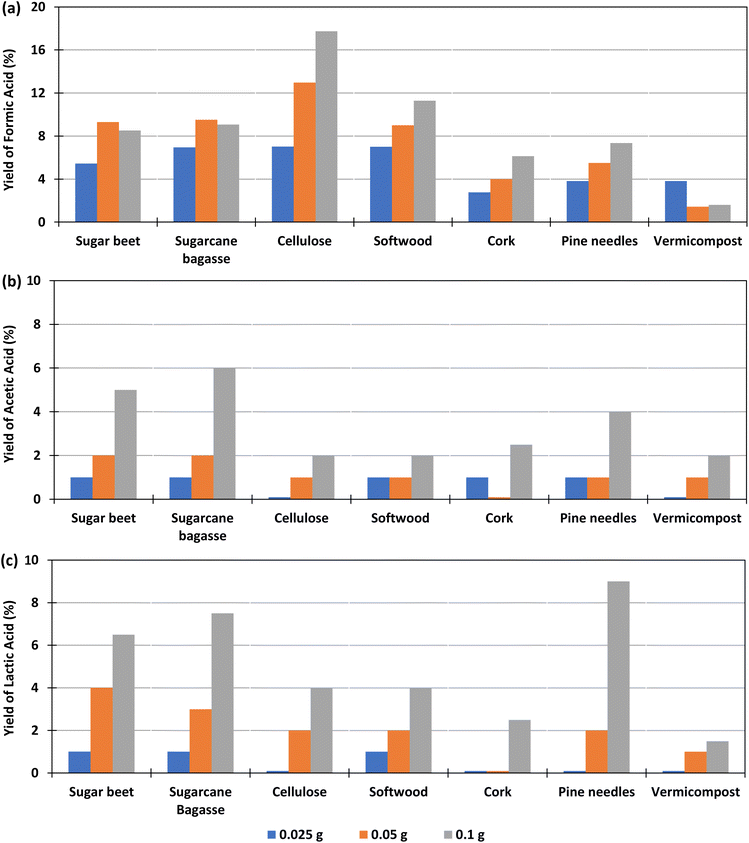
The effect of the amount of biomass added in the experiment, for a constant amount of bicarbonate was studied with 0.1 g Pd(%5)/C as catalyst at 300 °C, using 0.025, 0.05 or 0.1 g of biomass, at reaction times of 2 h. The yields of formic, lactic and acetic acids obtained in these conditions are shown in Fig. 3 (go to Section 1.2, 2.2, and 3.2 of the ESI to see the tabulated data†).Fig. 5(a) shows that, for cellulose, pine needles and cork, the yield of formic acid increased with the amount of biomass added. For example, with 0.1 g of cellulose, a yield of 18% was produced, while with 0.025 g the yield was 7%. In the case of beet and sugarcane bagasse, the FA yield increased slightly when using 0.05 g of biomass instead of 0.1 g (from 9.3% and 9.5%, to 8.5 and 9.1%, respectively). For vermicompost, the highest yield (4%) was obtained when a smaller amount of biomass of 0.025 g was added in the reactor. Andérez et al.29 found that the yield of the formic acid decreases when increasing the biomass (glucose), nevertheless the same authors33 found this effect less important when using as biomass sugar cane bagasse in amounts similar to that used in this work at 250 °C.
Fig. 5(b) shows that, using Pd(5%)/C as a catalyst, in the case of cellulose, softwood, pine needles, and vermicompost, the AA yield increases slightly (from 0 to 2%, 1 to 2%, 1 to 3%, and 0 to 2%) as the amount of biomass increases. In the case of beet residues, sugarcane bagasse, and cork, a higher production of AA is observed with the increase in the amount of biomass (from 1 to 5%, from 1 to 6% and from 1 to 4% respectively).
In Fig. 5(c), it is observed that when using Pd(5%)/C as a catalyst, the LA yield increased as the amount of biomass increased in the experiments. The increment was higher when using pine needles, sugarcane bagasse and sugar beet (from 0 to 9%, from 1 to 7.5% and from 1 to 6.5% respectively). The increment in the LA yield of cork and cellulose was lower (from 0 to 4% and from 0 to 2.5%), while it was negligible for vermicompost samples (from 0 to 1.5%).
3.6. Origin of the formic acid at different temperatures and type of biomass
According to previous studies,29,30 FA can be formed via two routes, from the oxidation of biomass compounds or from the reduction of sodium bicarbonate (SB) (CO2 source). NMR spectroscopy was used to determine how much formic acid comes from each species. The experiments were carried out with NaH13CO3 (SB13C), which is an isotope of SB. The NMR carbon spectra in a typical experiment is shown in Fig. 6 (go to Section 4 of the ESI to see the NMR spectra†).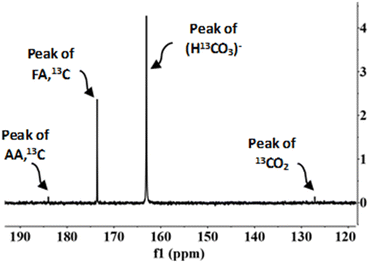 | ||
Fig. 6 NMR carbon spectra. Conditions of reaction: mass ratio Pd(5%)/C![[thin space (1/6-em)]](https://www.rsc.org/images/entities/char_2009.gif) : :![[thin space (1/6-em)]](https://www.rsc.org/images/entities/char_2009.gif) cellulose 1 cellulose 1![[thin space (1/6-em)]](https://www.rsc.org/images/entities/char_2009.gif) : :![[thin space (1/6-em)]](https://www.rsc.org/images/entities/char_2009.gif) 1, 0.1 g of catalyst, 0.5 M NaH13CO3, 45% filling volume of reactor, 300 °C, 2 h. 1, 0.1 g of catalyst, 0.5 M NaH13CO3, 45% filling volume of reactor, 300 °C, 2 h. | ||
In the 13C NMR spectrum only the compounds derived from the reduction of CO2 captured as SB13C are observed. The products observed were acetic acid (δ = 183) and formic acid (δ = 173). The peak at δ = 163 corresponds to SB13C that did not react and the peak at δ = 127 corresponds to 13CO2 dissolved in the sample. The peak at δ = 183, corresponding to acetic acid, does not indicate that acetic acid is a product of reaction of SB13C, but it occurred due to the decomposition of biomass, because 13C is naturally present among 12C in a low proportion.29,41
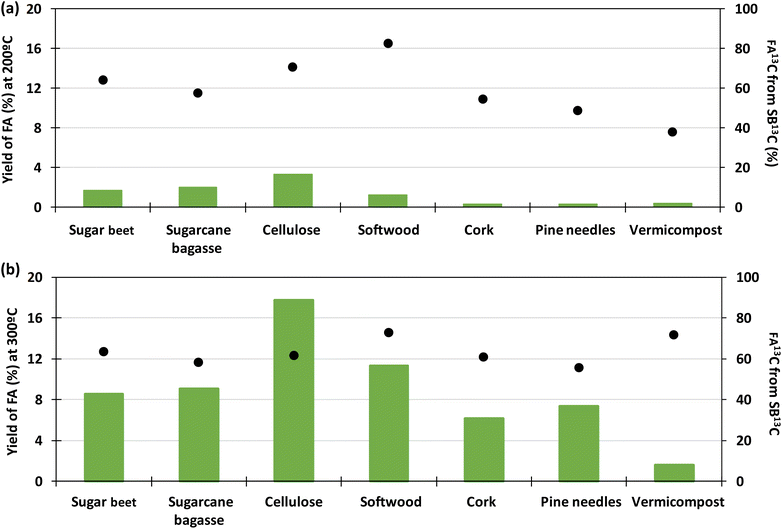
Fig. 7 presents a typical proton spectrum. As shown in this figure, the FA signal originating from SB13C is represented by three peaks. The peak in the middle corresponds to the FA that comes from the biomass and those on the sides correspond to the 13FA that comes from the SB13C. The fraction of FA that comes from the reduction of SB13C is calculated by the ratio of areas between the peaks. Experiments for calculating the fraction of FA originated from SB13C were carried out with 0.1 g of Pd(5%)/C (as the most promising catalyst) and 0.1 g of biomass, at temperatures of 200 °C and 300 °C. Results are presented in Fig. 8. It is observed that in all cases the amount of FA obtained at 200 °C is lower than the amount at 300 °C. At 200 °C the highest value was achieved with cellulose, with a FA yield of 4%, while at 300 °C all the biomass samples rended more than at 200 °C, with a 18% yield in the case of cellulose. It is observed that the percentage of formic acid coming from bicarbonate ranged from 40 to 80% at 200 °C and from 54 to 73% at 300 °C. This proportion is very high at both temperatures, compared to results obtained at 200 °C by Andérez et al.29 in which all the formic acid formed at this temperature came from the biomass derivative (glucose). There is no significant change in the proportion of FA13C formed from bicarbonate at higher temperature in most cases (for example with pine needles pine needles increased from 48% to 56%; and cork from 55% to 61%, respectively). Results obtained with vermicompost nevertheless show a significant increment with temperature: at 200 °C, 38% of FA came from inorganic 13C, while at 300 °C this proportion increased to 71%. In some cases, the proportion of FA13C is higher at 200 °C. For example, with softwood and cellulose, a higher fraction of FA13C was obtained at 200 °C (82% and 71%, respectively) than at 300 °C (73% and 61%). In previous studies on the origin of the formic acid using glucose as a model compound of biomass, the percentage of FA13C at 200 °C was zero without using catalysts, while at 300 °C it increased to almost 60%.29 When using glucose as a model compound of biomass and Pd(5%)/C as catalyst, the percentage of FA13C at 250 °C was near 80%.30 Pd(5%)/C is therefore able to catalyze the reduction of bicarbonate to formic acid, even at low temperatures. Nevertheless, the highest yields are obtained at 300 °C.
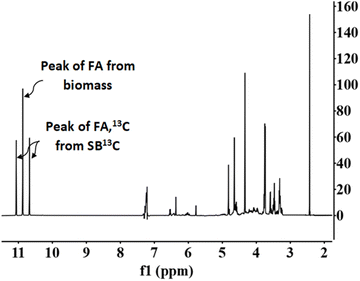 | ||
Fig. 7 NMR proton spectra. Conditions of reaction: mass ratio Pd(5%)/C![[thin space (1/6-em)]](https://www.rsc.org/images/entities/char_2009.gif) : :![[thin space (1/6-em)]](https://www.rsc.org/images/entities/char_2009.gif) cellulose 1 cellulose 1![[thin space (1/6-em)]](https://www.rsc.org/images/entities/char_2009.gif) : :![[thin space (1/6-em)]](https://www.rsc.org/images/entities/char_2009.gif) 1, 0.1 g of catalyst, 0.5 M NaH13CO3, 45% filling volume of reactor, 300 °C, 2 h. 1, 0.1 g of catalyst, 0.5 M NaH13CO3, 45% filling volume of reactor, 300 °C, 2 h. | ||
3.7. Reutilization of the Pd(5%)/C catalyst
Pd(5%)/C has shown best results for obtaining formic acid from the reduction of captured CO2 and biomass catalysts. Due to the difficulty observed in separating the reacted biomass from the catalyst particles, glucose (which is a biomass derivate soluble in water) has been used to evaluate reutilization of the catalyst. Pd(5%)/C was reused 4 times at 300 °C using NaH13CO3 as carbon source, mass ratio of catalyst and glucose was 1![[thin space (1/6-em)]](https://www.rsc.org/images/entities/char_2009.gif) :
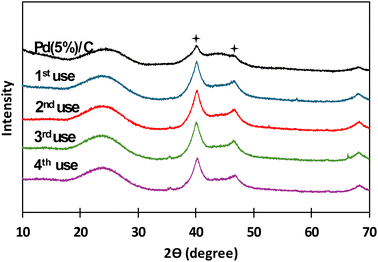
:![[thin space (1/6-em)]](https://www.rsc.org/images/entities/char_2009.gif) 1, the same as in the case of biomass, and the reaction time was carried out in the batch reactor for 2 hours. After each use catalyst was recovered by filtration and thoroughly rinsed with distilled water. In Fig. 9, XRD patterns for Pd(5%)/C before and after each reuse are presented. It is noticed that the two characteristic peaks of Pd supported on carbon (at 40° and 47°, respectively) from before the reaction appeared in all the XRD patterns of the succeeding experiments. It is also noticed that the intensity of the peaks increased after the first use of the catalyst and patterns presented a similar intensity in the subsequent reutilization reactions. The increase in the intensity of the peaks can be due the temperature at which the reaction takes places. Liu et al.42,43 referred that, at high temperatures, Pd particles migrate to the surface of the catalyst, where they can coalesce, expand and increase its particle size. Gong et al.43 observed the same phenomena obtaining sharp diffraction peaks in XRD patterns after submitting Pd supported on carbon nanofiber membranes at high temperature treatments. In Fig. 10 and 11, BSEs and TEM images of the catalyst before and after each reuse are presented. It is observed that from 1st reuse the Pd particles are more visible on the surface. With subsequent uses some of the Pd particles increase in size confirming that there is migration and coalescence of Pd particles as observed in literature.42,43
1, the same as in the case of biomass, and the reaction time was carried out in the batch reactor for 2 hours. After each use catalyst was recovered by filtration and thoroughly rinsed with distilled water. In Fig. 9, XRD patterns for Pd(5%)/C before and after each reuse are presented. It is noticed that the two characteristic peaks of Pd supported on carbon (at 40° and 47°, respectively) from before the reaction appeared in all the XRD patterns of the succeeding experiments. It is also noticed that the intensity of the peaks increased after the first use of the catalyst and patterns presented a similar intensity in the subsequent reutilization reactions. The increase in the intensity of the peaks can be due the temperature at which the reaction takes places. Liu et al.42,43 referred that, at high temperatures, Pd particles migrate to the surface of the catalyst, where they can coalesce, expand and increase its particle size. Gong et al.43 observed the same phenomena obtaining sharp diffraction peaks in XRD patterns after submitting Pd supported on carbon nanofiber membranes at high temperature treatments. In Fig. 10 and 11, BSEs and TEM images of the catalyst before and after each reuse are presented. It is observed that from 1st reuse the Pd particles are more visible on the surface. With subsequent uses some of the Pd particles increase in size confirming that there is migration and coalescence of Pd particles as observed in literature.42,43
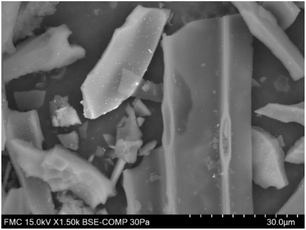 | ||
| Fig. 10 BSEs (backscattered electron) in SEM for Pd(5%)/C catalyst before use. Bright dots correspond to dispersed Pd on the carbon surface. | ||
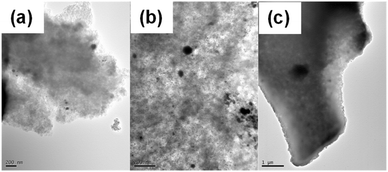 | ||
| Fig. 11 TEM images for Pd(5%)/C catalyst after first (a), second (b), and third use (c). Black dots correspond to dispersed Pd on the carbon surface. | ||
In Table 4 it is observed a decrease in the concentration of palladium in catalyst up to 26% after the 4th use, indicating a possible leaching of Pd. Nevertheless, after analysing the liquid phase by 1H NMR and HPLC it is observed that both the yield of formic acid coming from the reduction of sodium bicarbonate and the total yield of formic acid (coming from both the oxidation of glucose and the reduction of the NaHCO3) are constant up to the 4th use (Table 4). Thus, even though submitting the material to hydrothermal conditions that reduce the amount of Pd and aggregate the Pd particles on the surface of the catalyst, the performance of the catalyst is unaffected up to the 4th use. The constant yields of formic acid indicate a low deactivation, that means that there is still enough to metal dispersed in the surface to allow a constant yield values of formic acid after each use.
![[thin space (1/6-em)]](https://www.rsc.org/images/entities/char_2009.gif) :
:![[thin space (1/6-em)]](https://www.rsc.org/images/entities/char_2009.gif) glucose 1
glucose 1![[thin space (1/6-em)]](https://www.rsc.org/images/entities/char_2009.gif) :
:![[thin space (1/6-em)]](https://www.rsc.org/images/entities/char_2009.gif) 1, 0.1 g of catalyst, 0.5 M NaH13CO3, 45% filling volume of reactor, 300 °C, 2 h
1, 0.1 g of catalyst, 0.5 M NaH13CO3, 45% filling volume of reactor, 300 °C, 2 h
| Fraction of FA13C from SB13C (%) | Yield of total FA (%) | Yield of FA13C (%) | Amount of Pd on catalyst (mg g−1) | Loss of Pd in the catalyst (%) | |
|---|---|---|---|---|---|
| Pd(5%)/C | — | — | — | 45 | — |
| 1st use | 66 | 8 | 5 | 39.6 | 12 |
| 2nd use | 66 | 7 | 4 | 36.4 | 19 |
| 3rd use | 67 | 7 | 5 | 33.4 | 26 |
| 4th use | 67 | 8 | 5 | 33.4 | 26 |
3.8. Influence of catalysts in mechanism of reaction
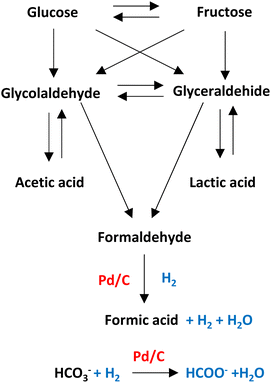
Pd/C is one of the heterogeneous catalysts most used for hydrogenation applications. The high surface area (among 800–1200 m2 g) allows palladium and ruthenium to disperse uniformly on the solid support.As shown in Fig. 12, in hydrothermal basic media, glucose, a molecule that comes from the degradation of cellulose, can be degraded into glyceraldehyde and glycolaldehyde forming later acetic acid, lactic acid, and formaldehyde which can be precursor of formic acid (see Fig. 12).33,44 Molecules with primary alcohol groups can oxidize on the surface of the catalyst liberating hydrogen to subsequently reduced the formaldehyde into formic acid liberating another molecule of hydrogen and water. Simultaneously, bicarbonate anion can be absorbed on the surface of the metal supported catalyst to be hydrogenated (with H2 transferred from the oxidation of the primary alcohol groups or from the reduction of formaldehyde) into formic acid.45
4. Conclusions
Hydrothermal conversion of CO2 captured in a basic solution of NaHCO3 was performed in presence of carbon supported catalysts and by using different types of biomass reductants, including sugarcane bagasse, sugar beet, vermicompost, cork, pine needles, cellulose and commercial softwood. The main products of the reaction were acetic acid, lactic acid and formic acid.The best yields of formation of formic acid were obtained with the Pd(5%)/C catalyst, with a yield of 18% with pure cellulose as reductant. The next highest yields were obtained with biomass samples with a high cellulose content, such as softwood, that produced a 11% formic acid yield.
As formic acid can originate from both sodium bicarbonate and biomass, its origin was evaluated in experiments with marked NaH13CO3 to know precisely the fraction of FA coming from the inorganic CO2 source and that coming from biomass. When using the Pd(5%)/C, it was observed that the production of formic acid was very low at 200 °C even using the catalyst. Nevertheless, at both experimental temperatures (200 °C and 300 °C), between 70 and 85% of the total FA produced came from the inorganic CO2 source, especially in reactions with biomass with a high cellulose content such as softwood and sugar cane residues.
Reutilization of Pd(5%)/C was carried out using glucose as biomass. The yields of total FA and the fraction of FA13C coming from the reduction of SB13C were constant after four reuses. Even though XRD patterns and TEM images indicate a possible coalescence of the Pd particles on the surface of the solid, this phenomenon does not affect, apparently, the activity of catalyst to promote formation of FA from the CO2 source.
Data availability
The data supporting this article have been included as part of the ESI.†Author contributions
Maira I. Chinchilla: conceptualization, methodology, investigation, data curation, writing – original draft. María D. Bermejo: conceptualization, methodology, supervision, review & editing. A. Martín, review & editing, project administration, funding acquisition. James McGregor: review & editing. Fidel A. Mato: review & editing.Conflicts of interest
The authors declare that they have no known competing financial interests or personal relationships that could have appeared to influence the work reported in this paper.Acknowledgements
M. I. C. acknowledge Universidad de Valladolid and Banco de Santander for predoctoral grant and Laboratorio de Técnicas Instrumentales for support in the development of this research. This project has been funded by Junta de Castilla y León (project “CLU-2019-04 – BIOECOUVA Unit of Excellence” of the University of Valladolid), co-financed by the European Union (ERDF “Europe drives our growth”); the Naturgy Foundation thorough the prize for the best Research and Technological Innovation project in the field of energy and by the project PID2023-150529OB-I00 of MICIU. The authors thank AB Azucarera Iberia S. L. U. and prof. Eyup Yildirir from Usak University, Turkey) for providing biomass samples for the experiments. The authors thank Sergio Ferrero from Laboratorio de Técnicas Instrumentales of Universidad de Valladolid for support in the development of this research.Notes and references
- T. R. Anderson, E. Hawkins and P. D. Jones, Endeavour, 2016, 40, 178–187 CrossRef PubMed.
- H. Ben Ameur, X. Han, Z. Liu and J. Peillex, Econ. Modell., 2022, 116, 106005 CrossRef.
- N. Mac Dowell, P. S. Fennell, N. Shah and G. C. Maitland, Nat. Clim. Change, 2017, 7, 243–249 CrossRef CAS.
- IPCC, 2023: Climate Change 2023: Synthesis Report. Contribution of Working Groups I, II and III to the Sixth Assessment Report of the Intergovernmental Panel on Climate Change, IPCC, Geneva, Switzerland, p. 184, DOI:10.59327/IPCC/AR6-9789291691647.
- S. Kim, Y. Kim, S. Y. Oh, M. J. Park and W. B. Lee, J. Nat. Gas Sci. Eng., 2021, 96, 104308 CrossRef CAS.
- Y. Yang, W. Xu, Y. Wang, J. Shen, Y. Wang, Z. Geng, Q. Wang and T. Zhu, Chem. Eng. J., 2022, 450, 138438 CrossRef CAS.
- J. Monteiro and S. Roussanaly, J. CO2 Util., 2022, 61, 102015 CrossRef CAS.
- L. Fu, Z. Ren, W. Si, Q. Ma, W. Huang, K. Liao, Z. Huang, Y. Wang, J. Li and P. Xu, J. CO2 Util., 2022, 66, 102260 CrossRef CAS.
- M. Y. Lee, K. T. Park, W. Lee, H. Lim, Y. Kwon and S. Kang, Crit. Rev. Environ. Sci. Technol., 2019, 50, 769–815 CrossRef.
- Z. Guo, P. Zhou, L. Jiang, S. Liu, Y. Yang, Z. Li, P. Wu, Z. Zhang and H. Li, Adv. Mater., 2024, 36, 2311149 CrossRef CAS PubMed.
- S. Liu, Z. Guo, Y. Yang, P. D. Wu, Z. Li, K. Wang, H. Zhang, H. Li and S. Yang, Environ. Chem. Lett., 2024, 22, 463–470 CrossRef CAS.
- M. Mikkelsen, M. Jørgensen and F. C. Krebs, Energy Environ. Sci., 2010, 3, 43–81 RSC.
- J. I. del Río, E. Pérez, D. León, Á. Martín and M. D. Bermejo, J. Ind. Eng. Chem., 2021, 97, 539–548 CrossRef.
- L. Quintana-Gomez, P. Martinez-Alvarez, J. J. Segovia, A. Martin and M. D. Bermejo, J. CO2 Util., 2023, 68, 102369 CrossRef CAS.
- D. Roman-Gonzalez, A. Moro, F. Burgoa, E. Pérez, A. Nieto-Márquez, Á. Martín and M. D. Bermejo, J. Supercrit. Fluids, 2018, 140, 320–328 CrossRef CAS.
- F. Jin, Y. Gao, Y. Jin, Y. Zhang, J. Cao, Z. Wei and R. L. Smith, Energy Environ. Sci., 2011, 4, 881–884 RSC.
- H. Zhong, L. Wang, Y. Yang, R. He, Z. Jing and F. Jin, ACS Appl. Mater. Interfaces, 2019, 11, 42149–42155 CrossRef CAS PubMed.
- K. Park, G. H. Gunasekar, S. H. Kim, H. Park, S. Kim, K. Park, K. D. Jung and S. Yoon, Green Chem., 2020, 22, 1639–1649 RSC.
- Z. Shen, Y. Zhang and F. Jin, Green Chem., 2011, 13, 820–823 RSC.
- Z. Shen, Y. Zhang and F. Jin, RSC Adv., 2012, 2, 797–801 RSC.
- Z. Shen, M. Gu, M. Zhang, W. Sang, X. Zhou, Y. Zhang and F. Jin, RSC Adv., 2014, 4, 15256–15263 RSC.
- M. Sasaki, B. Kabyemela, R. Malaluan, S. Hirose, N. Takeda, T. Adschiri and K. Arai, J. Supercrit. Fluids, 1998, 13, 261–268 CrossRef CAS.
- D. A. Cantero, M. Dolores Bermejo and M. José Cocero, Bioresour. Technol., 2013, 135, 697–703 CrossRef CAS PubMed.
- G. Gallina, Á. Cabeza, P. Biasi and J. García-Serna, Fuel Process. Technol., 2016, 148, 350–360 CrossRef CAS.
- P. Kilpeläinen, V. Kitunen, J. Hemming, A. Pranovich, H. Ilvesniemi and S. Willför, Nord. Pulp Pap. Res. J., 2014, 29, 547–556 CrossRef.
- T. Ingram, T. Rogalinski, V. Bockemühl, G. Antranikian and G. Brunner, J. Supercrit. Fluids, 2009, 48, 238–246 CrossRef CAS.
- S. G. Allen, D. Schulman, J. Lichwa, M. J. Antal, M. Laser and L. R. Lynd, Ind. Eng. Chem. Res., 2001, 40, 2934–2941 CrossRef CAS.
- M. Andérez-Fernández, E. Pérez, A. Martín and M. D. Bermejo, J. Supercrit. Fluids, 2018, 133, 658–664 CrossRef.
- M. Andérez-Fernández, S. Ferrero, J. P. S. Queiroz, E. Pérez, C. M. Álvarez, Á. Martín and M. D. Bermejo, J. Taiwan Inst. Chem. Eng., 2022, 139, 104504 CrossRef.
- M. I. Chinchilla, F. A. Mato, Á. Martín and M. D. Bermejo, Molecules, 2022, 27, 1652 CrossRef CAS PubMed.
- Z. Tang, X. Liu, Y. Yang and F. Jin, Chem. Sci., 2024, 15, 9927–9948 RSC.
- Y. Yang, H. Zhong, R. He, X. Wang, J. Cheng, G. Yao and F. Jin, Green Chem., 2019, 21, 1247–1252 RSC.
- M. Andérez-Fernández, E. Pérez, Á. Martín, J. McGregor and M. D. Bermejo, ACS Sustain. Chem. Eng., 2022, 10, 16948–16957 CrossRef PubMed.
- B. Qi, L. Di, W. Xu and X. Zhang, J. Mater. Chem. A, 2014, 2, 11885–11890 RSC.
- H. Zhang, G. Li, R. Nie, X. Lu and Q. Xia, J. Mater. Sci., 2019, 54, 7529–7540 CrossRef CAS.
- A. M. Ruppert, M. Jędrzejczyk, O. Sneka-Płatek, N. Keller, A. S. Dumon, C. Michel, P. Sautet and J. Grams, Green Chem., 2016, 18, 2014–2028 RSC.
- F. M. Yedro, D. A. Cantero, M. Pascual, J. García-Serna and M. J. Cocero, Bioresour. Technol., 2015, 191, 124–132 CrossRef CAS PubMed.
- G. Garrote, H. Domínguez and J. C. Parajó, Holz Roh- Werkst., 1999, 57, 191–202 CrossRef CAS.
- S. Kumar, U. Kothari, L. Kong, Y. Y. Lee and R. B. Gupta, Biomass Bioenergy, 2011, 35, 956–968 CrossRef CAS.
- D. A. Cantero, L. Vaquerizo, C. Martinez, M. D. Bermejo and M. J. Cocero, Catal. Today, 2015, 255, 80–86 CrossRef CAS.
- A. L. Ethier, J. R. Switzer, A. C. Rumple, W. Medina-Ramos, Z. Li, J. Fisk, B. Holden, L. Gelbaum, P. Pollet, C. A. Eckert and C. L. Liotta, Processes, 2015, 3, 497–513 CrossRef CAS.
- S. Liu, M. Martin-Martinez, M. A. Álvarez-Montero, A. Arevalo-Bastante, J. J. Rodriguez and L. M. Gómez-Sainero, Catalysts, 2019, 9, 733 CrossRef CAS.
- M. Gong, X. Li, L. Hu, H. Xu, C. Yang, Y. Luo, S. Li, C. Yin, M. Gan and L. Zhou, RSC Adv., 2024, 14, 21623–21634 RSC.
- D. A. Cantero, M. D. Bermejo and M. J. Cocero, J. Supercrit. Fluids, 2013, 75, 48–57 CrossRef CAS.
- X. Wang, Y. Yang, H. Zhong, T. Wang, J. Cheng and F. Jin, Green Chem., 2021, 23, 430–439 RSC.
Footnote |
| † Electronic supplementary information (ESI) available. See DOI: https://doi.org/10.1039/d4su00440j |
| This journal is © The Royal Society of Chemistry 2024 |

