 Open Access Article
Creative Commons Attribution 3.0 Unported Licence
Subnanometric Pt clusters dispersed over Cs-doped TiO2 for CO2 upgrading via low-temperature RWGS: operando mechanistic insights to guide an optimal catalyst design†
Guillermo
Torres-Sempere
 a,
Rubén
Blay-Roger
a,
Ligia A.
Luque-Álvarez
a,
Rubén
Blay-Roger
a,
Ligia A.
Luque-Álvarez
 a,
José L.
Santos
ab,
Luis F.
Bobadilla
a,
Laura
Pastor-Pérez
a,
Miguel A.
Centeno
a,
José L.
Santos
ab,
Luis F.
Bobadilla
a,
Laura
Pastor-Pérez
a,
Miguel A.
Centeno
 a,
Willinton Y.
Hernández
c,
Ibraheem
Yousef
 c,
José A.
Odriozola
 a and
Tomas
R. Reina
 *a
*a
aInorganic Chemistry Department and Materials Sciences Institute, University of Seville-CSIC, Sevilla, 41092, Spain. E-mail: tramirez@us.es
bKing Abdullah University of Science and Technology, Thuwal, Saudi Arabia
cAlba Synchrotron, Carrer de la Llum 2-26, Cerdanyola del Vallès, 08290, Barcelona, Spain
First published on 11th December 2023
Abstract
The RWGS reaction is gathering momentum as an effective route for CO2 valorisation and given its endothermic nature the challenge lies in the design of active low-temperature catalysts. Herein we have designed two catalysts based on subnanometric Pt clusters providing effective CO2 conversion and, more importantly, high CO selectivity in the low-temperature range. The impact of Cs as a dopant in the catalyst's formulation is crucial leading to full selectivity at 300 °C. The reaction mechanisms for the studied systems namely Pt/TiO2 and PtCs/TiO2 are significantly different due to the presence of the alkali promoter. The presence of Cs neutralises the hydroxide groups of the TiO2 surface, changing the reaction pathway. The Pt/TiO2 catalyst follows a redox mechanism where CO2 dissociates to CO in the oxygen vacancies, and then these vacancies are recovered by the migration of H2 by spill over phenomena. On the other hand, the Cs doped catalyst has two possible mechanism pathways: the (ii) formyl/acyl pathway, where –CHO species are formed and, depending on the reaction conditions, evolve to CO gas or oxygenated compounds, and (ii) frustrated Lewis pair (FLP) assisted CO2 reduction route, in which the FLP induces the heterolytic dissociation of H2 and the subsequent hydrogenation of CO2 to CO. The latter route enabled by Cs-doping combined with the subnanometric Pt domains seems to be responsible for the excellent catalytic behaviour leading to fully selective low-temperature RWGS systems and thus unlocking new possibilities for less energy demanding CO2 valorisation units based on RWGS.
1. Introduction
The extensive use of fossil fuels such as coal or natural gas is promoting the increase of carbon dioxide in our atmosphere, reaching historical concentration values of 411 ppm.1 There is much debate within the scientific community on how to address this pressing problem and among the alternatives, chemical CO2 recycling by its transformation into added value products is a preferred strategy.2 One of the most interesting ways of accomplishing this upgrading is CO2 hydrogenation, aiming at the production of long-chain hydrocarbons or methanol, among other highly valuable chemicals and fuels.3 Within the different possibilities, the RWGS reaction (eqn (1)) stands out as a direct route for gas-phase CO2 upgrading:4CO2 + H2 ![[left over right harpoons]](https://www.rsc.org/images/entities/char_21cb.gif) CO + H2O, ΔH298K = 41.2 kJ mol−1 CO + H2O, ΔH298K = 41.2 kJ mol−1 | (1) |
Indeed the RWGS yields syngas, which is an extraordinary and valuable platform for chemical and fuel synthesis at the industrial level.5 Furthermore, this reaction can use atmospheric CO2 through direct air-capture conversion schemes or CO2 emitted from industrial flue gases, reducing its concentration and contributing to a circular economy.6 In any case the successful implementation of the RWGS technology is intimately linked to green hydrogen availability, and in this sense our recent techno-economic assessment validates the RWGS route.7
The main drawback of RWGS is its endothermic nature, requiring high temperatures to achieve CO2 equilibrium conversions ranging between 10% and 50% at 200–500 °C, respectively, which entails high energy consumption and limits its commercial application.8 Furthermore, CO2 is a stable molecule, so active catalysts are needed for this process. Hence the challenge for the catalysis community can simply be formulated as follows: is there a way to design effective low-temperature RWGS catalysts? Well, here the major bottleneck is the reaction selectivity in the low-temperature operational window. Indeed, at low temperature, competitive processes such as the forward water–gas shift reaction (eqn (2)) and CO2 methanation (eqn (3)) are favoured:9
CO + H2O ![[left over right harpoons]](https://www.rsc.org/images/entities/char_21cb.gif) CO2 + H2, ΔH298K = −41.2 kJ mol−1 CO2 + H2, ΔH298K = −41.2 kJ mol−1 | (2) |
CO2 + 4H2 ![[left over right harpoons]](https://www.rsc.org/images/entities/char_21cb.gif) CH4 + 2H2O, ΔH298K = −165 kJ mol−1 CH4 + 2H2O, ΔH298K = −165 kJ mol−1 | (3) |
Current catalytic formulations for RWGS have failed to overcome the low-temperature limitation. For instance, noble metals such as Au,10 Pt,11 Pd12 or Rh13 and non-noble metals (Cu,14 Fe15 or Cr16) as the active phases over diverse oxidic supports (Al2O3, TiO2, SiO2, ZrO2 and CeO2)17–22 have been studied with successful results mainly at temperatures beyond 500 °C. Among these catalysts, Pt/TiO2 has shown interesting catalytic activity, specifically when small Pt particle size and high dispersion are achieved and when TiO2 morphology and its reducibility are optimised. In fact, Pt and TiO2 can present strong metal–support interaction (SMSI), which can produce reduction sites on the TiO2 surface.23,24 Furthermore, the application of Pt atomically dispersed on reducible metal oxides for RWGS exhibits an excellent opportunity to maximize the atom-utilization efficiency with well-defined single active sites and increase specific product selectivity. For instance, Zhao et al.11 found that atomically dispersed Pt species showed weak adsorption strength toward CO preventing subsequent hydrogenation into methane and promoting CO selectivity in RWGS. On the other hand, the role of promoters is deemed fundamental to suppress the competitive reactions and favour RWGS at low temperatures. Among the different reported promoters that can be used in RWGS catalysts, Cs is deemed promising in terms of selectivity and activity enhancement. This is ascribed to its large ionic radius and very low ionization potential energy, which can help in the activation and reduction of CO2.25,26
Beyond catalyst selection, the design of highly efficient RWGS catalysts requires the integration of spectroscopic and microscopic tools allowing for the design and synthesis of new materials with structural and chemical properties that are well defined. This can only be achieved with the use of complex and sophisticated techniques allowing the study of the catalyst, the gas phase and the adsorbed intermediates under the actual reaction conditions. A deep understanding of the reaction mechanism may help to improve the global process and to design optimal catalytic materials. Although the reaction mechanism is still a subject for debate, two principal pathways have been suggested to govern the RWGS reaction: the regenerative redox mechanism and the associative one.27 In the redox mechanism, hydrogen simply plays a role as a reducing agent without participating in the formation of intermediates. Usually, in this mechanistic route, the support presents redox properties. Therefore, the whole process would consist of the reduction of the support by the H2 and the reoxidation of the former by CO2, yielding CO.28 On the other hand, in the associative route, H2 participates in the formation of intermediate species such as formate by the reaction with CO2, and CO is formed by the decomposition of these intermediates.29
Under these premises, we have studied Pt/TiO2 and Pt–Cs/TiO2 catalysts for low-temperature RWGS. Herein, subnanometric Pt clusters close to single-atoms or isolated metal atoms dispersed on the solid support are intended to maximise the activity. The impact of Cs on the catalytic performance is discussed and thorough operando DRIFTS and UV-vis spectroscopy studies are performed shedding light on the different mechanistic routes and closing the debate about the role of Cs as a crucial promoter to deliver fully selective low-temperature RWGS catalysts.
2. Experimental details
2.1 Catalyst synthesis
The catalysts were synthesized by the wet impregnation method. For Pt/TiO2, the necessary amount of H2PtCl6 to obtain 1 wt% Pt was dissolved in excess water. The TiO2–P25 (Degussa) support was first washed with deionized water, filtered and calcined at 550 °C for 3 hours. Then, TiO2 was impregnated in a rotary evaporator with a solution of platinum precursor salt until the solvent was removed until dryness. Then the sample was dried at 115 °C for 48 h, and finally calcined at 550 °C for 3 h.For the synthesis of the Pt–Cs/TiO2 catalyst, the required amount of Cs2CO3 was added to part of the Pt/TiO2 sample, previously synthesised, to obtain 5 wt% of Cs. The solvent was then removed on a rotary evaporator and the sample was dried at 115 °C for 48 h. Finally, the catalyst was calcined at 550 °C for 3 h with a heating rate of 10 °C min−1.
2.2 Characterization methods
X-Ray diffraction (XRD) measurements were carried out on an X'Pert Pro PANalytic diffractometer with a Cu-Kα anode at room temperature, working at a voltage of 45 kV and a current of 40 mA. Diffractograms were obtained over a 2θ range of 20°–90° with a step size of 0.05° and a step time of 300 s.Raman spectroscopy measurements were carried out in a dispersive Horiba Jobin Yvon LabRam HR800 microscope equipped with a He–Ne green laser (532.14 nm) working at 5 mW, with a 600 g mm−1 grating. The microscope used a 50× objective and a confocal pinhole of 1000 μm. The Raman spectrometer was calibrated using a silicon sample reference.
The textural properties of the samples were analyzed by nitrogen adsorption–desorption measurements at liquid nitrogen temperature (77 K) in a Micromeritics Tristar II apparatus. Before the analysis, the samples were outgassed at 250 °C for 2 h.
High-resolution transmission electron microscopy (HR-TEM) and high-angle annular dark-field scanning transmission electron microscopy (HAADF-STEM) with element mapping analyses were performed on a FEI Talos F200S electron microscope using an acceleration voltage of 200 kV with a field emission filament and a side-mounted Ceta 16M camera equipped with an energy dispersive X-ray analysis system (EDX X-Max 80T, Oxford Instruments). Prior to the analysis, the samples were ex situ reduced under the flow of 50% H2/N2 at 550 °C for 3 h and then a few milligrams of the reduced catalyst were deposited directly on a 300 mesh holey carbon coated copper TEM-grid and introduced under the microscope.
2.3 Catalytic activity tests
The catalytic activity measurements were performed under steady-state conditions in a fixed-bed quartz tubular reactor (i.d. 9 mm) working at atmospheric pressure and at three different temperatures (300, 400 and 500 °C) for 24 h at each one. In a typical procedure, the catalyst was crushed in the 100–200 μm particle size range and supported between two plugs of quartz wool in contact with a thermocouple. Prior to each test, the catalyst was reduced in situ under a flow of 10% H2/N2 (50 mL min−1) at 550 °C for 1 h. The reaction mixture (H2/CO2/N2) was fed with a H2/CO2 molar ratio of 4 and a high weight hour space velocity (WHSV) of 30 L g−1 h−1. Reactants and reaction products were analysed by using an online gas chromatograph (Agilent 7890A) equipped with PPQ, MS-5A and SP-Sil 8 CB columns, and two TCD detectors and an FID detector. A coalescence filter coupled between FID and TCD modules was installed to avoid the presence of moisture in the GC columns. CO2 conversion and CO/CH4 selectivities were calculated by using the following equations: | (4) |
 | (5) |
Blank run tests were also performed in the absence of a catalyst and showed no conversion at the three reaction temperatures studied. In all the catalytic experiments conducted, the carbon balance in all catalytic experiments tally to 100% with an error within ±5%.
The ChemStations ChemCad software package was used to calculate the thermodynamic limits of the RWGS reaction at the studied temperatures. The Soave–Redlich–Kwong equation of state was used in a Gibbs reactor. Reactant inlet flows to the reactor are identical to the experimental parameters.
2.4 Operando DRIFTS measurements
Operando DRIFTS measurements were carried out using a reaction chamber (HVC-DRP, Harrick) mounted in a Praying Mantis (Harrick) DRIFTS optical system equipped with ZnSe windows. The spectra were collected using a Thermo Nicolet iS50 FTIR spectrometer equipped with an MCT detector in the range of 650–4000 cm−1 at 4 cm−1 resolution and an average of 64 scans per spectrum. The feed gas was controlled by using mass flow controllers (Bronkhorst). Before each experiment, the catalyst was activated at 400 °C with a flow of 50 mL min−1 of 10% H2/Ar for 1 h. The surface reaction was evaluated at five different temperatures (150, 200, 250, 300 and 350 °C), holding each for 10 min and feeding a total flow of 50 mL min−1 (20 mL min−1 of H2 and 5 mL min−1 of CO2 balanced in argon). In addition, transient studies were also conducted to gain further insights into the intermediates involved in the reaction. To do so, alternated pulses of both reactants 40% H2/Ar and 10% CO2/Ar surfaces were successively switched after 5 min periods for each one.2.5 In situ TPD-CO analysis
In situ TPD-CO followed by DRIFTS analysis of the calcined catalysts was performed using the same experimental system as that used for operando DRIFTS measurements. The spectra were recorded as an average of 64 scans with 4 cm−1 spectral resolution per spectrum. About 80 mg of finely ground calcined catalyst was loaded in the cell for each experiment and reduced in situ at 500 °C for 1 h with a flow of 10% H2/Ar. Then, the sample was saturated under a flow of 50 mL min−1 of 5% CO/Ar at 50 °C and subsequently purged with Ar. The temperature-programmed desorption of CO (TPD-CO) was performed by feeding a flow of Ar (50 mL min−1) and increasing the temperature from 50 °C to 400 °C at a rate of 5 °C min−1. The spectra were recorded in continuous series mode using OMNIC 9.1 software and the temperature was simultaneously monitored.2.6 In situ UV-visible analysis
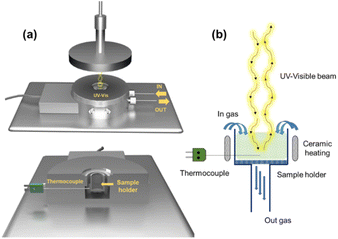
In situ UV-vis experiments were carried out using a modified version of the CCR1000 reaction cell from Linkam Scientific Instruments (Fig. 1a). An emission-collection probe with six radiant optical fibers and one data collection optical fiber was placed inside the reaction cell for spectroscopic analysis. The experimental setup allows for modifying both the temperature of the reaction cell and the composition of the reactive atmosphere. The catalyst is placed in a ceramic bed perpendicular to the radiation beam, which enables gas flow through its bed (Fig. 1b).The experiments were conducted under steady-state conditions in the range of 200–1000 nm. A commercial AVASPEC optical spectrometer (Avantes) with a DH-2000 lamp and a CCD detector was used. Barium sulfate was employed as the reference for analysis. The spectra were recorded by averaging 64 measurements with an integration time of 100 ms. The UV-vis operating experiments were conducted as follows: The temperature was gradually increased from 25 °C to 400 °C at a rate of 5 °C min−1, whereas spectra were captured every 5 minutes. These measurements were carried out within a reducing atmosphere consisting of 10% H2/Ar. Once the desired temperature of 400 °C was reached, the system was maintained at this temperature for 1 h under the same reducing atmosphere to ensure proper catalyst reduction. After the 1 h reduction period, the gas flow was switched from the reducing atmosphere to a reaction atmosphere composed of 10% CO2, 40% H2, and 50% Ar. This new gas mixture was maintained for an additional 60 minutes at a constant temperature of 400 °C. By following this experimental procedure, we were able to investigate and analyze the changes in the UV-vis spectra of the sample under different temperature and gas atmosphere conditions. These experiments provide valuable insights into the activity and selectivity of the studied RWGS catalysts.
3. Results and discussion
3.1 Structural and textural properties
Fresh samples were characterized by several physicochemical techniques to gather relevant information concerning structural and chemical properties of the design materials. Fig. 2a shows the normalized XRD patterns of Pt/TiO2 and Pt–Cs/TiO2 after calcination at 550 °C for 3 h. As can be observed, both catalysts show the typical diffraction lines of anatase (JCPDS 73-1764) and rutile (JCPDS 78-1510) phases. In both cases the tetragonal anatase phase is predominant. It is noteworthy that no diffraction signals corresponding to platinum species were detected in the XRD patterns of both Pt/TiO2 and Pt–Cs/TiO2 catalysts, although the platinum loading was 1 wt%, which emphasizes the small dimension of platinum particles which will be discussed later. Meanwhile, it must also be remarked that neither caesium phase was found in PtCs/TiO2 suggesting that these species are highly dispersed on the support surface.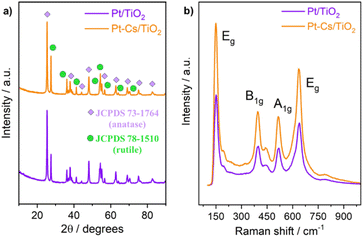 | ||
| Fig. 2 (a) XRD patterns and (b) Raman spectra of both Pt/TiO2 and Pt–Cs/TiO2 catalysts after calcination at 550 °C in air. | ||
Fig. 2b shows the Raman spectra of both calcined catalysts. Note that both spectra are mainly constituted by four bands at 150, 360, 500 and 630 cm−1, which are the four characteristic Raman active vibrational modes of the tetragonal anatase phase with symmetries Eg, B1g, A1g and Eg respectively. On the other hand, only one Raman active mode of the rutile phase, with symmetry Eg, can be observed at 450 cm−1 and shows a low intensity.30 The features typical of rutile are less intense and they cannot be clearly assigned. Therefore, these results indicate that both catalysts are composed of a combination of anatase and rutile phases, anatase being the predominant phase. This observation is in concordance with the XRD results. Pt species and/or Cs phases are hardly detected by Raman spectroscopy.
Fig. S1† presents the N2 adsorption–desorption isotherms of the calcined samples. Both catalysts are mesoporous materials with a type IV isotherm according to the IUPAC classification31 and Cs does not seems to impact the overall textural features. Table 1 includes the specific surface area, total pore volume and pore size of fresh TiO2 and the synthesized catalysts. Fresh TiO2 surface area is 52 m2 g−1 while Pt/TiO2 and Pt–Cs/TiO2 have a smaller surface area of 38 and 40 m2 g−1, respectively. Meanwhile, the pore volume and the pore sizes showed a similar decrease with the incorporation of Pt and Cs.
| Sample | S BET (m2 g−1) | Pore volume (cm3 g−1) | Pore size (nm) | wt% Pt | wt% Cs |
|---|---|---|---|---|---|
| TiO2 P25 | 45 | 0.39 | 29 | — | — |
| Pt/TiO2 | 38 | 0.31 | 25 | 0.6 | — |
| Pt–Cs/TiO2 | 40 | 0.29 | 24 | 0.8 | 4.8 |
3.2 Verification of highly dispersed Pt clusters
Fig. 3a and b illustrate the HRTEM micrographs of both reduced Pt/TiO2 and Pt–Cs/TiO2 catalysts. As can be observed, the crystallographic plane spacing of both rutile (101) and anatase (101) tetragonal phases is 2.52 and 3.54 Å, respectively, for both samples suggesting that the presence of Cs does not affect the crystal structure of TiO2. The absence of crystal planes related to caesium phases in Pt–Cs/TiO2 suggests that this element could be dispersed forming surface amorphous phases. On the other hand, it can be noticed that both samples comprise isolated Pt sites or sub-nanoclusters smaller than 0.5 nm in diameter (circles marked in Fig. 3a and b). As this is the case, we can hardly estimate the average particle size of the Pt sub-nanometric particles in any sample. HAADF-STEM images (Fig. S2 and S3†) prove the existence of highly dispersed Pt on a TiO2 support without obvious aggregation of Pt atoms in both reduced catalysts. It is also evident that caesium is well dispersed on the Pt–Cs/TiO2 catalyst (Fig. S3†). The results obtained reveal the presence of subnanometric Pt clusters or isolated Pt sites with an excellent dispersion over the support for both prepared catalysts confirmed by the mapping compositional presented in Fig. S2 and S3.† In addition to this, Table 1 also includes the Pt and Cs percentages obtained by EDX analysis and the values obtained are very close to the nominal ones confirming the metallic and promoter contents in the final catalysts.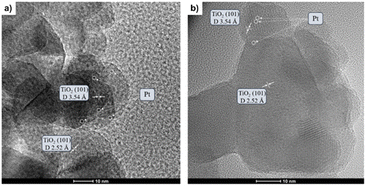 | ||
| Fig. 3 HR-TEM micrographs of both Pt/TiO2 (a) and PtCs/TiO2 (b) catalysts reduced at 550 °C in 50% H2/N2 for 3 h. | ||
3.3 RWGS catalytic performance
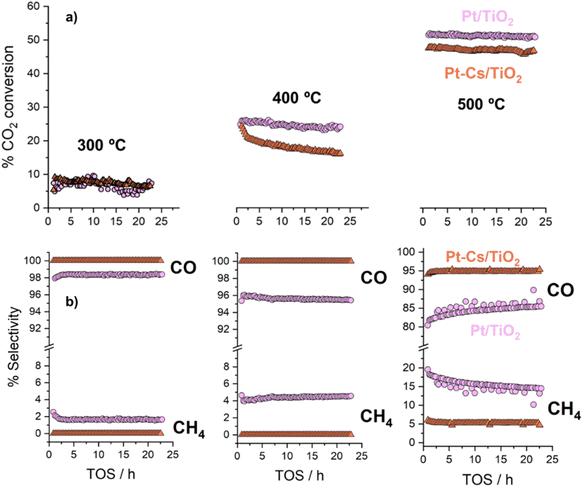
The as-prepared catalysts were evaluated in the reverse water–gas shift (RWGS) reaction. The catalytic activity was recorded at different temperatures (300, 400 and 500 °C) for 24 h at each temperature. First, CO2 conversion of Pt/TiO2 and Pt–Cs/TiO2 is shown in Fig. 4a. At higher temperatures (400 and 500 °C), a slightly higher CO2 conversion for the un-promoted catalyst is evidenced while at low temperature (300 °C) similar conversions were reached for both catalysts. From Fig. 4a, it is interesting to note that the conversion of Pt–Cs/TiO2 decreased drastically from 26 to 21% during the first 3 h and then only decreased very slowly. One of the possible reaction mechanisms for RWGS involves CO2 adsorption on the basic sites of the support followed by a reaction to form carbonate species and the subsequent reduction of these to CO.22 In agreement with the literature, the presence of basic sites such as Cs dispersed on the support leads to the formation of active carbonates that require higher temperatures to be reduced, and the saturation of these sites could explain the initial decrease in the conversion. As will be discussed later in the manuscript, the Cs sites in the vicinity of Pt sub-nanoclusters play a key role in the reaction pathway. Herein, the most interesting observation is related to the CO selectivity as shown in Fig. 4b. Our Cs-doped systems reach 100% selectivity towards CO at very low temperatures (300–400 °C) and 95% selectivity towards CO is reached at 500 °C. In contrast, the selectivity of the non-doped catalyst slightly decreases with the temperature (Fig. 4b). We can then infer that the addition of Cs has a strong impact on the end-product distribution and provokes a remarkable shift in the selectivity. Let us recall at this point that the expected trend would have been a high selectivity in the low-temperature range due to the predominance of CO2 methanation which is an exothermic reaction. Our outstanding CO selectivity clearly associated with Cs as the dopant is a highly commendable result opening the horizons for a new family of 100% CO-selective catalysts that can be implemented in RWGS units running at as low as 300 °C. Such a strategy results in a formidable impact in terms of process cost saving (lower CAPEX and OPEX).The promoter effect can be better noticed in Fig. 5a and b where the specific activity to CO and CH4, respectively, of both catalysts is presented. In addition, space-time yield (STY) for Pt/TiO2 and PtCs/TiO2 has been calculated (Fig. S4†). While both catalysts present a similar production of CO (1.86 and 1.88 mol of CO per s per m3 at 500 °C, respectively), for the production of CH4 the difference is more evident (0.33 and 0.11 mol of CH4 per s per m3 at 500 °C). These results are in fair agreement with previous studies where alkali metals weaken the CO–surface interaction, hindering further hydrogenation of CO to CH4.32–34 Furthermore, Zhao et al.11 studied how Pt particle size and dispersion affect the CO selectivity, concluding that Pt species with large sizes exhibited stronger adsorption towards CO than atomically dispersed Pt species favouring the hydrogenation of CO to CH4. Even though the Pt particle size of both catalysts is similar revealing the presence of sub-nanometric Pt clusters getting close to single atom domains, it can be seen in Fig. 5 that the addition of Cs seems to inhibit CH4 formation. Silva et al.35 attributed this effect to the strong interaction that is formed between reduced platinum and basic caesium oxide species.
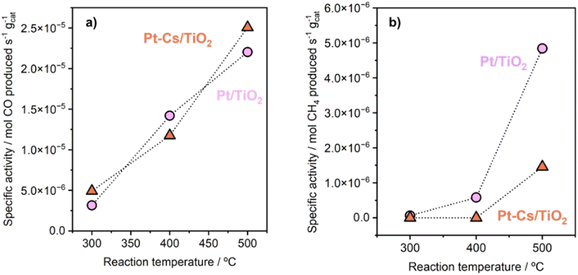 | ||
| Fig. 5 Specific activity of Pt/TiO2 and Pt–Cs/TiO2 catalysts for RWGS in terms of production of (a) CO and (b) methane. Reaction conditions: H2/CO2 = 4, P = 1 bar, and WHSV = 30 L g−1 h−1. | ||
3.4 Elucidating the reaction intermediates: operando DRIFTS studies
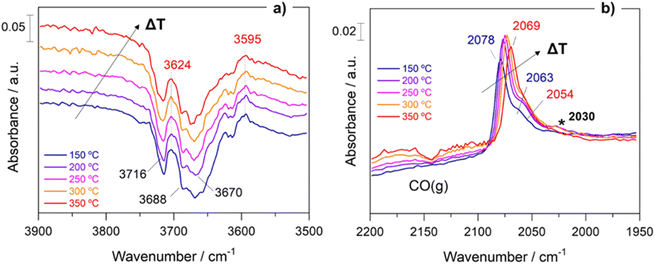
Within the aim of investigating the involved surface species and obtaining relevant aspects of the RWGS mechanism, the surface reaction was evaluated under working conditions by means of DRIFTS measurements. For the sake of consistency, the reaction conditions used in the operando analysis were analogous to those used in a conventional fixed-bed reactor.Fig. S5† presents the DRIFTS spectra obtained for both catalysts after activation under 50 mL min−1 of 10% H2/Ar at 400 °C for 1 h. It is remarkable that the addition of Cs neutralizes all the surface hydroxyl groups (bands at 3716 cm−1 and 3670 cm−1) of TiO2. This first piece of evidence suggests that the reaction pathways must be different for both catalysts (vide infra). Fig. 6 shows the evolution of the spectra for Pt/TiO2 under reaction conditions in the 150–350 °C temperature range. As can be noticed in Fig. 6a, the region of hydroxyl groups (3800–3500 cm−1) is characterized by the disappearance of five different features related to hydroxyls bonded to Ti4+ and Ti3+ with different coordination. The bands at 3716 cm−1 and 3688 cm−1 are presumably attributed to isolated terminal OH groups, while the bands at 3624 cm−1, 3596 cm−1 and 3414 cm−1 are typical of OH groups bonded forming bridges.36 Furthermore, the band at 3670 cm−1 is associated with OH bonded to Ti3+, and it is noteworthy that it disappears with the increase in temperature while the band at 3688 cm−1, associated with OH bonded to Ti4+ simultaneously increases. This clearly reveals that oxygen vacancies are formed on titania in good agreement with the literature.27
On the other hand, the bands located in the region between 2080 and 2060 cm−1 correspond to CO adsorbed on different Pt active sites.37 Stakheev et al.38 studied the electronic state and localization of supported Pt atoms by CO adsorption. These authors reported that the bands at 2078 and 2059 cm−1 are related to CO linearly adsorbed on accessible Pt sites composed of only a few atoms involving different degrees of metal–support interaction or different particle geometries. As shown in Fig. 6b, these bands shift to lower frequencies with the increase in temperature. It is noteworthy that the intensity of the CO bands hardly decreases with the temperature suggesting that these CO peak redshifts cannot be attributed to the CO coverage. We believe that this bathochromic peak shift is mainly related to the formation of oxygen vacancies and the transfer of electrons to the Pt particles. When the temperature is increased, electrons in the valence band of titania are transferred to the conduction band generating holes in the valence band. Then these electrons can be transferred to Pt atoms located on the metal/support interface weakening the C–O bond and shifting the CO bands to lower wavenumbers without decreasing the intensity. A similar observation was reported by Shuai Shen et al.39 but in this study the electron transfer was induced by light radiation instead of temperature increment. Furthermore, the appearance of another band at 2030 cm−1 above 250 °C is also remarkable. This feature is related to the presence of CO adsorbed on electron-rich Pt sites in which carbon overlayers were deposited.40 The presence of this band indicates that CO can be dissociated into C* and O* creating carbon deposits on the Pt particles, and the hydrogenation of C* to form CH* species is responsible for the production of methane. This way we explain the production of methane in the Pt/TiO2 catalyst, a phenomenon that can be ruled out at low temperatures when Cs is added as the promoter.
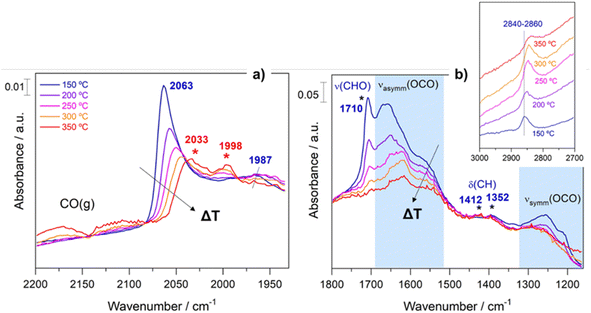
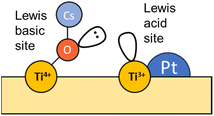
In an analogous manner, Fig. 7 displays the evolution of the spectra of Pt–Cs/TiO2 under working conditions as a function of the reaction temperature. The most important difference found for this catalyst was the absence of hydroxyls. Fig. 7a shows the presence of bands in the 2100–1900 cm−1 region, indicating the formation of carbonyl adsorbed species. The band at 2063 cm−1 is typically ascribed to CO linearly adsorbed on Pt sites and this band disappears progressively as reaction temperature increases. In this case, the bathochromic shift is mainly related to the lower coverages of CO when the reaction temperature is increased. On the other hand, Fig. 7a evidences the emergence of two bands at 2033 and 1998 cm−1 when the temperature is increased above 300 °C. These two bands are ascribed to carbonyl adsorbed species on Pt sites covered by carbon deposits and explain the formation of small amounts of methane at higher temperatures in agreement with the catalytic results (Fig. 5). It should be mentioned that the CO stretching vibrations observed in the Cs-promoted sample appear at lower frequency than that of the unpromoted sample. This fact is related to the back donation effect of Cs in intimate contact with Pt atoms.41 Due to the ionic ratio of Cs, it may be assumed that caesium species are located on the perimetric sites of Pt particles and dispersed on the support. Moreover, the presence of a band at about 1987 cm−1 can be observed at lower temperatures, whose presence requires a more detailed explanation. This feature is ascribed to CO adsorbed on very small Pt clusters.42 Calabrese et al.43 reported that platinum carbonyl cluster dianions of general formula [Pt3(CO)3(μ2-CO)3]n2− (n = 2, 3, 4 and 5) present a characteristic IR band at this frequency. The HRTEM micrographs (Fig. 3) revealed that Pt particles are smaller than 1 nm (around 20 atoms) suggesting that the presence of a platinum dimers or trimers cannot be discarded. Remarkably, this feature was hardly observed in the unpromoted catalyst suggesting that the presence of caesium stabilizes the formation of platinum carbonyl cluster dianions. Recently, Li et al.44 reported that dual-active sites composed of Pt clusters and frustrated Lewis pairs (FLPs) can be created on the surface of CeO2 to boost the performance of RWGS at low temperatures. In another recent study, Jeong-Cheol Seo et al.45 suggested by means of operando FTIR and density functional theory (DFT) calculations that FLPs can be formed in Pt/Na-zeolite catalysts and these centres could effectively stabilize the intermediate responsible for CO production in the RWGS reaction. Hence, the concept of “surface frustrated Lewis pairs” refers to proximal Lewis acid–Lewis base sites occurring on metal oxide surfaces, which have been reported in the literature to be responsible for driving diverse heterogeneous catalytic reactions.46 In this line, we believe that surface FLPs constituted by Cs–O–Ti4+ (Lewis base) sites and Ti3+ (Lewis acid) are presumably created at the metal/support perimeter in which titania is highly defective as depicted in Fig. 8. Ghuman et al.47 demonstrated that oxygen vacancies are required to form these surface FLP sites, and they are highly efficient to simultaneously dissociate H2 and activate CO2 molecules. The reduction of CO2 leads to CO adsorbed on FLPs, which is faster for recovering the active sites and preventing further hydrogenation to CH4.44,45 In other words, Cs is acting not only as an electronic dopant but also as a structural promoter favouring highly dispersed Pt nanoclusters and ultimately boosting the selectivity in RWGS at low temperature. At higher temperatures, the energy barrier for CO dissociation is overcome, and methane formation cannot be inhibited. Furthermore, Fig. 7b shows the formation of carbonate species at lower temperatures evidenced by the features appearing between 1650 and 1500 cm−1 and 1300–1100 cm−1, which are related to symmetric and asymmetric stretching of –OCO carbonate species, respectively.48 It is well-known that Cs is an alkaline species that increases the surface basicity of the material and, consequently, tends to form carbonate like-compounds.32 As mentioned above, Cs remarkably neutralizes all hydroxyl groups. It is well known that formate species are formed by reduction of bicarbonate species, and bicarbonate formation involves the reaction of CO2 with OH. Therefore, the formate route must be apparently ruled out as a possible mechanism of RWGS for Pt–Cs/TiO2.
On the other hand, new species have been detected and proposed as intermediates in this study. Fig. 7b shows bands initially observed at 2840–2860 (Fig. 7b inset), 1710, 1410, and 1352 cm−1 emerging simultaneously. These vibration modes are related to C–H stretching, C![[double bond, length as m-dash]](https://www.rsc.org/images/entities/char_e001.gif) O stretching, CHO scissors and C–H flexions, respectively. These features may be assigned to oxygenated adsorbed species (–CHO) such as acyl or acetyl species.49 Moreover, it is evident that these species undergo some structural changes and at higher temperatures are decomposed into CO. This fact could be explained by means of the following sequence: CO*–H* → formyl → acyl → CO gas. The experimental evidence of these intermediates is fundamental to establish a pathway route. So far, these species have been proposed by means of density functional theory (DFT) calculations,50 but they have hardly been experimentally observed. The formation of oxygenated compounds via insertion of carbonyl has been proposed for Pt based catalysts in CO hydrogenation, so it is reasonable to expect that these intermediates can be formed.51 Furthermore, an increase in the pressure likely leads to the formation of oxygenated compounds against CO, and this opens a new horizon for the production of oxygenated compounds such as alcohols, ketones, carboxylic acids, etc.
O stretching, CHO scissors and C–H flexions, respectively. These features may be assigned to oxygenated adsorbed species (–CHO) such as acyl or acetyl species.49 Moreover, it is evident that these species undergo some structural changes and at higher temperatures are decomposed into CO. This fact could be explained by means of the following sequence: CO*–H* → formyl → acyl → CO gas. The experimental evidence of these intermediates is fundamental to establish a pathway route. So far, these species have been proposed by means of density functional theory (DFT) calculations,50 but they have hardly been experimentally observed. The formation of oxygenated compounds via insertion of carbonyl has been proposed for Pt based catalysts in CO hydrogenation, so it is reasonable to expect that these intermediates can be formed.51 Furthermore, an increase in the pressure likely leads to the formation of oxygenated compounds against CO, and this opens a new horizon for the production of oxygenated compounds such as alcohols, ketones, carboxylic acids, etc.
In order to confirm the formation of a –CHO like intermediate in the RWGS reaction, transient studies by switching CO2 and H2 streams were performed. This study provides relevant information on the reaction intermediates since the reaction is carried out under non-steady state conditions, thus extending the reaction intermediate lifetime. For this purpose, the reaction temperature was fixed at 300 °C to ensure low conversions and high surface concentration of intermediate species. Fig. 9a displays the temporal evolution of DRIFT spectra for Pt/TiO2 when both reactants are switched each 5 min. As can be noticed, the introduction of CO2 leads to the formation of new features in the carbonyl region (2100–1900 cm−1). These bands correspond to carbonyl adsorbed species with different coordination on Pt particles as discussed above. It should be noted that during the reduction step the carbonyls at 2075, 2054 and 2030 cm−1 are released much faster than the carbonyl at 2069 cm−1. This reveals that the latter is more strongly adsorbed and likely acts as an intermediate for methane formation. On the other hand, it is also evident that the hydroxyl species (band in the 3800–3500 cm−1 range) are also contributing to the reaction. However, the identification of these bands is not straightforward since they are masked by gas-phase CO2 combination bands (2ν2 + ν3 and ν1 + ν3). Thus, these observations reveal that CO2 is dissociated into CO* and O* on the HO-□-Ti3+ sites, being □ an oxygen vacancy which is oxidized by O*. Then when the CO2 feed is substituted by the H2 feed, molecular hydrogen is dissociated into 2H* on Pt sites, and H* migrates by spill over phenomena recovering the HO-□-Ti3+ sites for a new cycle. It is also noticed that the bands associated with more labile Pt carbonyls disappeared and CO gas is released. Likewise, strongly adsorbed Pt carbonyl is able to dissociate C into C* species which are further hydrogenated into methane or built up in the metallic sites. Thus, it cannot be ruled out that Pt sites are covered by a layer of C* species after multiple cycles.52
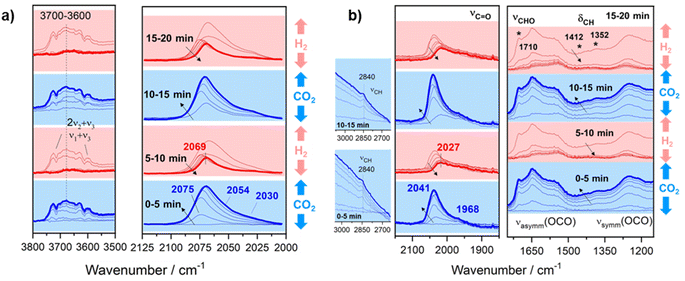 | ||
| Fig. 9 Temporal evolution of DRIFT spectra on (a) Pt/TiO2 and (b) Pt–Cs/TiO2 catalysts by switching 50 mL min−1 10% H2/Ar and 50 mL min−1 10% CO2/Ar each 5 min at 300 °C. | ||
Concerning the Pt–Cs/TiO2 catalyst, Fig. 9b shows the temporal evolution of DRIFT spectra during successive switching of both H2 and CO2 reactants over the Cs-promoted sample. It can be observed that under a 10% CO2/Ar stream caesium carbonates (1650–1200 cm−1) and Pt carbonyl species (bands at 2100–1900 cm−1) are formed. On the other hand, the emergence of the bands attributed to the above formyl/acyl species (2841, 1794, 1420 and 1392 cm−1) is also observed. This reveals that, effectively, these species are intermediates of the RWGS reaction on Cs-promoted samples. When H2 is introduced, all these oxygenated species disappeared, and CO gas is released. However, a band at 2027 cm−1 still remains after 5 min of reduction. As mentioned above for the unpromoted catalyst, this band corresponds to carbonyls more strongly adsorbed on Pt sites and this intermediate can be further dissociated or hydrogenated into methane at higher temperatures. On the basis of these results, we can conclude that at low temperatures Cs promotes two possible reaction pathways: the (i) formyl/acyl pathway, in which –CHO species are formed and evolve to CO gas, and (ii) frustrated Lewis pair assisted CO2 reduction route, in which FLPs induce the heterolytic dissociation of H2 and the subsequent hydrogenation of CO2 to CO. Although caesium carbonates are also formed during the reaction at lower temperatures, we have observed that the specific activity of CO production in both catalysts is identical (Fig. 5a). This indicates that these carbonates cannot be reduced to CO in Pt–Cs/TiO2 and thus these species are mere spectators.
3.5 In situ TPD-CO followed by DRIFTS analysis
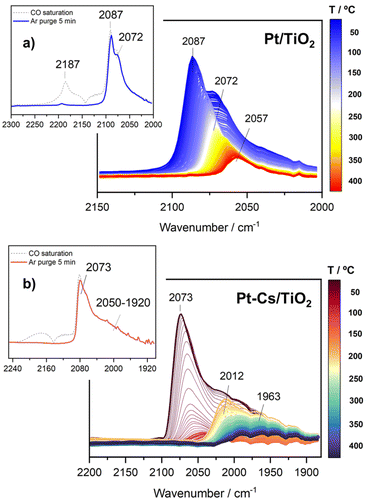
In situ TPD-CO followed by DRIFTS analysis was carried out to obtain information about the desorption behaviour of CO in both catalysts. For this purpose, the activated catalysts were saturated with CO at 50 °C and subsequently purged with Ar. The evolution of the IR spectra with the desorption temperature is shown in Fig. 10a and b. As can be observed in the inset of Fig. 10a, the Pt/TiO2 sample is mainly characterized by two intense bands at 2087 and 2012 cm−1. As mentioned above, these bands correspond to CO linearly adsorbed on Pt active sites with different shapes and/or geometries. A band at 2187 cm−1 was also found which decreased significantly after purging with Ar for 5 min. This feature is related to CO adsorption forming one type of Ti4+–CO carbonyls.53 From Fig. 10a, it is noteworthy that both bands at 2087 and 2072 cm−1 disappeared progressively as temperature increased and a band at 2057 cm−1 remained. As stated above, this band corresponds to CO adsorbed on electron-rich Pt sites surrounding carbon overlayers formed by CO dissociation.40Concerning the doped Pt–Cs/TiO2 catalyst, the inset of Fig. 10b displays the IR spectra recorded after CO saturation and Ar purging for 5 min at 50 °C. Remarkably, this catalyst does not show the band at high wavenumber (2184 cm−1) characteristic of CO adsorbed on acidic Lewis sites. This fact is attributed to the neutralization of acidic sites with the introduction of caesium. Furthermore, the spectra show a high intensity peak at 2073 cm−1 with a wide shoulder at 2050–1920 cm−1. The more intense band is ascribed to CO linearly adsorbed on Pt sites.39 One can notice that this band disappeared completely above 150 °C (Fig. 10b). In comparison to the unpromoted sample, this CO stretching vibration appears at a lower frequency due to the back donation effect of Cs in intimate contact with Pt atoms.41 Likewise, it should be stressed that the broad band (2050–1920 cm−1) also disappeared at 150 °C but it emerges again progressively as the temperature increases. The formation of these species within the studied temperature can be attributed to carbonate decomposition on caesium sites (not shown in Fig. 10b). These bands remain stable until 350 °C, and then their intensity decreases with temperature. It is noteworthy that even at 400 °C these bands are still present on the surface. In agreement with the latter discussion, this set of bands is attributed to CO adsorbed on very small Pt clusters which are thermally very stable. Based on these observations, we can conclude that the presence of caesium stabilizes small particles of platinum and avoids the dissociation of CO into carbonaceous species.
3.6 Role of vacancies: in situ UV-visible analysis
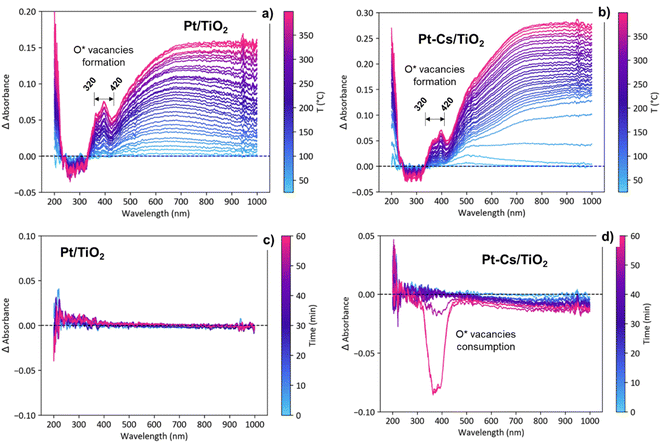
Fig. S6† displays the evolution UV–vis spectra for both catalysts during activation in 10% H2 as a function of the temperature and under RWGS reaction conditions at 400 °C as a function of the reaction time. As shown in Fig. S6a and b,† during the activation process in 10% H2/Ar, a new band emerges between 320 and 420 nm indicating the reduction of Ti4+ to Ti3+ and thus the formation of oxygen vacancies.54 To emphasize these changes, Fig. 11a and b present the evolution of the difference spectra with temperature during the activation pretreatment for both catalysts. The spectrum recorded at 25 °C was taken as the reference. Note that an increasing level of formation of oxygen vacancies was evidenced during heating to 400 °C, supported by the intensity increase of a positive band in the 320–420 nm region, suggesting a bandgap modification related to the contribution of the formed Ti3+ levels.27 These changes associated with the formation of oxygen vacancies are evident in both catalysts (Fig. 11a and b), exhibiting a comparable intensity increase. This similarity suggests that the formation of vacancies occurs in both catalysts to a similar extent during the reduction pretreatment.On the other hand, the emergence of a broad band ranging from 500 to 800 nm, extending into the near-IR zone (Fig. 11a and b), is ascribed to the surface plasmon resonance (SPR) effect of metallic particles.55 This phenomenon occurs as a result of the collective resonance of small Pt clusters, aligning with the tiny clusters observed through HRTEM (Fig. 3). The slight bathochromic shift observed during the reduction process in the Pt–TiO2 catalyst is associated with the coalescence of neighbouring small Pt-clusters, forming slightly larger aggregates.56,57 Nevertheless, the lack of band displacement over time during 1 h in s reduction atmosphere at 400 °C (not shown) affirms the stability of the presumably formed nanoparticles due to the Pt–TiO2 strong metal support interaction effect (SMSI effect).58
The transition from the activation (H2/Ar) to reaction stream (H2/CO2/Ar) leads to distinct evolutions of the UV-vis spectra in both catalysts. As shown in Fig. S6c† and 11c, the Pt–TiO2 catalyst exhibits no discernible changes in the spectra when exposed to the reaction atmosphere. This observation implies that oxygen vacancies are being consumed and cyclically regenerated. This hypothesis aligns with the results obtained from DRIFTS. Furthermore, the lack of evolution in the Pt-plasmon suggests long-term stability of the platinum clusters. By contrast, upon introducing caesium to the catalyst, oxygen vacancy consumption is observed during prolonged reaction times with an intensity comparable to that associated with vacancy formation (Fig. S6d† and 11d). The decrease in band intensity at extended reaction times suggests vacancy consumption and an inefficient regeneration process. At shorter reaction times, vacancies are likely playing an active role in the reaction due to their initial formation.41 Eventually, the vacancies become blocked, compelling the reactive pathway to follow an alternative mechanism. In agreement with the operando DRIFTS results, these observations are consistent with the proposed formation of frustrated Lewis pairs, which requires the presence of oxygen vacancies as active centers for dissociating H2 and reducing CO2 into CO. The selectivity of the reaction is closely related to the catalyst's ability to activate H2 and CO2 molecules, as well as the mechanistic pathway followed. The catalyst's propensity to donate electron density to the reactants directly influences its performance in the reaction. Alkali promoters have a high tendency to form surface titanates, which exhibit a more insulating character compared to P25 titania. By employing the Tauc plot method,59 the calculation of the band gap indicates a 0.1 eV difference between the two catalysts before activation (Fig. S7†). This discrepancy highlights the insulating effect resulting from caesium doping in the catalyst. This consistent disparity, observed throughout the activation and reaction processes, aligns with the formation of methane. The formation of methane relies on a catalyst with enhanced conductivity to facilitate both CO2 activation and H2 spillover. The addition of caesium further enhances the insulating nature of the catalyst, thereby diminishing its hydrogenation capacity and favouring the CO desorption. The smaller band gap of Pt–TiO2 is directly related to higher catalyst activity towards CO dissociation and subsequent hydrogenation of C* into methane.
3.7 Mechanistic insights
From these observations, we deduce the reaction schemes shown in Fig. 12 for both catalysts. In the case of Pt/TiO2, platinum particles are firmly anchored on the surface of titania under the reaction conditions due to the interaction between Pt and TiO2, through which abundant stable active sites are available. Furthermore, active surface oxygen vacancies were in situ generated and consumed circularly during the reaction, which facilitated the activation of CO2 and improved the catalytic efficiency. This pathway corresponds to the classical redox mechanism. However, the possible formation of carbon layers can be a cause of deactivation that requires a stability study.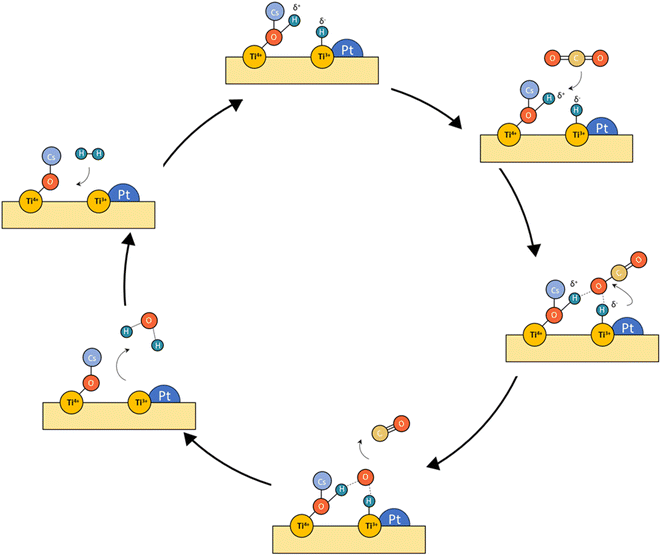 | ||
| Fig. 12 Tentative reaction mechanism proposed for the concept of frustrated Lewis pairs (LFPs) for Pt–Cs/TiO2. | ||
Concerning the Pt–Cs/TiO2 catalyst, it must be stated that two possible routes are possible: the (i) formyl/acyl pathway, in which –CHO species are formed and, depending on the reaction conditions, evolve to CO gas or oxygenated compounds and (ii) frustrated Lewis pair assisted CO2 reduction, in which FLPs are formed between Cs–O–Ti4+ sites and Ti3+ at the metal/support peripheral sites. These FLP sites are highly active to heterolytically dissociate hydrogen on the Pt clusters with high electronic density, and CO2 can be easily activated on the Cs–O–Ti3+ basic sites. In this case, the presence of Cs close to Pt particles favours the CO release and inhibits the formation of C* species by CO dissociation at lower temperatures. Fig. 12 includes a schematic representation for this proposed reaction pathway. This is a highly important aspect to develop a stable catalyst for low-temperature RWGS.
4. Conclusions
Running the RWGS reaction at low-temperature represents a step ahead in gas-phase CO2 conversion reactions. This process entails a big challenge which is the suppression of the competitive methanation process, and our study showcases that Cs-promoted Pt/TiO2 is a promising catalyst to circumvent this challenge. Our operando analysis casts lights on the exceptional behaviour of Cs as a dopant which enables different mechanistic pathways when compared to the unpromoted system. More specifically, Pt/TiO2 works under a redox mechanism where CO2 dissociates to CO in the oxygen vacancies. Then, H2 migrates by spill over recovering these oxygen vacancies so they are in situ generated and consumed circularly during the reaction. On the other hand, the Pt–Cs/TiO2 mechanism allows two possible pathways: the (i) formyl/acyl pathway, where –CHO species are formed and, depending on the reaction conditions, evolve to CO gas or oxygenated compounds, and (ii) frustrated Lewis pair assisted CO2 reduction route, in which FLPs induce the heterolytic dissociation of H2 and the subsequent hydrogenation of CO2 to CO. Our results demonstrate that Cs inhibits the formation of C* on Pt particles at low temperature, which is an important approach to design a low temperature catalyst for the RWGS reaction. The impact of Cs on the reaction pathway and ultimately on the activity and selectivity is mainly due to an electronic effect being an electropositive species that can donate electrons and create electronic rich sites to activate the reactants. However, beyond electronic promotion Cs is also a structural promoter enhancing Pt nanocluster dispersion leading to high performing RWGS materials.All in all, this work charts a path to design highly effective multicomponent catalysts for low-temperature RWGS where Cs plays a crucial role as a promoter. Beyond materials chemistry, optimised catalysts for low-RWGS open a route for process engineering when it comes to integrating RWGS units within CO2 utilization schemes saving capital and running costs, thus representing a tangible example for how advanced catalysts are essential for the transition towards a circular economy.
Author contributions
G. Torres-Sempere: conceptualisation, methodology, validation, formal analysis, investigation, writing – original draft. R. Blay: methodology, validation, formal analysis, investigation, visualisation. J. L. Santos: investigation, methodology. L. A. Luque: investigation. L. F. Bobadilla: methodology, formal analysis, resources, writing – original draft, writing – review & editing, visualisation, supervision. L. Pastor-Perez: resources, supervision, review. M. A. Centeno: investigation. W.·Y: Hernández: investigation. I. Yousef: investigation, methodology, validation, formal analysis. José Antonio Odriozola: formal analysis, resources, funding acquisition. Tomás R. Reina: conceptualisation, methodology, resources, writing – review & editing, supervision, project administration, funding acquisition.Conflicts of interest
The authors declare no conflicts of interest.Acknowledgements
The team at the University of Seville acknowledges financial support from the Spanish Ministry of Science through the projects NICER-BIOFUELS (ref: PLEC2021-008086), sponsored by MCIN/AEI/10.13039/501100011033 Next Generation Europe and SMART-FTS (ref: PID2021-126876OB-I00). Authors also acknowledge access to ALBA's facilities and support provided by ALBA's staff.References
- J. Hansen, M. Sato, R. Ruedy, K. Lo, D. W. Lea and M. Medina-Elizade, Proc. Natl. Acad. Sci. U. S. A., 2006, 103, 14288–14293 CrossRef CAS PubMed.
- J. Ma, N. Sun, X. Zhang, N. Zhao, F. Xiao, W. Wei and Y. Sun, Catal. Today, 2009, 148, 221–231 CrossRef CAS.
- M. Mikkelsen, M. Jørgensen and F. C. Krebs, Energy Environ. Sci., 2010, 3, 43–81 RSC.
- L. Yang, L. Pastor-Pérez, S. Gu, A. Sepúlveda-Escribano and T. R. Reina, Appl. Catal., B, 2018, 232, 464–471 CrossRef CAS.
- Y. A. Daza and J. N. Kuhn, RSC Adv., 2016, 6, 49675–49691 RSC.
- L.-P. Merkouri, T. R. Reina and M. S. Duyar, Nanoscale, 2022, 14, 12620–12637 RSC.
- E. Portillo, J. Gandara-Loe, T. R. Reina and L. Pastor-Pérez, Sci. Total Environ., 2023, 857, 159394 CrossRef CAS PubMed.
- U. Guharoy, T. Ramirez Reina, S. Gu and Q. Cai, J. Phys. Chem. C, 2019, 123, 22918–22931 CrossRef CAS.
- E. Le Saché, L. Pastor-Perez, B. J. Haycock, J. J. Villora-Picó, A. Sepulveda-Escribano and T. R. Reina, ACS Sustain. Chem. Eng., 2020, 8, 4614–4622 CrossRef.
- H. Xu, Y. Li, X. Luo, Z. Xu and J. Ge, Chem. Commun., 2017, 53, 7953–7956 RSC.
- Z. Zhao, M. Wang, P. Ma, Y. Zheng, J. Chen, H. Li, X. Zhang, K. Zheng, Q. Kuang and Z.-X. Xie, Appl. Catal., B, 2021, 291, 120101 CrossRef CAS.
- X. Wang, H. Shi, J. H. Kwak and J. Szanyi, ACS Catal., 2015, 5, 6337–6349 CrossRef CAS.
- C. Wang, E. Guan, L. Wang, X. Chu, Z. Wu, J. Zhang, Z. Yang, Y. Jiang, L. Zhang and X. Meng, J. Am. Chem. Soc., 2019, 141, 8482–8488 CrossRef CAS PubMed.
- Y. Zhang, L. Liang, Z. Chen, J. Wen, W. Zhong, S. Zou, M. Fu, L. Chen and D. Ye, Appl. Surf. Sci., 2020, 516, 146035 CrossRef CAS.
- Q. Zhang, L. Pastor-Pérez, Q. Wang and T. R. Reina, J. Energy Chem., 2022, 66, 635–646 CrossRef CAS.
- Y. Tao, Y. Zhu, C. Liu, H. Yue, J. Ji, S. Yuan, W. Jiang and B. Liang, J. Environ. Chem. Eng., 2018, 6, 6761–6770 CrossRef CAS.
- S. S. Kim, H. H. Lee and S. C. Hong, Appl. Catal., A, 2012, 423, 100–107 Search PubMed.
- M. Zhu, Q. Ge and X. Zhu, Trans. Tianjin Univ., 2020, 26, 172–187 CrossRef CAS.
- M. González-Castaño, B. Dorneanu and H. Arellano-García, React. Chem. Eng., 2021, 6, 954–976 RSC.
- M. González-Castano, J. C. Navarro De Miguel, F. Sinha, S. Ghomsi Wabo, O. Klepel and H. Arellano-Garcia, J. CO2 Util., 2021, 46, 101493 CrossRef.
- E. L. Fornero, D. L. Chiavassa, A. L. Bonivardi and M. A. Baltanás, J. CO2 Util., 2017, 22, 289–298 CrossRef CAS.
- A. Goguet, F. C. Meunier, D. Tibiletti, J. P. Breen and R. Burch, J. Phys. Chem. B, 2004, 108, 20240–20246 CrossRef CAS.
- Z. Chen, L. Liang, H. Yuan, H. Liu, P. Wu, M. Fu, J. Wu, P. Chen, Y. Qiu, D. Ye and L. Chen, Appl. Catal., B, 2021, 298, 120507 CrossRef CAS.
- S. S. Kim, H. H. Lee and S. C. Hong, Appl. Catal., B, 2012, 119–120, 100–108 CAS.
- G. Varvoutis, M. Lykaki, E. Papista, S. A. C. Carabineiro, A. C. Psarras, G. E. Marnellos and M. Konsolakis, J. CO2 Util., 2021, 44, 101408 CrossRef CAS.
- L. Yang, L. Pastor-Pérez, J. J. Villora-Pico, S. Gu, A. Sepúlveda-Escribano and T. R. Reina, Appl. Catal., A, 2020, 593, 117442 CrossRef CAS.
- L. F. Bobadilla, J. L. Santos, S. Ivanova, J. A. Odriozola and A. Urakawa, ACS Catal., 2018, 8, 7455–7467 CrossRef CAS.
- W. Wang, S. Wang, X. Ma and J. Gong, Chem. Soc. Rev., 2011, 40, 3703–3727 RSC.
- N. Ishito, K. Hara, K. Nakajima and A. Fukuoka, J. Energy Chem., 2016, 25, 306–310 CrossRef.
- S. Challagulla, K. Tarafder, R. Ganesan and S. Roy, Sci. Rep., 2017, 7, 8783 CrossRef PubMed.
- G. Leofanti, M. Padovan, G. Tozzola and B. Venturelli, Catal. Today, 1998, 41, 207–219 CrossRef CAS.
- L. Pastor-Pérez, M. Shah, E. Le Saché and T. R. Reina, Catalysts, 2018, 8, 608 CrossRef.
- C. Zhang, G. Zhao, K. Liu, Y. Yang, H. Xiang and Y. Li, J. Mol. Catal. A: Chem., 2010, 328, 35–43 CrossRef CAS.
- B. Liang, H. Duan, X. Su, X. Chen, Y. Huang, X. Chen, J. J. Delgado and T. Zhang, Catal. Today, 2017, 281, 319–326 CrossRef CAS.
- E. R. Silva, J. M. Silva, P. Massiani, F. R. Ribeiro and M. F. Ribeiro, Catal. Today, 2005, 107–108, 792–799 CrossRef CAS.
- M. Primet, M. Mathieu, M. Primet, P. Pichat and M.-V. Mathieu, J. Phys. Chem., 1971, 75, 1216–1220 CrossRef CAS.
- L. Lan, H. Daly, Y. Jiao, Y. Yan, C. Hardacre and X. Fan, Int. J. Hydrogen Energy, 2021, 46, 31054–31066 CrossRef CAS.
- A. Y. Stakheev, E. S. Shpiro, N. D. Zelinsky, N. I. Jaeger and G. Schulz-Eldoff, Catal. Lett., 1995, 32, 147–158 CrossRef CAS.
- S. Shen, X. Wang, Q. Ding, S. Jin, Z. Feng and C. Li, Chin. J. Catal., 2014, 35, 1900–1906 CrossRef CAS.
- F. Romero-Sarria, S. Garcia-Dali, S. Palma, E. M. Jimenez-Barrera, L. Oliviero, P. Bazin and J. A. Odriozola, Surf. Sci., 2016, 648, 84–91 CrossRef CAS.
- P. Panagiotopoulou and D. I. Kondarides, J. Catal., 2009, 267, 57–66 CrossRef CAS.
- P. Bazin, O. Saur, J. C. Lavalley, M. Daturi and G. Blanchard, Phys. Chem. Chem. Phys., 2005, 7, 187–194 RSC.
- J. C. Calabrese, D. Lawrence, A. Cavalieri, P. Chini, G. Longoni and S. Martinengo, J. Am. Chem. Soc., 1974, 96(8), 2614–2616 CrossRef CAS.
- W. Li, J. Gan, Y. Liu, Y. Zou, S. Zhang and Y. Qu, Angew. Chem., Int. Ed., 2023, 62, e20235661 Search PubMed.
- J. C. Seo, G. Park, M. W. Arshad, C. Zhang, S. Kim and S. K. Kim, J. CO2 Util., 2022, 66, 102291 CrossRef CAS.
- K. K. Ghuman, L. B. Hoch, T. E. Wood, C. Mims, C. V. Singh and G. A. Ozin, ACS Catal., 2016, 6, 5764–5770 CrossRef CAS.
- K. K. Ghuman, T. E. Wood, L. B. Hoch, C. A. Mims, G. A. Ozin and C. V. Singh, Phys. Chem. Chem. Phys., 2015, 17, 14623–14635 RSC.
- C. Liu, S. L. Nauert, M. A. Alsina, D. Wang, A. Grant, K. He, E. Weitz, M. Nolan, K. A. Gray and J. M. Notestein, Appl. Catal., B, 2019, 225, 117754 CrossRef.
- L. F. Bobadilla, A. Egaña, R. Castillo, F. Romero-Sarria, M. A. Centeno, O. Sanz, M. Montes and J. A. Odriozola, Fuel, 2022, 312, 122964 CrossRef CAS.
- A. Jurado, Á. Morales-García, F. Viñes and F. Illas, ACS Catal., 2022, 12, 15658–15667 CrossRef CAS.
- L. F. Bobadilla, V. Garcilaso, M. A. Centeno and J. A. Odriozola, ChemSusChem, 2017, 10, 1193–1201 CrossRef CAS PubMed.
- J. H. Bitter, K. Seshan and J. A. Lercher, J. Catal., 1999, 183, 336–343 CrossRef CAS.
- K. Hadjiivanov, Appl. Surf. Sci., 1998, 135, 331–338 CrossRef CAS.
- Y. Zhao, C. Li, X. Liu, F. Gu, H. Jiang, W. Shao, L. Zhang and Y. He, Mater. Lett., 2007, 61, 79–83 CrossRef CAS.
- L. Qin, G. Wang and Y. Tan, Sci. Rep., 2018, 8, 16198 CrossRef PubMed.
- C. Zhang, J. Qi, Y. Li, Q. Han, W. Gao, Y. Wang and J. Dong, Nanomaterials, 2022, 12, 1329 CrossRef CAS PubMed.
- R. Bower, C. P. T. McPolin, A. V. Krasavin, A. V. Zayats and P. K. Petrov, Opt. Mater. Express, 2022, 12, 3471 CrossRef CAS.
- F. Zamboni, A. Makarevičiūtė and V. N. Popok, Appl. Nano, 2022, 3, 102–111 CrossRef.
- P. Makuła, M. Pacia and W. Macyk, J. Phys. Chem. Lett., 2018, 9, 6814–6817 CrossRef PubMed.
Footnote |
| † Electronic supplementary information (ESI) available. See DOI: https://doi.org/10.1039/d3ta05482a |
| This journal is © The Royal Society of Chemistry 2024 |

