Impact of the fluorination degree of ether-based electrolyte solvents on Li-metal battery performance†
Yangju
Lin‡
 a,
Zhiao
Yu‡
 ab,
Weilai
Yu
 a,
Sheng-Lun
Liao
a,
Elizabeth
Zhang
ac,
Xuelin
Guo
a,
Zhuojun
Huang
ac,
Yuelang
Chen
ab,
Jian
Qin
a,
Sheng-Lun
Liao
a,
Elizabeth
Zhang
ac,
Xuelin
Guo
a,
Zhuojun
Huang
ac,
Yuelang
Chen
ab,
Jian
Qin
 *a,
Yi
Cui
*cde and
Zhenan
Bao
 *a
*a
aDepartment of Chemical Engineering, Stanford University, Stanford, California 94305, USA. E-mail: zbao@stanford.edu; jianq@stanford.edu
bDepartment of Chemistry, Stanford University, Stanford, California 94305, USA
cDepartment of Materials Science and Engineering, Stanford University, Stanford, California 94305, USA. E-mail: yicui@stanford.edu
dDepartment of Energy Science and Engineering, Stanford University, Stanford, California 94305, USA
eStanford Institute for Materials and Energy Sciences, SLAC National Accelerator Laboratory, Menlo Park, California 94025, USA
First published on 7th December 2023
Abstract
Electrolytes using fluorinated solvents have proven effective in improving the cycling life of Li-metal batteries, by forming a robust solid–electrolyte interphase through decomposition of anion and fluorinated solvent molecules. Herein, we modulated the fluorination degree of ether-based electrolyte solvents to investigate their performance in Li-metal batteries. We tuned the fluorination degree by installing a monofluoro substituent on one ethoxy group of 1,2-diethoxyethane (DEE) and varying the fluorination degree on the other one, providing three fluorinated DEE solvent molecules (i.e., F1F0, F1F1 and F1F2) with a relatively low fluorination degree. All three electrolytes showed improved solvation strength and ionic conductivities compared with previous highly fluorinated DEE electrolytes while retaining good oxidative stability. A full cell test using the Li-metal anode and nickel-rich cathode revealed that a higher degree of fluorination is beneficial to the cycling performance, and the cycling stability follows F1F0 < F1F1 < F1F2. Specifically, F1F0 exhibited poor cycling stability due to its instability against both the anode and cathode. While F1F1 and F1F2 both showed good stability against the Li-metal anode, their relative long-term oxidative stability was responsible for the distinct performance, in which the cycle numbers at 80% capacity retention for F1F1 and F1F2 were ∼20 and ∼80, respectively. Finally, we demonstrated that F1F2 was able to achieve 90 cycles before reaching 80% capacity retention in practical lithium iron phosphate (LFP) pouch cells. This work shows the importance of modulating the fluorination degree of electrolyte solvents, and this approach is suitable for various cathode materials.
Introduction
The high number of transferred electrons per atomic mass and low electrochemical potential in the Li+/Li redox reaction render Li metal an ideal anode material for high-energy-density batteries.1–3 Despite these merits, the Li-electrolyte side reactions, inaccessible lithium (or called dead lithium) generated during the plating/stripping cycles4,5 and, thus, the poor coulombic efficiency (CE) and cyclability have significantly impeded the practical implementation.6 A key factor enabling stable Li deposition is the formation of a robust solid–electrolyte interphase (SEI) that allows for efficient Li+ transfer and uniform Li deposition.7,8 Typically, this SEI layer is composed of species associated with electrochemical and chemical decomposition of salt and solvent molecules, and a SEI layer that is rich in inorganic components (e.g., LiF, Li2O and Li3N) has been found beneficial.9A variety of molecular engineering strategies for electrolytes have been explored in order to achieve robust SEI layers in Li-metal batteries,10,11 including additive-reinforced electrolytes (AREs),12 high concentration electrolytes (HCEs),13 localized high concentration electrolytes (LHCEs),14 weakly solvating electrolytes (WSEs),15–22 electrolytes with fluorinated solvents,23–29etc. In these approaches, the formation of a robust SEI layer is promoted through decomposition of either additive, anion or fluorinated molecules. In particular, the fluorinated solvents were found to simultaneously provide several merits in electrolytes, including (1) improved oxidative stability resulting from the high electron-withdrawing capability of fluorine that lowers the highest occupied molecular orbital (HOMO),30,31 (2) promotion of the anion-derived SEI layer due to the weakened solvation ability associated with the reduced electron density of binding atoms,32 (3) improved flame retardance,33 and (4) enriched LiF component in the SEI layer through potential decomposition of solvent molecules.34,35 Notably, the strategy of solvent fluorination allows for a single-solvent low-concentration electrolyte system without compromising ionic conductivity.36–38
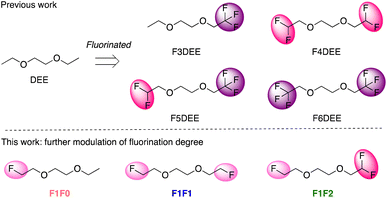
Examples of using fluorinated molecules as a single electrolyte solvent include a series of long-chain fluorinated glymes,39,40 fluorinated 1,4-dimethoxylbutane (FDMB),41N,N-dimethylsulfamoyl fluoride (FSA),34N,N-dimethyltrifluoromethane-sulfonamide (DMTMSA),31 fluorinated-1,2-diethoxyethane (FDEE)32 and, more recently, 1,1,1-trifluoro-2,3-dimethoxypropane (TFDMP)42 and bis(2-fluoroethyl) ethers (BFE).43 In addition to improved oxidative stability, all these electrolytes showed excellent CE and cyclability using nickel-rich high-voltage cathodes. We recently showed that an exciting family of electrolytes based on FDEE (Fig. 1 top row) can achieve Li-cycling CE as high as 99.9% and ∼200 cycles of full battery cycling at high-loading capacity (4.8 mA h cm−2) under harsh cycling conditions (0.2C charge, 0.3C discharge).32 This series of electrolytes has a fluorine content of 3–6 fluorine atoms per molecule and shows moderate ionic conductivities, and a higher ionic conductivity is necessary for fast charging/discharging. Therefore, we sought to fine-tune the degree of fluorination of DEE in the lower fluorine regime (Fig. 1 bottom row) to optimize the ionic conductivity with the hope of not compromising their oxidative stability.
It is known that increased fluorination degree in ether molecules improves oxidative stability but simultaneously reduces the solvation/binding strength, resulting in the formation of larger size of salt-anion clusters and so reduced ionic conductivity.32 We therefore further reduced the fluorination degree of ether molecules, by applying the monofluoro-substitution on one ethoxy group of 1,2-diethoxyethane (DEE) and varying the number of fluorine substituents on the other one (Fig. 1 bottom row).
Results and discussion
Synthesis and characterization of electrolytes
The fluorinated ether molecules (i.e., F1F0, F1F1, and F1F2) are synthesized through SN2 reactions and can be obtained on >10 g scale (see the ESI†). Three single-solvent electrolytes were prepared by adding 1.2 mmol of lithium bis(fluoromethanesulfonyl)imide (LiFSI) into 1 mL of each of the solvent molecules. We then performed 7Li NMR to analyze the solvation condition of salt in the electrolyte using LiCl in D2O as an internal reference. As can be seen in Fig. 2a, the chemical shift of 7Li gradually moved upfield upon increasing the degree of fluorination. This increased electron shielding is attributed to more compact cation–anion interaction resulting from weakened solvation ability, as has been observed in other fluorinated solvents, HCEs, LHCEs and WSEs.16,32,43 Herein, consistent with our expectation, increasing the fluorination degree of ether solvent reduces its solvation ability; however, the impact on chemical shifts is not as pronounced as those of highly fluorinated FDEE electrolytes (Fig. 1, top),32 indicating improved salt solvation (or cation–anion dissociation) in our new electrolytes. Additional evidence from Raman measurement (Fig. 2b) showed that F1F0 and F1F1 electrolytes exhibit mainly solvent-separated ion pairs (SSIPs, 720 cm−1), while trivial contact ion pairs (CIPs, 732 cm−1) and aggregates (AGGs, 746 cm−1).44 In the case of F1F2, the broad shoulder peak indicated significant portions of CIPs and AGGs, suggesting the weakened solvation strength.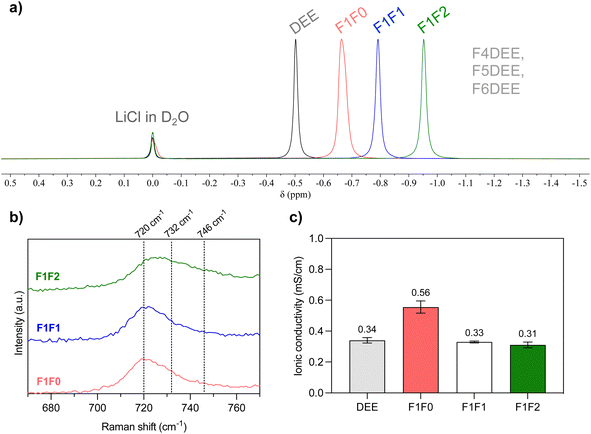 | ||
| Fig. 2 (a) Overlay of normalized 7Li NMR spectra of electrolyte solutions containing 1.2 mole L−1 of LiFSI salt, and LiCl in D2O was applied as an internal standard. The pale blue region indicates the chemical shift of F4DEE, F5DEE and F6DEE electrolytes in the previous report. (b) Raman spectra of electrolytes in this study showing the solvation conditions of LiFSI salt. (c) Comparison of ionic conductivity in the stainless steel-separator-stainless steel sandwich structure using the Celgard 2325 trilayer separator. Each electrolyte was measured three times (see Table S3†). | ||
To evaluate the ionic conductivity, we infiltered the electrolyte solution into a Celgard 2325 separator and used stainless-steel-sandwich configuration to mimic the conditions of coin-cell tests. As shown in Fig. 2c, all three electrolytes exhibited relatively higher ionic conductivities compared with previous FDEE counterparts (0.05–0.17 mS cm−1),32 and they follow the trend F1F0 > F1F1 > F1F2, in alignment with the solvation strength. Interestingly, F1F0 showed ionic conductivity that is even higher than that of the nonfluorinated DEE electrolyte. We reasoned that the F substituent increases the polarity of the molecule and provides an additional binding site to the Li+, giving rise to a less compact cation–anion cluster, as indicated by 19F NMR spectra (Fig. S1†) and some previous studies.43,45 Macroscopically, the molecular solvation is reflected in the electrolyte viscosities, where the viscosity trend follows: F1F0 < F1F1 < F1F2 (Table S2†), and a relatively high viscosity leads to a lower diffusivity and so lower ionic conductivity.
Computation of solvation structures
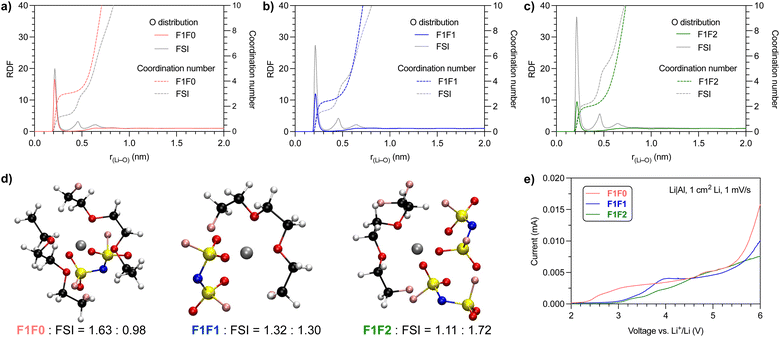
We further performed molecular dynamics (MD) simulation to gain insight into the solvation behavior. Fig. 3a–c show the probability of coordinating O atoms as a function of distance from the Li+ center, or radial distribution function (RDF). We compared the O atom from both solvent and anion molecules. The first solvation shell peaked at r(Li–O) ∼0.22 nm, which indicates the length of the Li–O dative bond,46 for both solvent and anion molecules in all three electrolyte systems.Notably, the composition of solvating O atoms from solvent and anion molecules varied with the fluorination degree of the electrolyte solvents. The fraction of solvating O atoms from the FSI anion increases in the order F1F0 < F1F1 < F1F2, and that from solvent molecules decreases accordingly. This trend is consistent with the order of the solvation strength. Consequently, the overall cation–anion interaction is stronger in less solvated electrolyte systems, as also evidenced by 7Li NMR and Raman spectra analysis (Fig. 2a and b).
To present a quantitative picture of the solvation shell, we integrated the RDF to get the coordination number (CN) of O atoms from the solvent and FSI anion. The presence of a plateau at r(Li–O) ∼0.36 nm for both the solvent and FSI anion suggested the radius of the first solvation sheath, and the corresponding CN in the sheath was estimated. For F1F0 electrolyte, the CNs of O from the solvent and FSI anion are 3.03 and 1.34, respectively. The numbers became 2.46 and 1.76 for F1F1 electrolyte and 2.03 and 2.31 for F1F2 electrolyte. We further counted the number of solvent and FSI anion molecules in the first solvation shell and found, on average, 1.63 solvent and 0.98 FSI in F1F0 electrolyte, 1.32 solvent and 1.30 FSI in F1F1 electrolyte, and 1.11 solvent and 1.72 FSI in F1F2 electrolyte. It is worth noting that for electrolytes with 1.2 mmol of LiFSI in 1 mL solvent, the solvent/LiFSI molar ratios are 6.01, 6.03 and 5.78 for F1F0, F1F1 and F1F2, respectively. Hence, there are both “binding” and “free” solvent molecules in the electrolytes. The above quantitative analysis is further highlighted by the typical solvation structures shown in Fig. 3d. Again, this observation is in alignment with the relative solvation strength of solvent molecules.
Previous work has found strong correlation between the solvation structure and the oxidative stability of electrolytes.13–29 We then scrutinized the impact of the fluorination degree of solvent on the oxidative stability and, hence, the feasibility to be used in high-voltage battery systems. Fig. 3e shows the screening of leakage current through linear sweep voltammetry of Li‖Al half cells at a scanning rate of 1 mV s−1. Interestingly, all three electrolytes exhibit a relatively small current (<5 μA) at up to 5 V, and these observed low leakage currents are comparable to previous FDEE electrolytes.32
Li-metal full battery performance
Encouraged by the improved ionic conductivity and retained anodic stability while reducing the fluorination degree, we performed Li‖NMC811 full battery tests of the three electrolytes using the same conditions as reported for FDEE electrolytes, i.e., pairing 50 μm-thick Li foil (10.3 mA h cm−2) with a high-loading NMC811 cathode (4.8 mA h cm−2) to yield a negative-to-positive electrode ratio (N/P) of ∼2.1; using an electrolyte-to-cathode ratio (E/C) of ∼8 g A−1 h−1; and cycling at C/5 charging and C/3 discharging rates, for the purpose of comparison with previous studies and so evaluation of fluorination effects.A representative set of battery cycling results is provided in Fig. 4a (repeated results are provided in Fig. S4–S7†), and a clear trend of cycling life was observed: F1F0 < F1F1 < F1F2. The capacity of F1F0 decayed quickly to near zero within 30 cycles, and its CE dropped significantly despite the presence of an excess Li reservoir, indicating the instability of F1F0 against both the anode and cathode. Additionally, the decay pattern is in contrast to the DEE electrolyte (non-fluorinated electrolyte), which presents a steady capacity without significant reduction in the beginning 18 cycles and then drops quickly to 80% capacity in the following 37 cycles.16 Herein, the continuous capacity decay in F1F0 suggested the negative impact of mono-fluorination on DEE. As for F1F1, the capacity remained almost unchanged in the first 20 cycles but then quickly reduced over cycles. In stark contrast, F1F2 exhibited stable cycling without substantial capacity decay for ∼80 cycles, which is comparable to F3DEE and F6DEE but less than F4DEE and F5DEE in a previous report.32
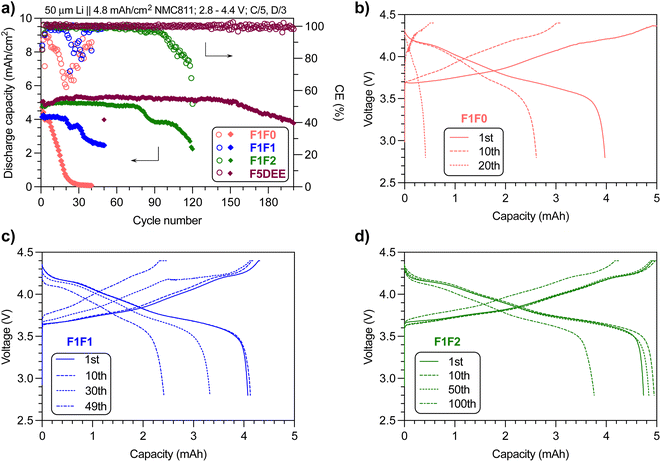 | ||
| Fig. 4 (a) Capacity and CE retention of F1F0, F1F1 and F1F2 electrolytes over cycling numbers. The data of F5DEE were adapted from previous results.32 The charge/discharge curves of (b) F1F0, (c) F1F1 and (d) F1F2 at various cycles. Note: cycling of full cells was repeated and the results can be found in Fig. S4–S7.† | ||
We further studied the charge/discharge curves at different cycles. Fig. 4b shows the charge/discharge curves of F1F0 at the 1st, 10th and 20th cycles, where the overpotential at the start of charge/discharge remains nearly unchanged while the capacity fades quickly over cycles, indicating the retained bulk and interfacial resistance yet instability against electrodes. Specifically, the 10th discharge process only gave ∼2.6 mA h, which corresponds to ∼84% of the 10th charging capacity (∼3.1 mA h). Because the high initial Li reservoir (N/P ∼2.1) would guarantee the 3.1 mA h capacity when discharged at the 10th cycle, the observed capacity loss highly suggested the cathode degradation during the 10th discharge cycle. Indeed, the XRD analysis of the cathode after 10 cycles using F1F0 electrolyte indicated significant layer disruption (Fig. S8†). This instability can be ascribed to the intrinsic low oxidative stability of F1F0 (as will be discussed later), and the resulting side reactions deteriorate the cathode integrity. In contrast, F1F1 showed slightly less capacity loss over cycles, but a substantial polarization (decrease in the initial discharge voltage or increase in charge voltage) implies the increased bulk and interfacial resistance. In the case of F1F2, the capacity loss is even less and the polarization over cycles is not as pronounced. Therefore, compared with F1F0, the improved oxidative stability of F1F1 benefited the cathode performance but induced polarization, and F1F2 overcame both drawbacks. We postulated that the combined compact Li+-anion pairs associated with weak solvation and improved oxidative stability resulting from the increased fluorination degree contributed to the overall improved cycling performance. Although the ionic conductivity values of F1F1 and F1F2 are similar, the polarization evolved distinctly and could be attributed to several factors, including the quality of the generated interphase layer at both the anode (SEI) and cathode (CEI) and their dissolution conditions, changes in electrolyte contents due to the interphase dissolution and the generated byproducts associated with electrochemical/chemical decomposition of solvent and/or salt.
Analysis of Li-metal half-cell cycling
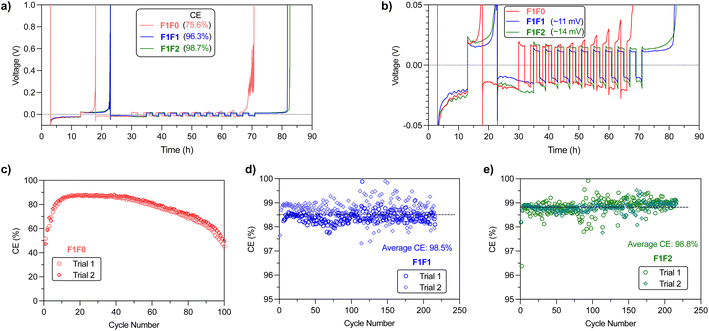
We then examined the stability of Li metal cycling through Li‖Cu half cells. Typical evaluation of CE using the modified Aurbach method47 indicated that the CEs for F1F0, F1F1, and F1F2 are 75.8%, 96.3% and 98.7%, respectively (Fig. 5a). A close scrutinization of the overpotential curves reveals a “yielding” peak in the stripping cycle for all three electrolytes (Fig. 5b), which is ascribed to the transformation of interface kinetics.48 Meanwhile, we noticed a significant capacity loss in the beginning cleaning cycle of F1F0, along with slowly increased stripping overpotential in the later cycles, indicating the cathodic instability of F1F0 and impedance increase. Notably, the overpotential curve of the stripping cycle presents spike features, which could be related to the reconnection of “dead” Li upon stripping.49 We therefore reasoned that F1F0 presents poor electrochemical stability and unstable/nonuniform Li deposition. By contrast, F1F1 and F1F2 showed relatively high CE of 96.3% and 98.7%, respectively, and the average overpotentials of F1F1 and F1F2 under 0.5 mA cm−2 current are respectively 11 mV and 13 mV, both of which are lower than that of F5DEE (∼20 mV)32 owing to their higher ionic conductivity.Long-term cycling of Li‖Cu half cells was applied to further validate the Li cycling stability (Fig. 5c–e). Interestingly, F1F0 showed an extremely low CE of ∼50% in the first cycle, and it then increased and reached a plateau value of ∼88% in the following 20 cycles. However, this value slowly decreased to ∼50% after 100 cycles. It was found that the average CE of the initial 12 cycles is ∼75%, which is consistent with the CE value obtained from the modified Aurbach measurement that includes 12 cycles of Li plating/stripping. Herein, F1F0 shows poor stability against Li cycling and thus cycling of a full battery. On the other hand, both F1F1 and F1F2 showed stable Li cycling over 200 cycles and average CE of 98.5% and 98.8%, respectively. It is worth noting that the CE of both F1F1 and F1F2 quickly reached stable values during the initial 3 cycles, which suggests a quick passivation and formation of robust SEI layers (Fig. S9†).
Despite the similar Li‖Cu cycling performance of F1F1 and F1F2, they showed different full battery performance. To understand the underlying mechanism, we compared the Li deposition morphology of F1F1 and F1F2. However, no substantial difference in the grain size and morphology was found (Fig. S10†). Further, the SEI composition after one cycle was analyzed by X-ray photoelectron spectroscopy (XPS), which showed signals from LiOH, Li2O, LiF, Li2SOx, Li2S and organic species for both electrolytes (Fig. S11–S13†). While the species are similar, a closer comparison of the relative abundance of each element revealed that the O and F contents in F1F1 are relatively higher than those of F1F2 after the first cycle (27.1% vs. 10.8% and 17.8% vs. 4.5%, Fig. 6). The difference could be due to the higher electrochemical susceptibility of the monofluoride substituent than the difluoro one. It is worth noting that the observed SEI content by XPS is an evaluation of results from multiple factors: (1) the electrolyte solvation dictates the generated SEI composition; (2) the dissolution of the SEI in the corresponding electrolyte. Direct comparison of SEI contents between different electrolytes seems less meaningful in elucidating their relative performance, as the observed contents are the “stable” residue in the specific electrolyte.
We next scrutinized the SEI composition for each electrolyte at the 10th cycle. It was found that the O and F contents in F1F1 slightly increased to 32.9% and 20.5%, respectively. Therefore, the potentially stable inorganic species of F1F1 remained at a high level over cycles. Interestingly, the increase was more significant in F1F2, which showed 23.8% for O and 16.9% for F at the 10th cycle. The increase of O and F contents in F1F2 over cycling indicated more accumulation of stable components (possibly Li2O and LiF) in the SEI, which we hypothesized could be a consequence of less SEI dissolution over cycling,50 and the dissolved SEI components could potentially migrate to the cathode side and affect the cathode performance.51
Long-term oxidative stability
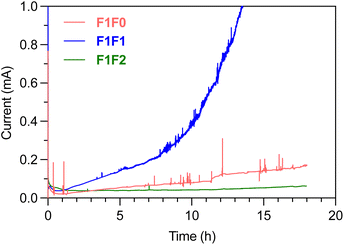
The SEI composition and Li‖Cu half-cell cycling performance of F1F1 and F1F2 are rather similar, and albeit thin, the Li metal foil in the full cell still provides excess Li reservoir. Therefore, with an average CE of >98% for Li plating/stripping, the full cell performance is more limited by the cathode side. Because full cell cycling is a long-term process, the oxidation of electrolytes occurs in an accumulating manner and the side reactions could diminish the cathode integrity over time. We therefore performed chronoamperometry to understand the long-term oxidative stability of electrolytes under high voltage. Fig. 7 shows the leakage current of electrolytes under 4.4 V constant voltage over time using Li‖Pt half cells. Significant leakage current was observed in F1F0 and F1F1 over long-term high voltage holding, and the situation devastated over time. By contrast, there was minimal leakage current in F1F2, and it remained steady over more than 18 h. Herein, compared with F1F1, the superior oxidative stability of F1F2 is responsible for its much more stable cycling of full batteries.Performance of anode-less pouch cells
To evaluate the application of these new electrolytes in practical cells, we performed the cycling test of a commercial multilayer anode-less LFP pouch cell with a relative high area loading of 2.1 mA h cm−2. As shown in Fig. 8, ∼80% capacity retention using F1F1 electrolyte was achieved at ∼55 cycles. With improved oxidative stability, F1F2 was able to realize ∼90 cycles. For comparison, the state-of-the-art electrolyte F5DEE achieved a high cycle number of ∼110. Therefore, although it cannot outperform the F5DEE electrolyte, the F1F2 electrolyte is suitable for research in practice cells.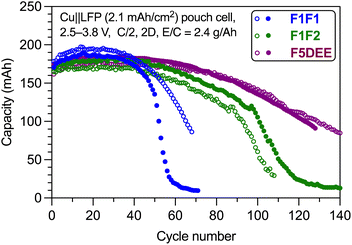 | ||
| Fig. 8 Long-term cycling of anode-less Cu‖LFP pouch cells using F1F1, F1F2 and F5DEE electrolytes. The cycling was performed at 0.5C charging rate and 2C discharging rate. | ||
Conclusions
To conclude, the modulation of the fluorination degree in ether-based electrolyte solvents allows for fine-tuning of solvation strength and long-term oxidative stability. A general trend that a low degree of fluorination presents relatively strong solvation but poor oxidative stability and increasing fluorination degree improves the oxidative stability at the expense of solvation strength has been observed. Among these ether solvents with relatively low fluorination degrees, F1F0 exhibited particularly poor stability against both the Li-metal anode and NMC cathode. While F1F1 and F1F2 showed comparable cathodic stability, F1F2 possessed better anodic stability and, therefore, enhanced battery cyclability. While the performance of this series of electrolytes does not outperform our previous FDEE electrolytes, the improved ionic conductivity might be beneficial to high-current density (>1 mA h cm−2, Fig. S9†) charging of battery systems that possess relatively low overpotential.The observed trade-off between ionic conductivity (or related solvation capability) and oxidative stability makes it challenging to design an ideal single solvent through solely tuning the fluorination degree. Strategies that can further enhance the electrolyte performance include increasing salt concentration, where there would be a point that provides optimal conductivity and improved oxidative stability, and adding diluent, as has been demonstrated recently by Ren and coworkers for the F1F1 solvent molecule.45
Author contributions
Yangju Lin and Zhiao Yu contributed equally to this work. Yangju Lin: conceptualization, methodology, investigation, data curation, visualization, writing – original draft; Zhiao Yu: conceptualization, investigation, methodology, data curation; Weilai Yu: investigation, data curation, visualization; Sheng-Lun Liao: methodology, formal analysis; Elizabeth Zhang, Xuelin Guo, Zhuojun Huang, and Yuelang Chen: data curation; Jian Qin: supervision, discussion, writing – review and editing; Yi Cui: supervision, discussion, writing – review and editing; Zhenan Bao: supervision, project administration, discussion, writing – review and editing. The manuscript was reviewed and edited by all the above authors. All authors have given approval to the final version of the manuscript.Conflicts of interest
Zhenan Bao, Yi Cui, Yangju Lin, Zhiao Yu and Yuelang Chen declare that this work is part of US Provisional Patent Application filed in 2021. The remaining authors declare no competing interests.Acknowledgements
This work was supported by the Assistant Secretary for Energy Efficiency and Renewable Energy, Office of Vehicle Technologies of the U.S. Department of Energy, under the Battery 500 Consortium and the Battery Materials Research (BMR) programs.References
- Y. Guo, H. Li and T. Zhai, Adv. Mater., 2017, 29, 1700007 CrossRef PubMed.
- D. Lin, Y. Liu and Y. Cui, Nat. Nanotechnol., 2017, 12, 194–206 CrossRef CAS PubMed.
- W. Xu, J. Wang, F. Ding, X. Chen, E. Nasybulin, Y. Zhang and J.-G. Zhang, Energy Environ. Sci., 2014, 7, 513–537 RSC.
- C. Fang, J. Li, M. Zhang, Y. Zhang, F. Yang, J. Z. Lee, M. H. Lee, J. Alvarado, M. A. Schroeder, Y. Yang, B. Lu, N. Williams, M. Ceja, L. Yang, M. Cai, J. Gu, K. Xu, X. Wang and Y. S. Meng, Nature, 2019, 572, 511–515 CrossRef CAS PubMed.
- P. P. Paul, E. J. McShane, A. M. Colclasure, N. Balsara, D. E. Brown, C. Cao, B.-R. Chen, P. R. Chinnam, Y. Cui, E. J. Dufek, D. P. Finegan, S. Gillard, W. Huang, Z. M. Konz, R. Kostecki, F. Liu, S. Lubner, R. Prasher, M. B. Preefer, J. Qian, M.-T. F. Rodrigues, M. Schnabel, S.-B. Son, V. Srinivasan, H.-G. Steinrück, T. R. Tanim, M. F. Toney, W. Tong, F. Usseglio-Viretta, J. Wan, M. Yusuf, B. D. McCloskey and J. Nelson Weker, Adv. Energy Mater., 2021, 11, 2100372 CrossRef CAS.
- X. B. Cheng, R. Zhang, C. Z. Zhao and Q. Zhang, Chem. Rev., 2017, 117, 10403–10473 CrossRef CAS PubMed.
- M. D. Tikekar, S. Choudhury, Z. Tu and L. A. Archer, Nat. Energy, 2016, 1, 16114 CrossRef CAS.
- E. Peled and S. Menkin, J. Electrochem. Soc., 2017, 164, A1703 CrossRef CAS.
- X. B. Cheng, R. Zhang, C. Z. Zhao, F. Wei, J. G. Zhang and Q. Zhang, Adv. Sci., 2016, 3, 1500213 CrossRef PubMed.
- S. Li, M. Jiang, Y. Xie, H. Xu, J. Jia and J. Li, Adv. Mater., 2018, 30, e1706375 CrossRef PubMed.
- Y. Jie, X. Ren, R. Cao, W. Cai and S. Jiao, Adv. Funct. Mater., 2020, 30, 1910777 CrossRef CAS.
- H. Zhang, G. G. Eshetu, X. Judez, C. Li, L. M. Rodriguez-Martínez and M. Armand, Angew. Chem., Int. Ed., 2018, 57, 15002–15027 CrossRef CAS PubMed.
- Y. Yamada, J. Wang, S. Ko, E. Watanabe and A. Yamada, Nat. Energy, 2019, 4, 269–280 CrossRef CAS.
- X. Cao, H. Jia, W. Xu and J.-G. Zhang, J. Electrochem. Soc., 2021, 168, 010522 CrossRef CAS.
- J. Zhang, Q. Li, Y. Zeng, Z. Tang, D. Sun, D. Huang, Y. Tang and H. Wang, ACS Energy Lett., 2023, 8, 1752–1761 CrossRef CAS.
- Y. Chen, Z. Yu, P. Rudnicki, H. Gong, Z. Huang, S. C. Kim, J.-C. Lai, X. Kong, J. Qin, Y. Cui and Z. Bao, J. Am. Chem. Soc., 2021, 143, 18703–18713 CrossRef CAS PubMed.
- E. Park, J. Park, K. Lee, Y. Zhao, T. Zhou, G. Park, M.-G. Jeong, M. Choi, D.-J. Yoo, H.-G. Jung, A. Coskun and J. W. Choi, ACS Energy Lett., 2023, 8, 179–188 CrossRef CAS.
- H. Zhang, Z. Zeng, F. Ma, Q. Wu, X. Wang, S. Cheng and J. Xie, Angew Chem. Int. Ed. Engl., 2023, 62(21), e202300771 CrossRef CAS PubMed.
- T. D. Pham and K.-K. Lee, Small, 2021, 17, 2100133 CrossRef CAS PubMed.
- R. Xu, J.-F. Ding, X.-X. Ma, C. Yan, Y.-X. Yao and J.-Q. Huang, Adv. Mater., 2021, 33, 2105962 CrossRef CAS PubMed.
- K. Ding, C. Xu, Z. Peng, X. Long, J. Shi, Z. Li, Y. Zhang, J. Lai, L. Chen, Y.-P. Cai and Q. Zheng, ACS Appl. Mater. Interfaces, 2022, 14, 44470–44478 CrossRef CAS PubMed.
- Z. Li, H. Rao, R. Atwi, B. M. Sivakumar, B. Gwalani, S. Gray, K. S. Han, T. A. Everett, T. A. Ajantiwalay, V. Murugesan, N. N. Rajput and V. G. Pol, Nat. Commun., 2023, 14, 868 CrossRef CAS PubMed.
- N. von Aspern, G. V. Röschenthaler, M. Winter and I. Cekic-Laskovic, Angew Chem. Int. Ed. Engl., 2019, 58, 15978–16000 CrossRef CAS PubMed.
- Y. Zhao, T. Zhou, T. Ashirov, M. E. Kazzi, C. Cancellieri, L. P. H. Jeurgens, J. W. Choi and A. Coskun, Nat. Commun., 2022, 13, 2575 CrossRef CAS PubMed.
- Y. Zhao, T. Zhou, M. El Kazzi and A. Coskun, ACS Appl. Energy Mater., 2022, 5, 7784–7790 CrossRef CAS.
- J. Holoubek, M. Yu, S. Yu, M. Li, Z. Wu, D. Xia, P. Bhaladhare, M. S. Gonzalez, T. A. Pascal, P. Liu and Z. Chen, ACS Energy Lett., 2020, 5, 1438–1447 CrossRef CAS.
- Y. Zhao, T. Zhou, L. P. H. Jeurgens, X. Kong, J. W. Choi and A. Coskun, Chem, 2023, 9, 682–697 CAS.
- Y. Yang, D. M. Davies, Y. Yin, O. Borodin, J. Z. Lee, C. Fang, M. Olguin, Y. Zhang, E. S. Sablina, X. Wang, C. S. Rustomji and Y. S. Meng, Joule, 2019, 3, 1986–2000 CrossRef CAS.
- J. Shi, C. Xu, J. Lai, Z. Li, Y. Zhang, Y. Liu, K. Ding, Y. P. Cai, R. Shang and Q. Zheng, Angew Chem. Int. Ed. Engl., 2023, 62, e202218151 CrossRef CAS PubMed.
- X. Fan, L. Chen, O. Borodin, X. Ji, J. Chen, S. Hou, T. Deng, J. Zheng, C. Yang, S.-C. Liou, K. Amine, K. Xu and C. Wang, Nat. Nanotechnol., 2018, 13, 715–722 CrossRef CAS PubMed.
- W. Xue, M. Huang, Y. Li, Y. G. Zhu, R. Gao, X. Xiao, W. Zhang, S. Li, G. Xu, Y. Yu, P. Li, J. Lopez, D. Yu, Y. Dong, W. Fan, Z. Shi, R. Xiong, C.-J. Sun, I. Hwang, W.-K. Lee, Y. Shao-Horn, J. A. Johnson and J. Li, Nat. Energy, 2021, 6, 495–505 CrossRef CAS.
- Z. Yu, P. E. Rudnicki, Z. Zhang, Z. Huang, H. Celik, S. T. Oyakhire, Y. Chen, X. Kong, S. C. Kim, X. Xiao, H. Wang, Y. Zheng, G. A. Kamat, M. S. Kim, S. F. Bent, J. Qin, Y. Cui and Z. Bao, Nat. Energy, 2022, 7, 94–106 CrossRef CAS.
- Z. Zhang, L. Hu, H. Wu, W. Weng, M. Koh, P. C. Redfern, L. A. Curtiss and K. Amine, Energy Environ. Sci., 2013, 6, 1806–1810 RSC.
- W. Xue, Z. Shi, M. Huang, S. Feng, C. Wang, F. Wang, J. Lopez, B. Qiao, G. Xu, W. Zhang, Y. Dong, R. Gao, Y. Shao-Horn, J. A. Johnson and J. Li, Energy Environ. Sci., 2020, 13, 212–220 RSC.
- W. Zhang, T. Yang, X. Liao, Y. Song and Y. Zhao, Energy Storage Mater., 2023, 57, 249–259 CrossRef.
- X. Chen and Q. Zhang, Acc. Chem. Res., 2020, 53, 1992–2002 CrossRef CAS PubMed.
- Z. Li, Y. Chen, X. Yun, P. Gao, C. Zheng and P. Xiao, Adv. Funct. Mater., 2023, 33, 2300502 CrossRef CAS.
- Y. Wang, Z. Li, Y. Hou, Z. Hao, Q. Zhang, Y. Ni, Y. Lu, Z. Yan, K. Zhang, Q. Zhao, F. Li and J. Chen, Chem. Soc. Rev., 2023, 52, 2713–2763 RSC.
- P. Ma, P. Mirmira and C. V. Amanchukwu, ACS Cent. Sci., 2021, 7, 1232–1244 CrossRef CAS PubMed.
- C. V. Amanchukwu, Z. Yu, X. Kong, J. Qin, Y. Cui and Z. Bao, J. Am. Chem. Soc., 2020, 142, 7393–7403 CrossRef CAS PubMed.
- Z. Yu, H. Wang, X. Kong, W. Huang, Y. Tsao, D. G. Mackanic, K. Wang, X. Wang, W. Huang, S. Choudhury, Y. Zheng, C. V. Amanchukwu, S. T. Hung, Y. Ma, E. G. Lomeli, J. Qin, Y. Cui and Z. Bao, Nat. Energy, 2020, 5, 526–533 CrossRef CAS.
- Y. Zhao, T. Zhou, M. Mensi, J. W. Choi and A. Coskun, Nat. Commun., 2023, 14, 299 CrossRef CAS PubMed.
- G. Zhang, J. Chang, L. Wang, J. Li, C. Wang, R. Wang, G. Shi, K. Yu, W. Huang, H. Zheng, T. Wu, Y. Deng and J. Lu, Nat. Commun., 2023, 14, 1081 CrossRef CAS PubMed.
- Y. Yamada, M. Yaegashi, T. Abe and A. Yamada, Chem. Commun., 2013, 49, 11194–11196 RSC.
- D. Ruan, L. Tan, S. Chen, J. Fan, Q. Nian, L. Chen, Z. Wang and X. Ren, JACS Au, 2023, 3, 953–963 CrossRef CAS PubMed.
- O. C. Gagné and F. C. Hawthorne, Acta Crystallogr., Sect. B: Struct. Sci., Cryst. Eng. Mater., 2016, 72, 602–625 CrossRef PubMed.
- B. D. Adams, J. Zheng, X. Ren, W. Xu and J.-G. Zhang, Adv. Energy Mater., 2018, 8, 1702097 CrossRef.
- K. N. Wood, E. Kazyak, A. F. Chadwick, K.-H. Chen, J.-G. Zhang, K. Thornton and N. P. Dasgupta, ACS Cent. Sci., 2016, 2, 790–801 CrossRef CAS PubMed.
- K.-H. Chen, K. N. Wood, E. Kazyak, W. S. LePage, A. L. Davis, A. J. Sanchez and N. P. Dasgupta, J. Mater. Chem. A, 2017, 5, 11671–11681 RSC.
- P. Sayavong, W. Zhang, S. T. Oyakhire, D. T. Boyle, Y. Chen, S. C. Kim, R. A. Vilá, S. E. Holmes, M. S. Kim, S. F. Bent, Z. Bao and Y. Cui, J. Am. Chem. Soc., 2023, 145, 12342–12350 CrossRef CAS PubMed.
- H. Wu, H. Jia, C. Wang, J.-G. Zhang and W. Xu, Adv. Energy Mater., 2021, 11, 2003092 CrossRef CAS.
Footnotes |
| † Electronic supplementary information (ESI) available. See DOI: https://doi.org/10.1039/d3ta05535c |
| ‡ These authors contributed equally to the work. |
| This journal is © The Royal Society of Chemistry 2024 |

