Modulating structures to decouple thermoelectric transport leads to high performance in polycrystalline SnSe†
Yuping
Wang
 a,
Shulin
Bai
a,
Haonan
Shi
a,
Qian
Cao
b,
Bingchao
Qin
a,
Shulin
Bai
a,
Haonan
Shi
a,
Qian
Cao
b,
Bingchao
Qin
 *a and
Li-Dong
Zhao
 *a
*a
aSchool of Materials Science and Engineering, Beihang University, Beijing 100191, China. E-mail: qinbingchao@buaa.edu.cn; zhaolidong@buaa.edu.cn
bHuabei Cooling Device Co. Ltd, Hebei 065400, China
First published on 3rd November 2023
Abstract
In recent years, the thermoelectric properties of SnSe crystals have been rather impressive, while those of polycrystalline SnSe are not ideal due to the grain boundary scattering, which results in impaired carrier mobility and electrical transport. In this work, we introduce the tetragonal-structure AgInSe2 into SnSe matrix, which not only modifies the crystal structure symmetry to boost carrier mobility, but also enlarges effective mass by inducing resonant energy levels near the valence bands. The compromise on carrier mobility and effective mass leads to a substantial optimization of the electrical transport in the measured temperature range, realizing a peak power factor (PF) value of ∼7.1 μW cm−1 K−2 in the 1.5% AgInSe2 alloyed sample, which exhibits nearly 2 times enhancement compared to the unalloyed sample. Subsequently, Ge alloying was introduced to further suppress phonon transport, leading to significantly suppressed lattice thermal conductivities by constructing microstructural point defects. The successive modulation of crystal, band, and microscopic structures facilitates effective phonon-electron decoupling, favoring a prominent peak ZT of ∼1.6 at 773 K in the 0.75% Ge-alloyed (SnSe)0.985(AgInSe2)0.015 sample. Our study provides a systematic strategy to decouple the phonon-electron transport and enhance thermoelectric performance by modulating various aspects of structures.
1. Introduction
In recent years, the energy problems of the Earth have become increasingly serious, and there is an urgent need to develop and research new green energy materials and technologies. Thermoelectrics are green functional materials that utilize internal carrier transport to achieve direct conversion between electrical and thermal energy. On this basis, thermoelectric power generation and electronic cooling utilizing the Seebeck and Peltier effects, respectively, are the two main applications of thermoelectric technology.1–4 After decades of efforts, thermoelectric technology has become crucial in important fields such as aerospace, industry, agriculture, and healthcare due to its advantages of non-pollution, flexibility, reliability, and light weight.5–13Improving the efficiency of thermoelectric devices mainly depends on the dimensionless figure of merit (ZT) of the thermoelectric material. According to the definition of the ZT value, ZT = S2σT/(κele + κlat), it is known that high-performance thermoelectrics should have a large Seebeck coefficient S, high electrical conductivity σ, and low thermal conductivity κtot (composed of κele electronic thermal conductivity and κlat lattice thermal conductivity) at a given absolute temperature T. In general, it is necessary to have excellent electrical transport properties and poor thermal transport properties, corresponding to the phonon-glass and electron-crystal concept.14–17 Meanwhile, from the perspective of practical application, it is important to explore and develop thermoelectric materials with low cost, abundant reserves, and high performance.10,18,19
SnSe is a conventional semiconductor with a wide energy gap of ∼0.86 eV and a large light absorption coefficient. Previously prepared SnSe is usually a p-type semiconductor with a hole concentration of about 1017 cm−3 and electrical conductivity as low as 10−1–10−5 S cm−1 at room temperature. The extremely inferior electrical properties make SnSe not ideal as a potential thermoelectric material, but instead being used in solar cells and photovoltaics.20 Since the discovery of SnSe crystals with high thermoelectric properties (ZT ∼ 2.6 at 923 K) in 2014,21 researchers have gradually developed SnSe crystals as very promising thermoelectric candidates. Benefiting from the strong anharmonicity due to the layered crystal structure and the ultra-high electrical transport properties in the in-plane direction, the research on the thermoelectric properties and internal transport mechanisms of SnSe materials has rapidly become a hot issue in the thermoelectric field.20,22–35 Resultantly, the thermoelectric properties of both p-type36–42 and n-type43–47 SnSe crystals have been substantially improved through years of continuous efforts by researchers. However, compared to the impressive thermoelectric properties of SnSe crystals, the thermoelectric properties of polycrystalline SnSe are not satisfactory. Although polycrystalline SnSe possesses comparably low κlat compared to SnSe crystals, it has unavoidable grain-boundary scattering, which greatly hinders carrier transport and reduces carrier mobility.48–51 In our previous work, we utilized alloying ternary compounds (AgSbTe2, NaSbTe2, and NaSbSe2)52,53 to stabilize the cubic phase of SnSe at ambient temperature and pressure, which exhibit excellent electrical transport properties. The electrical conductivity of the samples after turning into the cubic phase can reach ∼102 S cm−1, which mainly comes from the significant increase in carrier concentration (∼1021 cm−3), while the carrier mobility is still as low as ∼1–2 cm2 V−1 s−1. Meanwhile, we have pointed out that structural control provides a novel strategy for optimizing electrical properties in polycrystalline SnSe, which motivates us to further enhance its thermoelectric performance by focusing on its structures.
In this work, in p-type polycrystalline SnSe doped with 2% Na, we found that carrier mobility and band effective mass could be simultaneously optimized to facilitate electrical transport by modulating the crystal structure and band structure through the incorporation of AgInSe2. Specifically, the carrier mobility increases from ∼4 cm2 V−1 s−1 to ∼15 cm2 V−1 s−1 for AgInSe2-alloyed samples at 300 K, which is mainly attributed to the increased crystal structure symmetry by alloying AgInSe2. Meanwhile, the substitution of Ag and In for Sn sites produces a resonant effect near the valence bands, which enhanced the density-of-states (DOS) effective mass and Seebeck coefficient. Subsequently, we alloyed Ge at the Sn site based on the introduction of 1.5% AgInSe2 for further manipulation of the microstructural defects, which drastically reduces the κlat from ∼1.24 W m−1 K−1 to ∼0.95 W m−1 K−1 at 300 K after strengthening phonon scattering by Ge alloying. After step-by-step modulation of the crystal, band, and microscale structures, significant phonon-electron decoupling along with a peak ZT of ∼1.6 at 773 K were achieved in the p-type (Sn0.9925Ge0.0075Se)0.985(AgInSe2)0.0015 sample. The present results demonstrate a significant advancement in polycrystalline SnSe thermoelectrics for mid-temperature power generation through utilizing the strategy of modulating structures.
2. Experimental section
In this work, polycrystalline samples were all synthesized using the melt method and densified using spark plasma sintering (SPS-211Lx). The direction of thermoelectric property measurement is perpendicular to the direction of SPS pressure. In this work, the samples synthesized are based on 2% Na doping. More experimental details including synthesis methods, measurement methods, and calculation methods are provided in the ESI.†3. Results and discussion
3.1 Thermoelectric performance of SnSe with AgInSe2 alloying
As shown in Fig. 1, AgInSe2 has a tetragonal chalcopyrite structure with space group I![[4 with combining macron]](https://www.rsc.org/images/entities/char_0034_0304.gif) 2d. After the introduction of AgInSe2 into the orthorhombic layered structure of SnSe, powder X-ray diffraction measurements showed that the compounds crystallized in a layered orthorhombic crystalline structure (space group, Pnma). Furthermore, the presence of a second phase was not observed within the instrumental detection limit.
2d. After the introduction of AgInSe2 into the orthorhombic layered structure of SnSe, powder X-ray diffraction measurements showed that the compounds crystallized in a layered orthorhombic crystalline structure (space group, Pnma). Furthermore, the presence of a second phase was not observed within the instrumental detection limit.
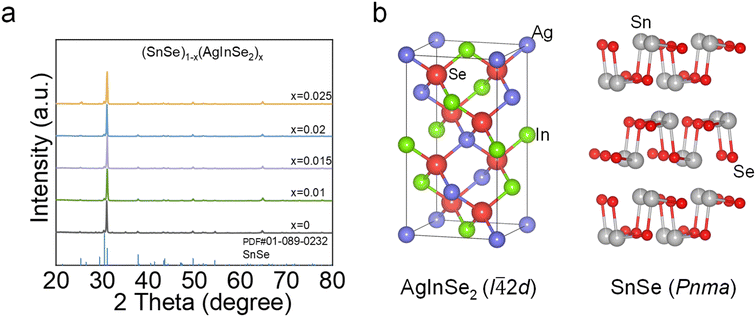 | ||
| Fig. 1 (a) The powder X-ray diffraction (PXRD) patterns of (SnSe)1−x(AgInSe2)x (x = 0, 0.01, 0.015, 0.02, and 0.025); (b) schematic diagram of the crystal structures for AgInSe2 and SnSe. | ||
The electrical transport properties of (SnSe)1−x(AgInSe2)x (x = 0–0.025) are presented in Fig. 2. With the gradually increasing AgInSe2 content, the thermoelectric properties of polycrystalline SnSe were significantly optimized, and the electrical conductivity (Fig. 2a) increased significantly in all temperature ranges (300–700 K). Specifically, the σ demonstrates an approximately 3.5 times increase from ∼25 S cm−1 for SnSe to ∼86 S cm−1 for (SnSe)0.98(AgInSe2)0.02 at 300 K. Electrical conductivity and the Seebeck coefficient are thermoelectric parameters that are coupled to each other, and in general an increase in σ leads to a decrease in the Seebeck coefficient. However, as shown in Fig. 2b, the introduction of AgInSe2 not only drastically optimized the electrical conductivity, but also significantly enhanced the room-temperature Seebeck coefficient. Attributed to the simultaneous increase in σ and S after AgInSe2 alloying, the power factor (PF) is significantly improved over the full temperature range. A PFmax of ∼7.0 μW cm−1 K−2 at 773 K was obtained in (SnSe)0.985(AgInSe2)0.0015. Then we calculated the weighted mobility (μw) of the samples to further evaluate the electrical transport properties of SnSe–AgInSe2, shown in Fig. 2d. The results demonstrated that the addition of AgInSe2 led to a significant enhancement in the weighted mobility of the samples, indicating that AgInSe2 can synergistically optimize carrier mobility and effective mass.
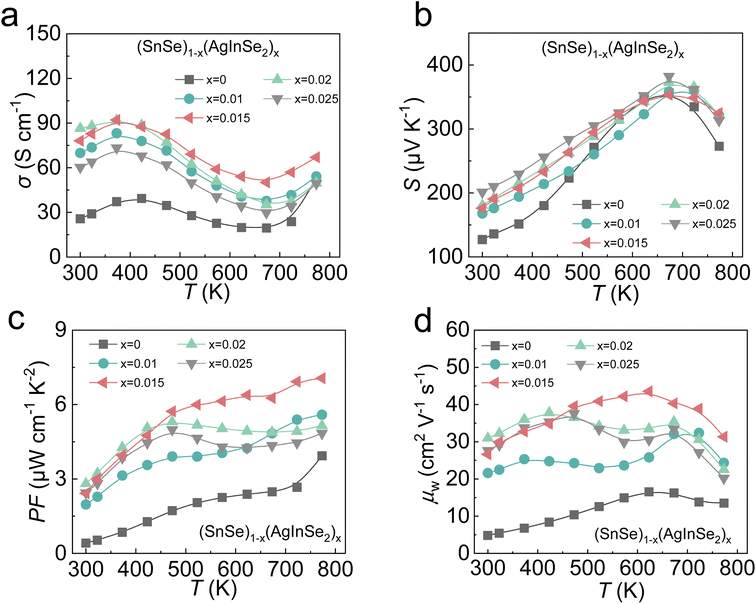 | ||
| Fig. 2 Electrical properties as a function of temperature for (SnSe)1−x(AgInSe2)x compounds. (a) Electrical conductivities; (b) Seebeck coefficients; (c) power factors; (d) weighted mobilities. | ||
To reveal the mechanism for the enhancement of the electrical transport properties, we conducted room-temperature Hall measurements of the samples and obtained the changes in carrier concentration (nH) and carrier mobility (μH) with increasing AgInSe2 concentration. As exhibited in Fig. 3a, with the gradual increase in AgInSe2 content in the SnSe matrix, the carrier concentration decreases gradually, while the carrier mobility increases significantly. Combining the previous electrical conductivity data with the Hall measurement results, it can be noted that although the electrical conductivity was enhanced after the introduction of AgInSe2, the carrier concentration of the sample was slightly reduced. The decrease in carrier concentration can be attributed to the fact that AgInSe2 is intrinsically n-type material,59–61 and the introduction of AgInSe2 into the SnSe matrix resulted in the presence of Se vacancies in the matrix or In3+ replacing Sn2+ to generate electrons, which ultimately led to a slight decrease in carrier concentration. It is well known that carrier concentration and carrier mobility are a pair of mutually coupled thermoelectric parameters, where a decrease in carrier concentration leads to an increase in carrier mobility. Nevertheless, in this work, the introduction of AgInSe2 led to an anomalous increase in carrier mobility, both compared to that of the substrate and other reported carrier mobilities of polycrystalline SnSe (Fig. 3b). This indicates that there are other reasons for the increase in carrier mobility besides the decrease in nH. To reveal the reason for the increase in carrier mobility, we refined the PXRD patterns of the samples using general structure analysis system (GSAS) software,62,63 and the Rietveld refined patterns are shown in Fig. S1.† During the refinement process, to determine whether the parameter adjustments are appropriate, we use χ2 to reflect the quality of the simulation, where a smaller value of χ2 indicates a higher accuracy of refinement. As illustrated in Fig. S1,† there is excellent agreement between the observed data and simulated data for all samples. In the inset of Fig. 3c, the crystal structure of the SnSe Pnma phase along the in-plane direction is briefly depicted, and as the crystal structure of SnSe evolves from the Pnma phase to the Cmcm phase, the angle 1 marked in the figure will gradually become 0. Utilizing the atomic occupancy information obtained from the RXRD refinement results, we obtain the value of angle 1 as a function of AgInSe2 concentration at 300 K, as presented in Fig. 3c. This indicates that the addition of AgInSe2 modifies the crystal structure of the SnSe matrix and increases the crystal structure symmetry, which significantly enhances carrier mobility and electrical transport properties.
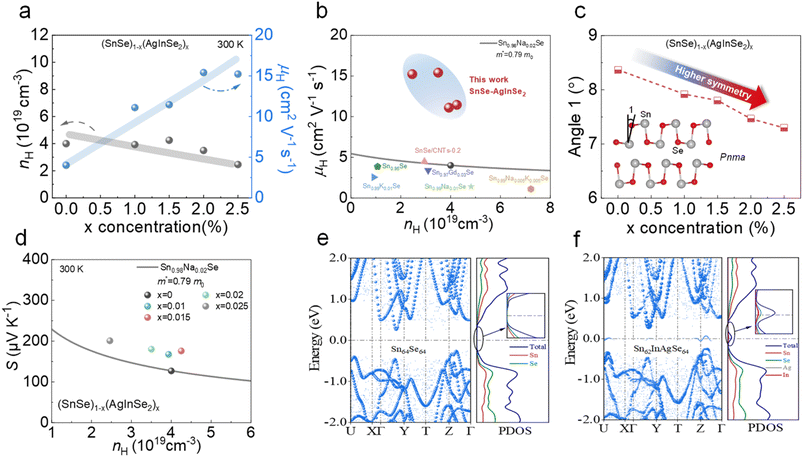 | ||
| Fig. 3 (a) Carrier concentration and carrier mobility as a function of AgInSe2 concentration; (b) comparisons for carrier mobility as a function of carrier concentration in this work and other p-type polycrystalline SnSe samples,54–58 in which m* is the density-of-states effective mass of the Sn0.98Na0.02Se sample and m0 is the electron mass, and m* = 0.79 m0 was derived from the experimental data of the Sn0.98Na0.02Se sample by using the single parabolic band (SPB) model; (c) the values of angle 1 as a function of AgInSe2 concentration, showing that AgInSe2 alloying decreases angle 1 and enhances the crystal symmetry; (d) Pisarenko plots of SnSe–AgInSe2 at 300 K, and the theoretical plot was calculated with m* = 0.79 m0 by using the SPB model; (e) electronic band structures and projected density of states (PDOS) for Sn64Se64; (f) electronic band structures and projected density of state for Sn62AgInSe64. | ||
The Pisarenko plots of SnSe–AgInSe2 demonstrate that the effective mass of the SnSe matrix increases significantly after AgInSe2 alloying. To further analyze the origin of the increase in the effective mass, we conducted first principles calculations of the electronic band structure and projected DOS, shown in Fig. 3e and f. The introduction of AgInSe2 creates resonance energy levels near the valence band, which increases the energy integral near the Fermi energy level and steepens the curve, thus increasing the effective mass, compared to the unalloyed samples. Meanwhile, according to the PDOS plot on the right side, the generation of resonance energy levels is attributed to the bonding with Se atoms produced by Ag and In replacing the Sn sites. Overall, AgInSe2 alloying simultaneously adjusts the crystal symmetry to increase the carrier mobility and induces resonance energy levels to enhance the effective mass, which decouples the effective mass and μH for synergistic optimization of the σ and S.
The κtot of AgInSe2-alloyed SnSe as a function of temperature is shown in Fig. 4a. κtot consists of κele and κlat (Fig. S2†), in which the κele is influenced by the electrical conductivity, and the κlat is a relatively independent parameter. The calculated κtot related parameters including the density of the sample (ρ), the specific heat (Cp), and the thermal diffusion coefficient (D) are displayed in Fig. S3 and Table S1.† AgInSe2 alloying substantially optimizes the electrical transport properties while the thermal properties of the samples are not optimized, with a slight increase in the κtot. The ZT values of the SnSe–AgInSe2 samples are displayed in Fig. 4b. The introduction of AgInSe2 resulted in a significant improvement in the ZT value, owing to a dramatic optimization of the electrical transport properties, which was attributed to the decoupling of carrier mobility and effective mass. Specifically, a ZTmax of ∼1.0 at 773 K was achieved in (SnSe)0.985(AgInSe2)0.015.
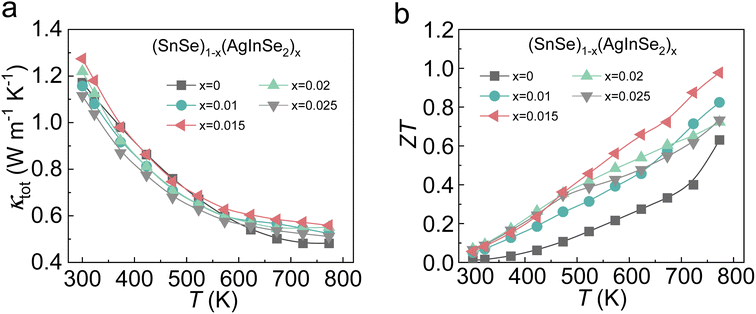 | ||
| Fig. 4 Temperature-dependent thermoelectric properties for (SnSe)1−x(AgInSe2)x compounds: (a) total thermal conductivities; (b) ZT values. | ||
3.2 Thermoelectric performance of SnSe–AgInSe2 with Ge alloying
Due to the limited ability of AgInSe2 to modulate thermal transport properties, Ge was chosen to further optimize the thermoelectric properties. We introduced Ge at the Sn site based on the optimal composition of alloyed AgInSe2 in the previous section. Fig. S4† demonstrates the PXRD patterns of (Sn1−yGeySe)0.985(AgInSe2)0.015 (y = 0, 0.005, 0.0075, 0.01, and 0.0125) samples, indicating that we acquired a single-phase with the Pnma phase without any impurity phases. As shown in Fig. 5a, the introduction of Ge effectively reduces the lattice thermal conductivity over the whole temperature range, which is the main source of the total thermal conductivity reduction. Specifically, there is a ∼20% reduction in room-temperature lattice thermal conductivity after alloying Ge, which decreases from ∼1.24 W m−1 K−1 for (SnSe)0.985(AgInSe2)0.015 to ∼0.95 W m−1 K−1 for (Sn0.9875Ge0.0125Se)0.985(AgInSe2)0.015. To reveal the origin of the κlat reduction, we simulated the effect of point defects on κlat utilizing the Callaway model in the case of (SnSe)0.985(AgInSe2)0.015 alloying with Ge. As schematically shown in Fig. 5b, the gray dotted line represents the theoretical curve of κlat after alloying Ge in the Sn site, while the green dots in the graph indicate the experimental data points of (Sn1−yGeySe)0.985(AgInSe2)0.015. The calculated results demonstrate that the measured values are well-fitted to the calculated plots. Therefore, the significant decrease in room-temperature κlat can be explained by enhanced phonon scattering by Ge alloying, which is further confirmed by both experimental results and theoretical calculations. By conducting room-temperature Hall measurements, the carrier concentrations of the samples decrease after Ge alloying. On analysis the carrier concentration decreases mainly because the electronegativity of Ge (∼2.01) is slightly higher than the electronegativity of Sn (∼1.96),67 and the difference in electronegativity between Ge and Se becomes smaller after Ge replacing Sn.68,69 Therefore, Ge has a stronger covalent bonding with Se and binds the outer electrons more strongly, which makes it difficult to lose electrons, so the carrier concentration is reduced. Meanwhile, the carrier mobility of the SnSe system increased after the introduction of Ge, which increased from ∼11.4 cm2 V−1 s−1 for (SnSe)0.985(AgInSe2)0.015 to ∼15.5 cm2 V−1 s−1 for (Sn0.9875Ge0.0125Se)0.985(AgInSe2)0.015. To conclude, the μH and the inverse of the lattice thermal conductivity (1/κlat) are presented in Fig. 5d. As can be seen from Fig. 5d, alloying Ge in SnSe–AgInSe2 can balance between carrier and phonon transport and realize phonon-electron decoupling.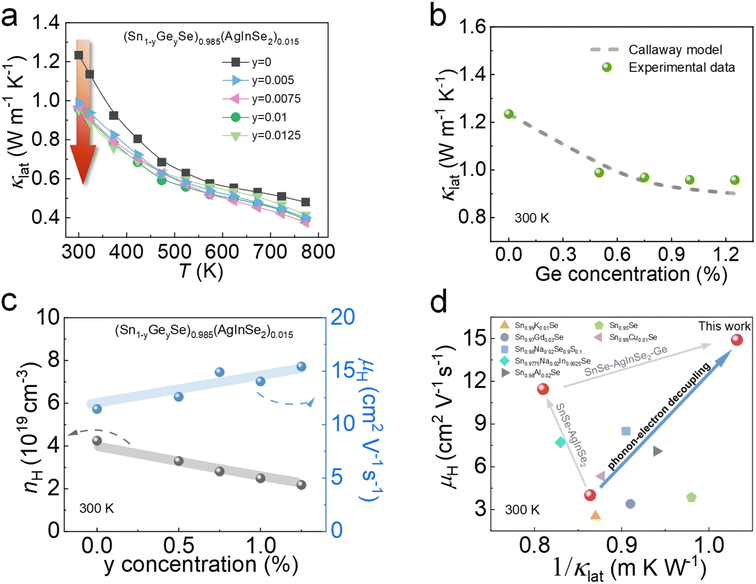 | ||
| Fig. 5 Temperature-dependent thermoelectric properties for (Sn1−yGeySe)0.985(AgInSe2)0.015 compounds: (a) lattice thermal conductivities; (b) lattice thermal conductivity comparison between calculated data using the Callaway model and experimental data at 300 K; (c) room-temperature carrier concentrations and carrier mobilities as s function of Ge concentration; (d) the synergistic optimization of carrier mobility and lattice thermal conductivity in this work and other p-type SnSe samples.48,54,56,58,64–66 | ||
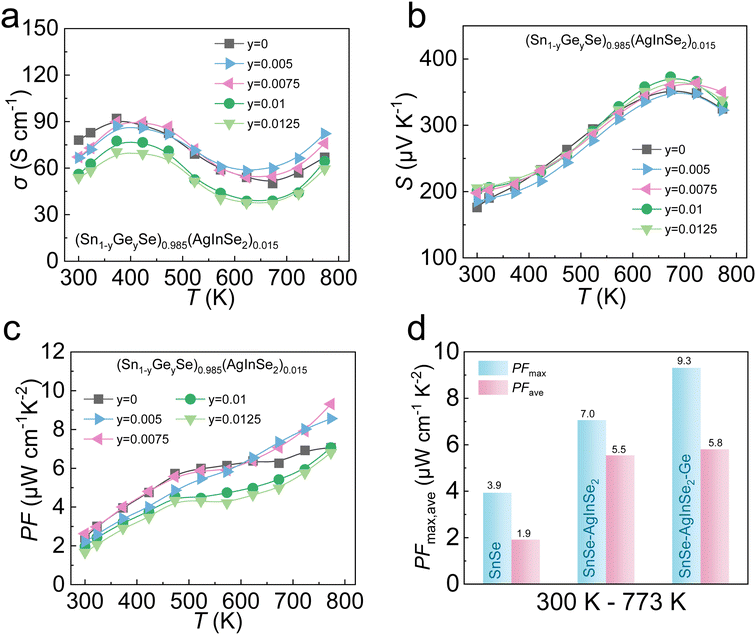
The electrical transport properties of Ge-alloyed samples are depicted in Fig. 6. Fig. 6a exhibits the σ of (Sn1−yGeySe)0.985(AgInSe2)0.015 samples with increasing temperature. Attributed to the decreased carrier concentration by the introduction of Ge, the σ significantly decreased from ∼78 S cm−1 for (SnSe)0.985(AgInSe2)0.015 to ∼54 S cm−1 for (Sn0.9875Ge0.0125Se)0.985(AgInSe2)0.015 at 300 K. Meanwhile, the S is enhanced over the measurement temperature range (Fig. 6b), which is attributed to the decrease in nH. Combined with the effects of σ and S, the PFmax values were further enhanced after alloying Ge. Ultimately, the PFmax ∼9.3 μW cm−1 K−2 at 773 K was obtained in (Sn0.9925Ge0.0075Se)0.985(AgInSe2)0.0015. Compared to the PFmax value of ∼4.0 μW cm−1 K−2 for untreated SnSe, the PFmax value of the samples after alloying AgInSe2 and Ge shows a nearly three times improvement, as shown in Fig. 6d.
The ZT values as a function of temperature for (Sn1−yGeySe)0.985(AgInSe2)0.015 samples are demonstrated in Fig. 7a. Owing to the phonon-electron decoupling caused by Ge alloying, the κlat is significantly reduced after the introduction of Ge while the electrical transport properties remain at a relatively high level. Specifically, a peak ZT ∼ 1.6 is achieved by alloying 0.0075 Ge in an (SnSe)0.985(AgInSe2)0.015 system. The (Sn0.9925Ge0.0075Se)0.985(AgInSe2)0.0015 sample obtained in this work had much higher ZT values compared with the previously reported p-type polycrystalline SnSe systems, as shown in Fig. 7b.
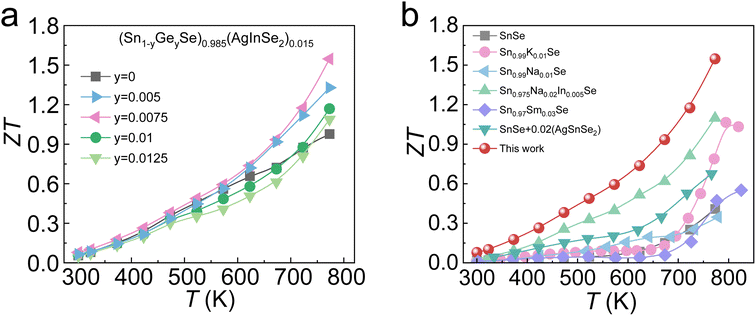 | ||
| Fig. 7 (a) Temperature-dependent ZT values for (Sn1−yGeySe)0.985(AgInSe2)0.015 samples; (b) ZT values of this work and other p-type polycrystalline SnSe systems48,58,70–72 from 300 K to 850 K. | ||
4. Conclusions
In this work, a remarkable optimization of the thermoelectric performance of polycrystalline SnSe was achieved through decoupling of the phonon and electron transport via the utilization of the stepwise triple-structural modulation strategy. Firstly, AgInSe2 plays crucial roles in facilitating the electrical transport by modifying the crystal structure symmetry and electronic band structure near the Fermi level, achieving a substantial balance between carrier mobility and effective mass after alloying AgInSe2. The peak PF can reach ∼7.0 μW cm−1 K−2 in (SnSe)0.985(AgInSe2)0.015 at 773 K, with an ultrahigh PFave of ∼5.5 μW cm−1 K−2 from 300 to 773 K. Secondly, the Ge alloying-induced microstructural point defects strongly suppress phonon transport, thus reducing κlat without worsening the carrier transport. Ultimately, the peak ZT achieves a tremendous elevation from ∼0.6 to 1.6 at 773 K in the sample p-type polycrystalline (Sn0.9925Ge0.0075Se)0.985(AgInSe2)0.0015. The present results further advance p-type polycrystalline SnSe thermoelectrics as effective candidates for waste heat recovery, and the stepwise strategy of modulating structures to decouple phonon-electron transport can be further implemented in various thermoelectric systems.Conflicts of interest
There are no conflicts of interest to declare.Acknowledgements
The work was in part supported by the National Natural Science Foundation of China (52250090, 52002042, 51571007, and 51772012), the National Key Research and Development Program of China (2018YFA0702100), the Beijing Natural Science Foundation (JQ18004), the 111 Project (B17002), and the National Science Fund for Distinguished Young Scholars (51925101). B. Q. acknowledges support from the China National Postdoctoral Program for Innovative Talents (BX20230456).References
- B. Qin and L.-D. Zhao, Science, 2022, 378, 832–833 CrossRef CAS.
- G. J. Tan, L.-D. Zhao and M. G. Kanatzidis, Chem. Rev., 2016, 116, 12123–12149 CrossRef CAS.
- G. J. Snyder and E. S. Toberer, Nat. Mater., 2008, 7, 105–114 CrossRef CAS.
- J. R. Sootsman, D. Y. Chung and M. G. Kanatzidis, Angew Chem. Int. Ed. Engl., 2009, 48, 8616–8639 CrossRef CAS.
- L. E. Bell, Science, 2008, 321, 1457–1461 CrossRef CAS PubMed.
- K. Biswas, J. He, I. D. Blum, C. I. Wu, T. P. Hogan, D. N. Seidman, V. P. Dravid and M. G. Kanatzidis, Nature, 2012, 489, 414–418 CrossRef CAS PubMed.
- J. P. Heremans, M. S. Dresselhaus, L. E. Bell and D. T. Morelli, Nat. Nanotechnol., 2013, 8, 471–473 CrossRef CAS PubMed.
- Z. H. Liu, W. Gao, F. K. Guo, W. Cai, Q. Zhang and J. H. Sui, Materials Lab, 2022, 1, 220003 Search PubMed.
- Y. Xiao, Materials Lab, 2022, 1, 220025 Search PubMed.
- W. T. Xu and S. X. Yang, Materials Lab, 2022, 1, 220033 Search PubMed.
- X. L. Shi, J. Zou and Z.-G. Chen, Chem. Rev., 2020, 120, 7399–7515 CrossRef CAS PubMed.
- T. Zhu, Y. Liu, C. Fu, J. P. Heremans, J. G. Snyder and X. Zhao, Adv. Mater., 2017, 29, 1605884 CrossRef.
- X. Zhang and L.-D. Zhao, J. Materiomics, 2015, 1, 92–105 CrossRef.
- G. S. Nolas, D. T. Morelli and T. M. Tritt, Annu. Rev. Mater. Sci., 1999, 29, 89–116 CrossRef CAS.
- C.-R. Guo, B.-C. Qin, D.-Y. Wang and L.-D. Zhao, Rare Met, 2022, 41, 3803–3814 CrossRef CAS.
- H. Pang, X. Zhang, D. Wang, R. Huang, Z. Yang, X. Zhang, Y. Qiu and L.-D. Zhao, J. Materiomics, 2022, 8, 184–194 CrossRef.
- S.-N. Wang, H.-C. Lu, D.-J. Li, Y. Jin, X.-Y. Li, Y. Yan, K. Gu, Y.-T. Qiu and L.-D. Zhao, Rare Met, 2023, 42, 3601–3606 CrossRef CAS.
- Y. M. Zhou and L.-D. Zhao, Adv. Mater., 2017, 29, 1702676 CrossRef PubMed.
- B. C. Qin, Y. Xiao, Y. M. Zhou and L.-D. Zhao, Rare Met, 2018, 37, 343–350 CrossRef CAS.
- D. R. Liu, B. C. Qin and L.-D. Zhao, Materials Lab, 2022, 1, 220006 Search PubMed.
- L.-D. Zhao, S. H. Lo, Y. Zhang, H. Sun, G. Tan, C. Uher, C. Wolverton, V. P. Dravid and M. G. Kanatzidis, Nature, 2014, 508, 373–377 CrossRef CAS PubMed.
- L.-D. Zhao, C. Chang, G. J. Tan and M. G. Kanatzidis, Energy Environ. Sci., 2016, 9, 3044–3060 RSC.
- L. Xie, D. S. He and J. Q. He, Mater. Horiz., 2021, 8, 1847–1865 RSC.
- F. Li, H. Wang, R. Huang, W. Chen and H. Zhang, Adv. Funct. Mater., 2022, 32, 2200516 CrossRef CAS.
- W. Xu, P.-P. Shang, A. Marcelli, G. Cibin and J.-F. Li, Mater. Today Phys., 2022, 24, 100656 CrossRef CAS.
- S. Sassi, C. Candolfi, J.-B. Vaney, V. Ohorodniichuk, P. Masschelein, A. Dauscher and B. Lenoir, Mater. Today: Proc., 2015, 2, 690–698 Search PubMed.
- Y. Xiao, C. Chang, Y. L. Pei, D. Wu, K. L. Peng, X. Y. Zhou, S. K. Gong, J. Q. He, Y. S. Zhang, Z. Zeng and L.-D. Zhao, Phys. Rev. B, 2016, 94, 125203 CrossRef.
- C. Chang, B. Qin, L. Su and L.-D. Zhao, Sci. Bull., 2022, 67, 1105–1107 CrossRef CAS.
- M. Sist, J. Zhang and B. Brummerstedt Iversen, Acta Crystallogr., 2016, B72, 310–316 Search PubMed.
- C. Chang, G. Tan, J. He, M. G. Kanatzidis and L.-D. Zhao, Chem. Mater., 2018, 30, 7355–7367 CrossRef CAS.
- C. Chang and L.-D. Zhao, Mater. Today Phys., 2018, 4, 50–57 CrossRef.
- Z. G. Chen, X. L. Shi, L.-D. Zhao and J. Zou, Prog. Mater. Sci., 2018, 97, 283–346 CrossRef CAS.
- Y. C. Zhou, W. Li, M. H. Wu, L.-D. Zhao, J. Q. He, S. H. Wei and L. Huang, Phys. Rev. B, 2018, 97, 245202 CrossRef CAS.
- M. Luo, Y. Xu and Y. Shen, Results Phys., 2020, 17, 103126 CrossRef.
- S. Gowthamaraju, U. P. Deshpande and P. A. Bhobe, Curr. Appl. Phys., 2021, 24, 19–23 CrossRef.
- K. L. Peng, X. Lu, H. Zhan, S. Hui, X. D. Tang, G. W. Wang, J. Y. Dai, C. Uher, G. Y. Wang and X. Y. Zhou, Energy Environ. Sci., 2016, 9, 454–460 RSC.
- L.-D. Zhao, G. J. Tan, S. Q. Hao, J. Q. He, Y. L. Pei, H. Chi, H. Wang, S. K. Gong, H. B. Xu, V. P. Dravid, C. Uher, G. J. Snyder, C. Wolverton and M. G. Kanatzidis, Science, 2016, 351, 141–144 CrossRef CAS PubMed.
- B. C. Qin, D. Y. Wang, W. K. He, Y. Zhang, H. J. Wu, S. J. Pennycook and L.-D. Zhao, J. Am. Chem. Soc., 2019, 141, 1141–1149 CrossRef CAS.
- B. C. Qin, W. K. He and L.-D. Zhao, J. Materiomics, 2020, 6, 671–676 CrossRef.
- B. C. Qin, Y. Zhang, D. Y. Wang, Q. Zhao, B. C. Gu, H. J. Wu, H. J. Zhang, B. J. Ye, S. J. Pennycook and L.-D. Zhao, J. Am. Chem. Soc., 2020, 142, 5901–5909 CrossRef CAS PubMed.
- B. C. Qin, D. Y. Wang, X. X. Liu, Y. X. Qin, J.-F. Dong, J. F. Luo, J.-W. Li, W. Liu, G. J. Tan, X. F. Tang, J.-F. Li, J. Q. He and L.-D. Zhao, Science, 2021, 373, 556–561 CrossRef CAS PubMed.
- B. C. Qin, D. Y. Wang, T. Hong, Y. P. Wang, D. R. Liu, Z. Y. Wang, X. Gao, Z.-H. Ge and L.-D. Zhao, Nat. Commun., 2023, 14, 1366 CrossRef CAS PubMed.
- C. Chang, M. H. Wu, D. S. He, Y. L. Pei, C.-F. Wu, X. F. Wu, H. L. Yu, F. Y. Zhu, K. D. Wang, Y. Chen, L. Huang, J.-F. Li, J. Q. He and L.-D. Zhao, Science, 2018, 360, 778–783 CrossRef CAS PubMed.
- C. Chang, D. Y. Wang, D. S. He, W. K. He, F. Y. Zhu, G. T. Wang, J. Q. He and L.-D. Zhao, Adv. Energy Mater., 2019, 9, 1901334 CrossRef.
- L. S. Mao, Y. N. Yin, Q. Zhang, G. Q. Liu, H. X. Wang, Z. Guo, H. Y. Hu, Y. K. Xiao, X. J. Tan and J. Jiang, Energy Environ. Sci., 2020, 13, 616–621 RSC.
- L. Z. Su, D. Y. Wang, S. N. Wang, B. C. Qin, Y. P. Wang, Y. X. Qin, Y. Jin, C. Chang and L.-D. Zhao, Science, 2022, 375, 1385–1389 CrossRef CAS.
- H. Shi, L. Su, S. Bai, B. Qin, Y. Wang, S. Liu, C. Chang and L.-D. Zhao, Energy Environ. Sci., 2023, 16, 3128–3136 RSC.
- Y. P. Wang, B. C. Qin, D. Y. Wang, T. Hong, X. Gao and L.-D. Zhao, Rare Met, 2021, 40, 2819–2828 CrossRef CAS.
- Y. P. Wang, B. C. Qin and L.-D. Zhao, Appl. Phys. Lett., 2021, 119, 044103 CrossRef CAS.
- L.-D. Zhao, S. N. Wang and Y. Xiao, Acta Metall. Sin., 2021, 57, 1171–1183 CAS.
- B. C. Qin and L.-D. Zhao, Materials Lab, 2022, 1, 220004 Search PubMed.
- Y. P. Wang, B. C. Qin, T. Hong, L. Z. Su, X. Gao, D. Y. Wang and L.-D. Zhao, Acta Mater., 2022, 227, 117681 CrossRef CAS.
- Y. P. Wang, B. C. Qin, H. N. Shi, L. Z. Su, D. Y. Wang and L.-D. Zhao, Acta Mater., 2023, 247, 118754 CrossRef CAS.
- W. Wei, C. Chang, T. Yang, J. Liu, H. Tang, J. Zhang, Y. Li, F. Xu, Z. Zhang, J. F. Li and G. Tang, J. Am. Chem. Soc., 2018, 140, 499–505 CrossRef CAS.
- X. Liu, H. Wang, Y. Chen, B. Zhang, H. Zhang, S. Zheng, X. Chen, X. Lu, G. Wang, X. Zhou and G. Han, Scr. Mater., 2022, 218, 114846 CrossRef CAS.
- S. Chandra, P. Dutta and K. Biswas, ACS Appl. Energy Mater., 2020, 3, 9051–9057 CrossRef CAS.
- Y. X. Chen, Z. H. Ge, M. J. Yin, D. Feng, X. Q. Huang, W. Y. Zhao and J. Q. He, Adv. Funct. Mater., 2016, 26, 6836–6845 CrossRef CAS.
- Z. H. Ge, D. Song, X. Chong, F. Zheng, L. Jin, X. Qian, L. Zheng, R. E. Dunin-Borkowski, P. Qin, J. Feng and L.-D. Zhao, J. Am. Chem. Soc., 2017, 139, 9714–9720 CrossRef CAS.
- P. Qiu, Y. Qin, Q. Zhang, R. Li, J. Yang, Q. Song, Y. Tang, S. Bai, X. Shi and L. Chen, Adv. Sci., 2017, 5, 1700727 CrossRef.
- Y. Zhu, Y. Liu, M. Wood, N. Z. Koocher, Y. Liu, L. Liu, T. Hu, J. M. Rondinelli, J. Hong, G. J. Snyder and W. Xu, Chem. Mater., 2019, 31, 8182–8190 CrossRef CAS.
- Y. Zhu, B. Wei, J. Liu, N. Z. Koocher, Y. Li, L. Hu, W. He, G. Deng, W. Xu, X. Wang, J. M. Rondinelli, L.-D. Zhao, G. J. Snyder and J. Hong, Mater. Today Phys., 2021, 19, 100428 CrossRef CAS.
- B. H. Toby, J. Appl. Crystallogr., 2001, 34, 210–213 CrossRef CAS.
- T. Y. Yang, W. Wen, G. Z. Yin, X. L. Li, M. Gao, Y. L. Gu, L. Li, Y. Liu, H. Lin, X. M. Zhang, B. Zhao, T. K. Liu, Y. G. Yang, Z. Li, X. T. Zhou and X. Y. Gao, Nucl. Sci. Tech., 2015, 26, 020101 Search PubMed.
- Q. Zhao, D. Y. Wang, B. C. Qin, G. T. Wang, Y. T. Qiu and L.-D. Zhao, J. Solid State Chem., 2019, 273, 85–91 CrossRef CAS.
- N. Xin, Y. F. Li, H. Shen, L. Y. Shen and G. H. Tang, J. Materiomics, 2022, 8, 475–488 CrossRef.
- Y. Gong, C. Chang, W. Wei, J. Liu, W. Xiong, S. Chai, D. Li, J. Zhang and G. Tang, Scr. Mater., 2018, 147, 74–78 CrossRef CAS.
- K. Li and D. Xue, J. Phys. Chem. A, 2006, 110, 11332–11337 CrossRef CAS PubMed.
- S. Chandra and K. Biswas, J. Am. Chem. Soc., 2019, 141, 6141–6145 CrossRef CAS PubMed.
- Q. Zhao, B. C. Qin, D. Y. Wang, Y. T. Qiu and L.-D. Zhao, ACS Appl. Energy Mater., 2019, 3, 2049–2054 CrossRef.
- J. Gao, H. Zhu, T. Mao, L. Zhang, J. Di and G. Xu, Mater. Res. Bull., 2017, 93, 366–372 CrossRef CAS.
- H. Huo, Y. Zhang, K. Guo, X. Yang, J. Xing, S. Li, J. Zhang and J. Luo, J. Alloys Compd., 2022, 908, 164649 CrossRef CAS.
- N. Xin, Y. F. Li, G. H. Tang and L. Y. Shen, J. Alloys Compd., 2022, 899, 163358 CrossRef CAS.
Footnote |
| † Electronic supplementary information (ESI) available. See DOI: https://doi.org/10.1039/d3ta06373a |
| This journal is © The Royal Society of Chemistry 2024 |

