 Open Access Article
Radiation resistant chalcopyrite CIGS solar cells: proton damage shielding with Cs treatment and defect healing via heat-light soaking†
Tzu-Ying
Lin
 *a,
Chi-Feng
Hsieh
a,
Ayaka
Kanai
 b,
Takahiko
Yashiro
c,
Wen-Jing
Zeng
d,
Jian-Jie
Ma
d,
Sung-Fu
Hung
 d and
Mutsumi
Sugiyama
c
aDepartment of Materials Science and Engineering, National Tsing Hua University, 101, Sec. 2, Kuang-Fu Road, Hsinchu 300044, Taiwan R. O. C.
bDepartment of Electrical, Electronics and Information Engineering, Nagaoka University of Technology, 1603-1 Kamitomioka, Nagaoka, Niigata 940-2188, Japan
cResearch Institute of Science and Technology, Tokyo University of Science, 2641 Yamazaki, Noda, 278-8510, Japan
dDepartment of Applied Chemistry, National Yang Ming Chiao Tung University, No. 1001, Daxue Rd. East Dist., Hsinchu 300093, Taiwan R. O. C.
First published on 26th February 2024
Abstract
Cu(In, Ga)Se2 (CIGS) solar cells are recognized as next-generation space technology due to their flexibility, lightweight nature, and excellent environmental stability. However, assessing their radiation durability remains challenging, necessitating thorough exploration for space viability. We conduct proton irradiation field tests with varying dosages at 380 keV. Both irradiated control and Cs-treated CIGS solar cells demonstrate impressive efficiency recovery after undergoing heat-light soaking (HLS), exceeding 97% and 100%, respectively. Interestingly, Cs-treated CIGS exhibits higher radiative emission intensity even under high fluence irradiation, indicating a shielding effect within the Cs-compound that protects the inner CIGS grains. Leveraging the knowledge gained from power-dependence, temperature-dependence PL, and time-resolved photoluminescence (TRPL), valuable insights into radiation damage, such as potential fluctuations and transitions involving donor–acceptor pairs, are obtained. X-ray absorption near-edge spectroscopy (XANES) and extended X-ray absorption fine structure (EXAFS) spectra further verify the formation of Frenkel defect pairs within the CIGS during irradiation. Remarkably, following HLS treatment, the K-edge shifts back to its initial state, implying a reversible defect healing mechanism. The harsh proton irradiation is first conducted on CIGS solar cells that have a power conversion efficiency exceeding 17%. This accomplishment firmly establishes CIGS thin-film solar cells as the iconic choice for space applications.
1. Introduction
Photovoltaic devices based on copper indium gallium selenide (CIGS) absorbers have achieved a certified power conversion efficiency (PCE) of 23.6% (ref. 1 and 2) in single-junction devices and obtained a PCE above 24% (ref. 3) in monolithic tandem devices, in which the best PCE is comparable to that of mature photovoltaics, such as cadmium telluride (CdTe, champion PCE of 22.1%),4 crystalline silicon (c-Si SHJ–IBC, champion PCE of 26.7%),5,6 and gallium arsenide (GaAs single junction, champion PCE of 27.8%)4 solar cells.Much of the work on processing bottleneck efficiency deals with post-deposition treatment (PDT) involving alkali-metal (AM) incorporation into CIGS solar cells. Specifically, heavy AMs rubidium (Rb) and cesium (Cs) assist in achieving PCE improvements exceeding 22%.7,8 Additionally, Cs treatment stands out as a pivotal factor contributing to the attainment of the previous record PCE of 23.35%.9 Heavy AM ions prefer to accumulate at grain boundaries and interfaces due to their large ionic radius,10–14 where they easily interact with Cu-poor grain surfaces to form alkali-In (Ga)-Se species.15 These changes modify the CIGS surface state and lead to grain boundary (GB) reconstruction in the CIGS absorber, resulting in recombination reduction and a longer lifetime. With increasing efficiency, the natural advantages of the high radiation resistance of CIGS and thin film characteristics, coupled with lightweight properties and high specific power, render CIGS solar cells as a promising technology in some special application scenarios, for instance, space applications.
CIGS thin-film solar cells have been reported to have excellent radiation tolerance. In the terrestrial test, CIGS shows great resistance to high-energy electron irradiation16 and gamma rays;17 although it is still degraded by higher-fluence proton irradiation like other types of solar cells, its photovoltaic performance can recover significantly under light illumination.18,19 The flight data of Mission Demonstration-test Satellite No. 1 (MDS-1) launched in 2002 also demonstrate almost no significant degradation in CIGS solar cell performance in the geostationary orbit (GTO) for 400 days.20–23 Researchers suggest that the excellent flight result is attributed to the solar paddles' ability to recover effectively under the moderate temperatures experienced during operation in space, due to exposure to sunlight. Still, while protons constitute the majority of galactic cosmic rays, accounting for about 90% or more of the total cosmic ray flux, the damage to material properties from high-fluence proton irradiation and recovery mechanism remains largely unexplored. Also, the heavy AM Cs incorporation in chalcopyrite CIGS may provide new insights into and understanding of radiation resistance in addition to efficiency improvement. In fact, Cs halides, such as cesium fluoride (CsF) or cesium iodide (CsI), have found extensive applications in radiation measurements and medical treatments due to their excellent ability to efficiently absorb and attenuate X-rays and gamma-rays. CsF and CsI crystals possess high atomic numbers and density, making them effective in absorbing ionizing radiation, which is a critical feature for various applications such as radiation detectors, scintillators, and imaging devices in the medical field.24–27 However, the investigation into the absorption of protons using Cs-treated CIGS has not been thoroughly explored.
In this work, we compare the CIGS solar cells without and with Cs treatment based on cell performance after proton irradiation at two different dosages, and then investigate the reversible and irreversible properties and behaviors after the heat-light soaking (HLS) treatment. Through the photoluminescence studies, the proton damage-induced defect and/or defect pairs are clarified, and it is also the first time that a “defect healing” recovery property is explicitly verified based on the heat and light effect through X-ray absorption spectroscopy (XAS). Besides, the reconstructed GBs and surface of CIGS on Cs treatment behave as a shielding material and show a new mechanism for radiation resistance. Since solar technology is the major power used during space missions, keeping life support and vital spacecraft systems working, the scientific knowledge of space solar power can hopefully accelerate technological developments. This work provides new insights into CIGS thin film solar cells as next-generation space solar cells, which are beneficial for their usage in harsh radiation environments for future space exploration.
2. Experimental
2.1 Sample preparation
The experimental method is described briefly below. The details appear in our previous report on the CsF-treated CIGS solar cells.10 Approximately 2-μm-thick CIGS thin films were prepared by the three-stage co-evaporation process at a maximum substrate temperature of 525 °C on Mo-coated SLG substrates. CsF was post-deposited on the air-exposed CIGS thin films at a substrate temperature of 350 °C for 1 min. The control and CsF-PDT CIGS thin films were rinsed with high-purity distilled water. Following this step, 50-nm-thick chemical bath deposition-CdS (CBD-CdS) buffer layers were deposited onto the control and Cs-treated CIGS layers. The completed CIGS solar cell structure was Al/Ni/ZnO:Al/ZnO/CBD-CdS/CIGS/Mo/SLG. Average chemical composition of CIGS thin films was determined to be [Cu]/([Ga] + [In]) (CGI) = 0.94 and [Ga]/([Ga] + [In]) (GGI) = 0.35 using inductively coupled plasma mass spectrometry (ICP-MS). Proton irradiation was performed with an energy of 380 keV with fluences of 1 × 10¹² and 3 × 1014 cm−2 using an ion implanter using the QST (Takasaki) TIARA facility supported by the Inter-University Program for the Joint-use of JAEA/QST Facilities. And dosimetry is carried out by integrating the beam current. Heat-light soaking (HLS) involved subjecting the samples to 1 sun AM 1.5 illumination in air at a temperature of 140 °C for a duration of 30 minutes. Heat soaking (HS) and light soaking (LS) were carried out separately, with HS referring to post-annealing the samples at 140 °C in air for 30 minutes, while LS involved illuminating the samples for 30 minutes. The cells before irradiation were labeled as control samples C1, C2, C3, and C4, all of which were fabricated in the same batch. The samples from the same batch that underwent CsF-PDT treatment were denoted as Cs1 and Cs2. Low proton fluence (1 × 1012 cm−2) irradiation was applied to C1 and Cs1, resulting in p-C1 and p-Cs1, respectively. Higher proton fluence (3 × 1014 cm−2) irradiation was performed on C2, C3, C4, and Cs2, resulting in p-C2, p-C3, p-C4, and p-Cs2, respectively. HLS treatment was further conducted on p-C1, p-C2, p-Cs1, and p-Cs2, leading to their identification as HLS-p-C1, HLS-p-C2, HLS-p-Cs1, and HLS-p-Cs2. HS and LS tests were conducted on p-C3 and p-C4, respectively, resulting in HS-p-C3 and LS-p-C4. To ensure precise state evaluations, all measurements taken after HLS, HS or LS were thoroughly assessed after allowing them to cool to room temperature overnight in a dark environment.2.2 Characterization
The photovoltaic performance of the CIGS solar cells was determined from the current density–voltage (J–V) curves measured under AM 1.5 conditions at an illumination of 100 mW cm−2 at room temperature (Yamashita Denso Corporation YSS-80), calibrated by using a standard Si solar cell certified at the National Institute of Advanced Industrial Science and Technology. External quantum efficiency (EQE) was measured from 350–1400 nm with a xenon lamp that was calibrated using silicon and germanium reference cells. Kelvin probe force microscopy (KPFM) in amplitude modulated mode was used to obtain the local topography and surface contact potential to differentiate the work function difference (Bruker, Dimension ICON). Conductive silicon tips on a silicon nitride cantilever (frequency: 70 kHz; stiffness: 2 N m−1) were used as the sensors. Room temperature photoluminescence PL (RT-PL) and time-resolved photoluminescence (TRPL) measurements were carried out using a laser power of 1.1 mW cm−2 and wavelength of 532.0 nm (Hamamatsu, C12132). Low-temperature photoluminescence (LT-PL) measurements were carried out using the 532.0 nm line of the Nd:YAG laser (100 mW) as the excitation source. Phase-sensitive detection was carried out by utilizing a monochromator with 50 cm focal length and a 600 groove mm−1 grating along with a liquid N2-cooled Ge photodetector. X-ray absorption spectroscopy (XAS) of Cu, Ga and Se, comprising X-ray absorption near edge spectroscopy (XANES) and extended X-ray absorption fine structure (EXAFS), was performed in fluorescence mode at the BL44A beamline of TPS and 12B2 beamline of SPring-8, National Synchrotron Radiation Research Center (NSRRC), Taiwan. Both KPFM and XAS measurements were carried out on the CIGS absorbers before and after irradiation. PL-related characterization was carried out on the solar cell devices before and after irradiation.3. Results and discussion
3.1 Photovoltaic performance
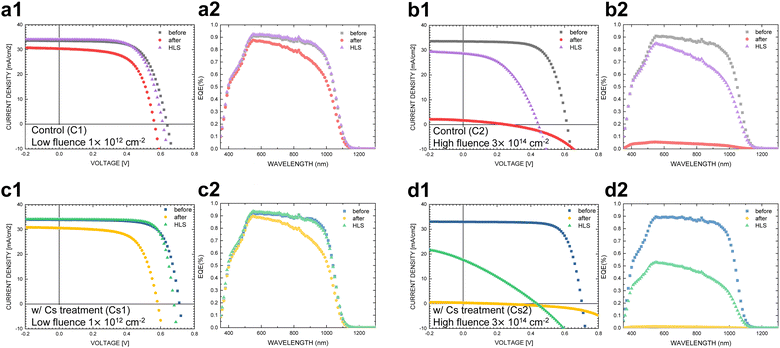
The J–V and EQE measurements were conducted to investigate the photovoltaic performance of CIGS solar cells under different conditions: before proton irradiation, after proton irradiation, and after HLS treatment. The results of these measurements are presented in Fig. 1 and summarized in Table 1. On average, the untreated control samples (C1 to C4) exhibit an efficiency of more than 13.5%, and the samples treated with cesium fluoride post-deposition treatment (CsF-PDT) (Cs1 and Cs2) demonstrate an average efficiency of over 17%.| Condition | V OC (V) | J SC (mA cm−2) | FF (%) | Efficiency (%) |
|---|---|---|---|---|
| Control 1 (C1) | 0.638 | 33.5 | 65.3 | 13.96 |
| C1 after LF (p-C1) | 0.564 | 30.4 | 62.3 | 10.68 |
| p-C1 after HLS (HLS-p-C1) | 0.613 | 34.1 | 65.1 | 13.60 |
| Control 2 (C2) | 0.614 | 33.5 | 66.8 | 13.74 |
| C2 after HF (p-C2) | 0.258 | 1.7 | 30.1 | 0.13 |
| p-C2 after HLS (HLS-p-C2) | 0.444 | 28.6 | 45.8 | 5.82 |
| Control 3 (C3) | 0.613 | 33.6 | 64.9 | 13.38 |
| C3 after HF (p-C3) | 0.350 | 6.7 | 35.9 | 0.84 |
| p-C3 after HS (HLS-p-C3) | 0.452 | 27.1 | 41.2 | 5.04 |
| Control 4 (C4) | 0.607 | 34.0 | 63.2 | 13.04 |
| C4 after HF (p-C4) | 0.277 | 2.4 | 30.4 | 0.20 |
| p-C4 after LS (LS-p-C4) | 0.309 | 9.0 | 31.6 | 0.89 |
| w/Cs-treatment (Cs1) | 0.711 | 33.9 | 72.1 | 17.37 |
| C1 after LF (p-Cs1) | 0.583 | 30.6 | 64.1 | 11.42 |
| p-Cs1 after HLS (HLS-p-Cs1) | 0.679 | 34.1 | 76.0 | 17.62 |
| w/Cs-treatment (Cs2) | 0.702 | 32.9 | 73.5 | 17.00 |
| Cs1 after HF (p-Cs2) | 0.180 | 0.3 | 27.1 | 0.02 |
| p-Cs2 after HLS (HLS-p-Cs2) | 0.436 | 17.6 | 28.8 | 2.21 |
The proton irradiation test conducted at 380 keV subjects CIGS solar cells to the harshest conditions, allowing the examination of the absorber's reliability in the presence of cosmic rays. This energy level is chosen because it can penetrate the entire CIGS solar device and stop within the absorber, as predicted by the SRIM simulation.28,29 Two different proton fluences were employed to test the damage degree on devices and used to evaluate the lifetime in space preliminarily. A proton fluence of 1 × 1012 cm−2 at 380 keV is estimated to be required to capture proton particles in the low Earth orbit (LEO) for over 300 years; similarly, it is estimated to be over 90![[thin space (1/6-em)]](https://www.rsc.org/images/entities/char_2009.gif) 000 years for a fluence of 3 × 1014 cm−2 based on the associated proton spectrum from the calculation.30,31 Since the solar cells on satellites operating in the LEO may be exposed to direct sunlight, the temperature could reach 120 to 160 °C. This setup of heat-light soaking (HLS), involving illumination of the samples under 1 sun AM 1.5 and annealing at 140 °C for a duration of 30 minutes, aims to simulate the conditions experienced by satellites operating in the LEO.
000 years for a fluence of 3 × 1014 cm−2 based on the associated proton spectrum from the calculation.30,31 Since the solar cells on satellites operating in the LEO may be exposed to direct sunlight, the temperature could reach 120 to 160 °C. This setup of heat-light soaking (HLS), involving illumination of the samples under 1 sun AM 1.5 and annealing at 140 °C for a duration of 30 minutes, aims to simulate the conditions experienced by satellites operating in the LEO.
After proton irradiation under a fluence of 1 × 1012 cm−2, the irradiated control sample (p-C1) exhibited noticeable reductions in Voc, Jsc, and FF (refer to Fig. 1a1). The power conversion efficiency of p-C1 decreased by approximately 20%. Analysis of the EQE curves in Fig. 1a2 revealed a decrease in short circuit current, particularly in the long wavelength region. Upon increasing the fluence to 3 × 1014 cm−2 during proton irradiation, p-C2 experienced a drastic reduction in efficiency, nearly reaching zero, as depicted in Fig. 1b1 and Table 1. The photon collection loss, as indicated by the EQE curve, also displayed a substantial decline, as illustrated in Fig. 1b2. However, in the case of HLS-p-C1, exposed to a lower fluence of 1 × 1012 cm−2 and subsequently subjected to heat-light soaking (HLS), a remarkable recovery of over 97% in efficiency was observed. In contrast, HLS-p-C2, irradiated at a high fluence of 3 × 1014 cm−2 and then subjected to HLS, displayed an efficiency that remained below 50%. It is noteworthy that the Voc still exhibited a significant recovery of over 70%.
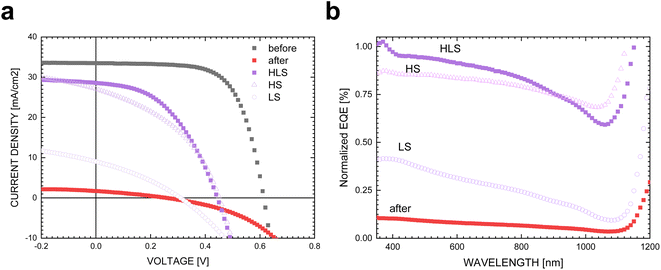
Since the HLS is effective in healing proton damage, we further conducted heat soaking (HS) and light soaking (LS) experiments separately on the highly irradiated control CIGS devices that had the same background conditions as HLS-p-C2, identified as HS-p-C3 and LS-p-C4. As depicted in Fig. 2a, the percentage of Voc recovery after heat soaking (HS) is comparable to that of the overall HLS treatment; in contrast, light soaking (LS) demonstrates a relatively moderate improvement in Voc. The normalized EQE (Fig. 2b), calculated using EQEHLS,HS,LS/EQEbefore irradiation, was utilized for characterizing and comparing the recovery wavelength region with that of HLS-p-C2. HS-p-C3 demonstrates a significant enhancement across the entire wavelength range, whereas LS-p-C4 primarily shows recovery at short wavelengths with a decline towards near-IR wavelengths. These results reflect that the overall regain of current in HLS is predominantly attributed to HS, whereas the distribution of recovery wavelengths aligns more closely with LS. The systematic experimentation reveals that HS and LS target distinct healing ranges. Although HS significantly contributes to the recovery of Voc and Jsc, LS appears to specifically address repairs in the front interfaces.
Instead, when investigating Cs-treated samples subjected to proton irradiation, a more significant decline in PV performance was observed. Compared to the control samples, both irradiated Cs-treated samples following low and high fluences (p-Cs1 and p-Cs2) displayed more notable deterioration in efficiency than the irradiated control samples, as shown in Fig. 1c1 and d1. Additionally, the recuperation behaviors of the irradiated Cs-treated CIGS devices following HLS (HLS-p-Cs1 and HLS-p-Cs2) differ between low proton fluence and high proton fluence conditions. HLS-p-Cs1, exposed to a lower fluence of 1 × 1012 cm−2, shows a high regain in Jsc and an efficiency recovery of over 100% (see Fig. 1c2 and Table 1). Conversely, HLS-p-Cs2, exposed to a higher fluence of 3 × 1014 cm−2, exhibits merely marginal recovery for Jsc and overall efficiency regain below 15% (Fig. 1d2 and Table 1).
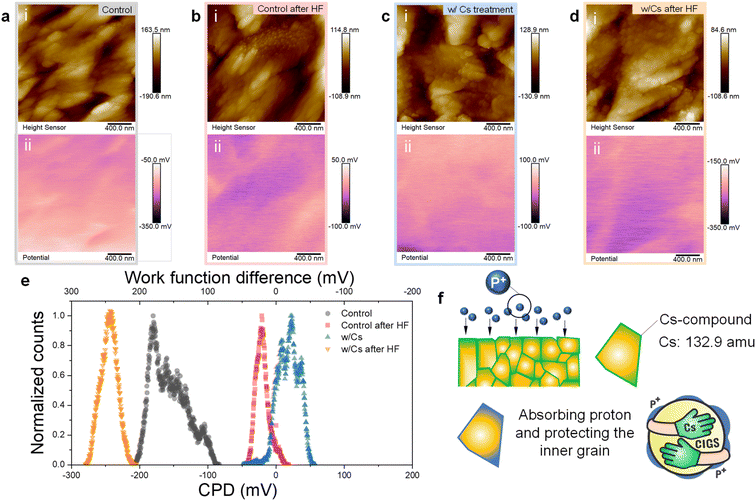
The distinct degradation observed in irradiated Cs-treated CIGS devices aligns with our previous reports.32 This may be related to the Cs-containing compound at grain boundaries (GBs) and the surface within CIGS after CsF-PDT. These compounds exhibit markedly different structural and chemical properties compared to pristine CIGS, which may potentially interact with protons and worsen the extent of proton damage. To investigate the GBs and surface properties of irradiated CIGS samples, we employed Kelvin probe force microscopy (KPFM) to analyze the contact potential difference (CPD) at the sample surface. Fig. 3 displays the surface potential profiles of both the control and Cs-treated samples before and after proton irradiation. As observed in Fig. 3a and b, after proton irradiation, the potential values of the control sample exhibited an increase compared to their initial levels. In contrast, the Cs-treated sample displayed relatively lower average values after irradiation, as depicted in Fig. 3c and d.
The surface potential can be utilized to determine the work function value, which is calculated according to CPD = (φtip − φsample)/e, where φtip and φsample represent the work functions of the tip and the sample, respectively; e is the elementary charge. In other words, a higher CPD value indicates a smaller work function of the sample when φtip is fixed. That is, the control sample after irradiation exhibits a lower work function, implying a decrease in carrier concentration. This result is consistent with previous reports,33 indicating that energetic irradiation can deplete free carriers and lead to a reduction in carrier concentration. In contrast, the Cs-treated sample exhibits contrasting behavior, showing an increased work function after irradiation, which indicates an increase in carrier concentration on the probing surface and GBs. The CPD distribution and the corresponding work-function changes before and after proton irradiation are summarized in the histogram in Fig. 3e. We suggest that the contrasting characteristics of the Cs-treated sample after irradiation come from the Cs-containing compound on the grain surface. They may play a role in absorbing protons (p+) in such a way that the work function of the Cs-treated sample surface increased due to the presence of the proton-absorbed layer. Cs halides, such as CsF and cesium iodide (CsI), are widely applied in radiation measurements and medical treatments.24–27 Their exceptional capacity to efficiently absorb and attenuate X-rays and gamma-rays, owing to high atomic numbers and density, makes them crucial for applications like radiation detectors, scintillators, and medical imaging devices. Our data indicate that the residual Cs-containing compound may absorb the ionizing radiation proton due to its high atomic number and atomic mass (132.9 amu), as illustrated in Fig. 3f. Additionally, these results also explain the heightened susceptibility of Cs-treated samples to degradation following energetic particle bombardment, emphasizing the crucial role that grain surfaces play in significantly influencing cell performance.
After the HLS, the performance of the Cs-treated sample under lower fluence (HLS-p-Cs1) was even higher than that in the initial state. This improvement can be attributed to the healing effect on the CIGS absorber as well as the potential enhancement in carrier concentration through alkali-ion migration during HLS,34–36 further aiding the recovery process on the moderately damaged grain boundaries and grain surface. However, in the case of high fluence irradiation applied to the Cs-treated sample (HLS-p-Cs2), the effectiveness of the repair process from HLS seems to be reduced, suggesting that high dosage proton irradiation might induce irreparable damage of the CIGS absorber and the Cs-containing compound.
3.2 Optical characterization: healing from HLS & protective shielding via Cs treatment
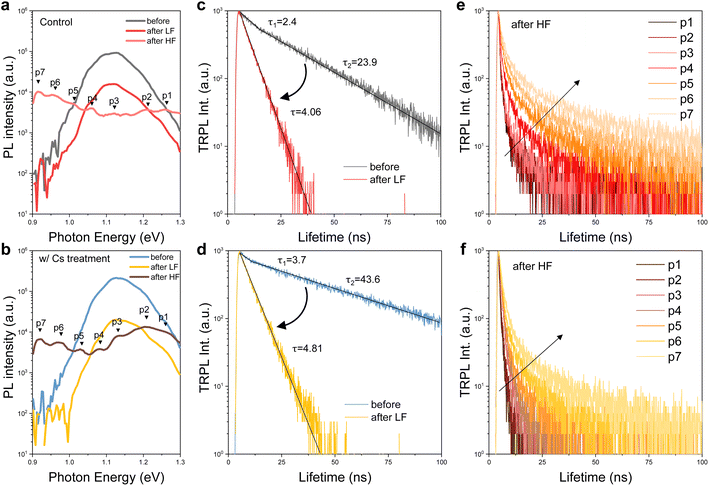
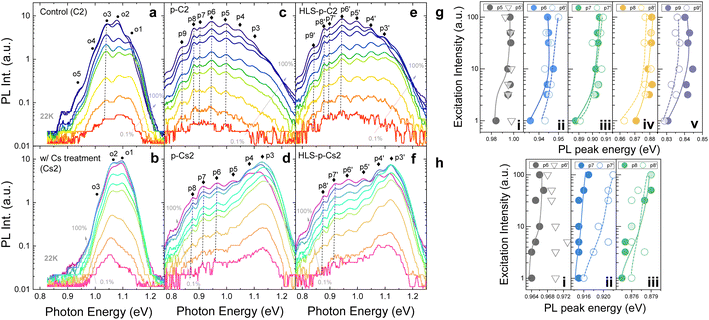
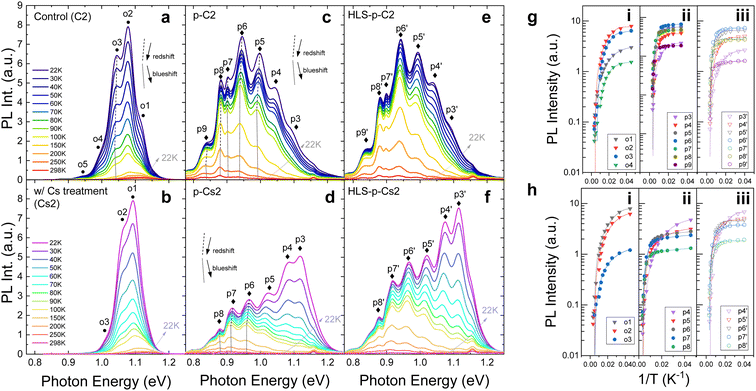
The PL spectrum is used to analyze the irradiation damage-induced recombination and power loss pathways.37 As illustrated in Fig. 4, the PL intensity (Fig. 4a and b) and TRPL lifetime (Fig. 4c and d) of control and Cs-treated samples declined following low-fluence irradiation, while the shape of the spectrum remained similar to that observed before irradiation. However, when subjected to high-fluence irradiation, both control and Cs-treated samples exhibit an overall intensity drop and several additional emission peaks, denoted as p4 to p7, in the low energy region. Upon analyzing the TRPL lifetime based on these additional peaks, we observe that the carrier lifetime increases with decreasing peak energies, as shown in Fig. 4e and f. Interestingly, a notable difference emerges: the Cs-treated sample sustains a relatively higher emission intensity in the near-band-edge transitions (p1, p2, and p3) compared to the control sample, underscoring a marked distinction.To analyze the contrast between the control and Cs-treated samples and to comprehend the properties of these extra peaks following high-fluence irradiation, we leveraged power-dependent PL at 22 K and temperature-dependent PL from 22 K to 298 K. Fig. 5a and b show the power-dependence PL of control and Cs-treated samples, respectively, prior to irradiation. The insights into the underlying characteristics before irradiation were further gleaned from temperature PL, as depicted in Fig. 6a and b. Before irradiation, the spectrum of the Cs-treated sample displays comparatively simpler transitions and reduced band tailing when contrasted with that of the control sample. Additionally, we noted that one of the transition peaks in the control sample undergoes a blueshift in position under varying excitation powers, identified as o3 (indicated by the dashed line in Fig. 5a). In contrast, the Cs-treated sample presents no change in the peak energy shift. Following irradiation, the emission intensities of the control and Cs-treated samples in the low-energy region are augmented with increased excitation power as shown in Fig. 5c and d. Moreover, we observed non-linear blueshifts in the photon energy of several additional peaks within the low-energy region as the excitation power was escalated. These peaks were identified as p5, p6, p7, p8, and p9 in the control sample, and p6, p7, and p8 in the Cs-treated sample, respectively (see dashed lines in Fig. 5c and d and summary in Fig. 5g and f). The details of the deconvolution result can be found in Fig. S1.†
Elaborate transitions become discernible at low temperatures due to the restricted energy within band transitions. By varying the excitation power and measuring the resulting photoluminescence emission position, we can differentiate between transition types, such as trap states or donor–acceptor pairs (DAPs). Of special note is that the occurrence of a non-linear blueshift with intensified excitation intensity at low temperatures may suggest the initiation of a DAP transition.38 In the case of the DAP transition, the energy of the emitted photons relies on the Coulomb interaction between the confined carriers, and the luminescence of the DAP is increasingly governed by close pairs as the excitation intensity increases. Accordingly, when the excitation power is heightened, the recombination luminescence of the DAP undergoes a blueshift to a higher photon energy.
On the other hand, we also observe that the peak shifts identified as those of DAPs of irradiated CIGS samples from temperature-dependent PL exhibit a redshift, followed by a subsequent blueshift (refer to the dotted and dashed lines in Fig. 6c and d) when the temperature is varied from 22 K to 298 K. The plot of peak energy versus temperature can be found in Fig. S2.† This result indicates the possible occurrence of potential fluctuations associated with DAP transitions following proton irradiation in control and Cs-treated CIGS samples. During instances of potential fluctuations, carriers might become trapped within non-nadir potential wells, leading to incomplete filling due to the absence of complete thermalization at low temperatures. As the temperature gradually increases, carriers could settle into the lowest potential well, resulting in a redshift in emission. Subsequently, as temperature increases further, carriers might transition from their potential valleys and instead occupy higher energy bands, manifesting as a blueshift. This intriguing phenomenon also exhibits traits reminiscent of compensated semiconductors,39 characterized by the accumulation of substantial concentrations of donors and acceptors due to the pronounced dosage of proton irradiation.
After HLS, the spectra of the control and Cs-treated samples (HLS-p-C2 and HLS-p-Cs2) maintain similar characteristics to those observed after irradiation, as illustrated in Fig. 5e and f. However, one of the transitions with a blueshift was eliminated after HLS (see p5′ of HLS-p-C2 and p6′ of HLS-p-Cs2 in Fig. 5e and f, respectively). The changes in PL peak energies after HLS are plotted in Fig. 5g and h. Additionally, we observed that the overall intensity experiences augmentation across various temperature ranges, as depicted in Fig. 6e and f. Notably, it is important to highlight that the emission intensity at the near-band edges of the Cs-treated sample at low temperatures improves further, indicating a better radiative emission recovery within this Cs-incorporated system.
By further calculating the dependence of PL intensity (IPL) on temperature, we can obtain the characteristic activation energy (Ea) of the acceptor or donor traps. For single activation energy, for example, the free-to-bound (FB) transitions, the dependence on temperature can be described by using:
IPL(T) ∝ 1/(1 + C![[thin space (1/6-em)]](https://www.rsc.org/images/entities/char_2009.gif) exp(−Ea/kT)), exp(−Ea/kT)), | (1) |
IPL(T) = 1/(1 + C1![[thin space (1/6-em)]](https://www.rsc.org/images/entities/char_2009.gif) exp(−Ea1/kT) + C2 exp(−Ea1/kT) + C2![[thin space (1/6-em)]](https://www.rsc.org/images/entities/char_2009.gif) exp(−Ea2/kT)), exp(−Ea2/kT)), | (2) |
The fitting results are plotted in Fig. 6g and h, and the calculated values are listed in Table 2. The inverted triangle scatter indicates free-to-bound or bound-to-free transition, each deriving a single activation value from eqn (1). Meanwhile, the circle scatter symbolizes the DAPs obtaining two fitted activation energies through the utilization of eqn (2).
| Condition | Activation energy (meV) | ||||||
|---|---|---|---|---|---|---|---|
| o1 | o2 | o3 (DAP) | o4 | o5 | |||
| C2 | 9 ± 0 | 26 ± 1 | 32 ± 9/12 ± 7 | 10 ± 0 | 4 ± 0 | ||
| p3 | p4 | p5 (DAP) | p6 (DAP) | p7 (DAP) | p8 | p9 | |
| p-C2 | 14 ± 1 | 32 ± 2 | 56 ± 6/26 ± 5 | 64 ± 3/32 ± 4 | 66 ± 3/47 ± 17 | 82 ± 4/36 ± 2 | 83 ± 11/17 ± 2 |
| p3′ | p4′ | p5′ | p6′ (DAP) | p7′ (DAP) | p8′ | p9′ | |
| HLS-p-C2 | 13 ± 0 | 28 ± 1 | 50 ± 3 | 71 ± 6/36 ± 16 | 81 ± 5/45 ± 16 | 88 ± 2/50 ± 18 | 89 ± 5/10 ± 2 |
| o1 | o2 | o3 | |||||
| Cs2 | 21 ± 0 | 17 ± 1 | 5 ± 0 | ||||
| p3 | p4 | P5 | p6 (DAP) | p7 (DAP) | p8 (DAP) | ||
| p-Cs2 | 11 ± 0 | 12 ± 0 | 14 ± 0 | 30 ± 3/8 ± 2 | 37 ± 2/8 ± 1 | 41 ± 6/4 ± 1 | |
| p3′ | p4′ | p5′ | p6′ | p7’ (DAP) | p8’ (DAP) | ||
| HLS-p-Cs2 | 21 ± 1 | 22 ± 0 | 26 ± 1 | 34 ± 1 | 42 ± 1/29 ± 6 | 44 ± 3/13 ± 2 | |
While temperature dependence PL may not distinguish between donor and acceptor states, it can be deduced that within a donor–acceptor pair, the higher of the two obtained activation energies corresponds to the acceptor state. This inference is guided by the hydrogen model applicable to shallow defects.40 Hence, within a DAP, the smaller value signifies the activation energy of the donor state. Interestingly, we observed a sequential rise in the activation energy values of donor states across neighboring DAPs, as shown in Table 2. Therefore, we propose that these donor states might collectively constitute a sequential descending stair. The stair may prolong the lifetime of charge-separated states through electron hopping during radiative emission. This also explains the extended carrier lifetimes with decreasing peak energies, as observed in Fig. 4e and f.
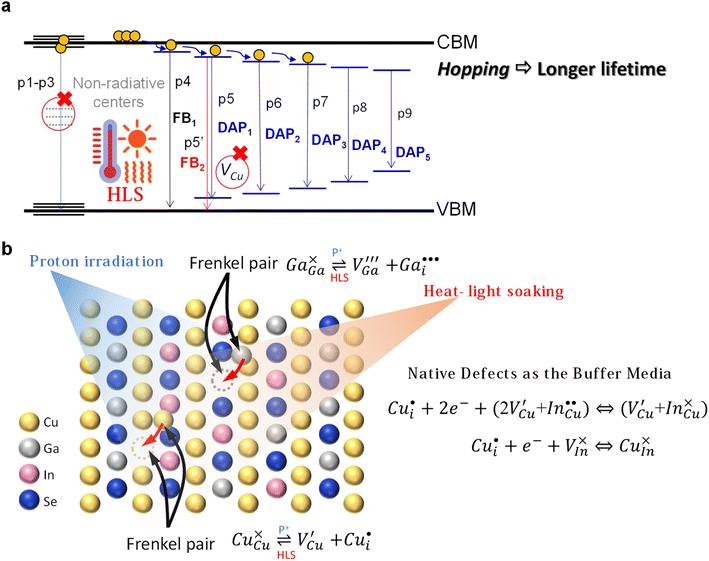
Our collected data suggest that in both control and Cs-treated samples, numerous donors and/or acceptor traps form after proton irradiation, thereby giving rise to multiple DAPs. The prolonged lifetime reflects the sequential donor states across neighboring DAPs. Also, the reduction in photoluminescence intensity at the near-band-edge can be attributed to an increased concentration of proton-induced non-radiative centers. Based on these findings, an illustrative schematic depicting non-radiative centers, DAPs, and the subsequent electron hopping process within the irradiated-CIGS band structure is presented, as illustrated in Fig. 7a.
After HLS, a suppression of DAP transitions and increased intensity at the near-band-edge are observed in both control and Cs-treated samples. This may signify a reduction in the presence of non-radiative centers41 and the revival of select reversible donor or acceptor traps by the healing from heat-light soaking. Furthermore, our observations indicate that implementing Cs-treatment on the CIGS absorber effectively decreases the formation of DAPs, either initially inhibition or during irradiation. The Cs-treated sample also demonstrates superior performance in maintaining a higher emission intensity at the near-band edge. These results highlight the enhanced integrity of radiative transitions originating from CIGS grains within the Cs-treated sample. This may be attributed to the Cs-containing compound at the grain surface, absorbing the protons and protecting the inner grains, as illustrated in Fig. 3f.
3.3 Robust CIGS solar cells: flexibility in defect healing
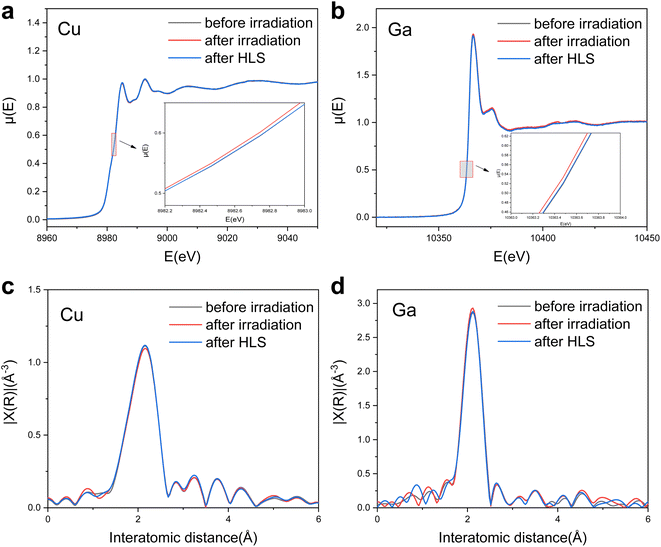
For the evaluation of photovoltaic performance, the CIGS samples demonstrate a discernible capacity for sensing environmental changes and responding to them by applying appropriate heat and light treatments. In the context of PL analysis, even when the CIGS samples have been subjected to high levels of irradiation, the process of heat-light soaking manifestly engenders a notable resurgence in their optical properties. This observation highlights the importance of seeking out defect healing mechanisms rather than merely stability against radiation.X-ray absorption near-edge spectroscopy (XANES) spectra and extended X-ray absorption fine structure (EXAFS) spectra were acquired for the analysis of the oxidation state and atomic coordination of control samples both before and after irradiation, as well as following HLS, as depicted in Fig. 8. The Cu K-edge XANES spectra before and after proton irradiation show similar spectral shapes (Fig. 8a) and interatomic distance (Fig. 8b), whereas an energy shift of the Cu K-edge (a reduction of the Cu oxidation state) was observed. Remarkably, following HLS, the energy shift was restored to its initial (no radiation) level, suggesting a nearly identical Cu oxidation state both before irradiation and after HLS. This consistent trend was also observed in the Ga K-edge XANES spectra (Fig. 8c) and EXAFS spectra (Fig. 8d), which exhibited an observable energy shift towards lower energy after irradiation, subsequently recovering to a state resembling that before irradiation during HLS.
The interatomic distance serves as an indicator of the coordination environment and valence state of Cu and Ga species within the CIGS absorber. Notably, these distance values show minimal variation, remaining relatively constant even after irradiation and heat-light soaking. In particular, the EXAFS spectra unveil interatomic distances of 2.15 Å for the Cu K-edge and 2.12 Å for the Ga K-edge (without phase correction), respectively. Upon closer examination of the CIGS structure at an atomic scale, these values more likely suggest the presence of Cu–Se and Ga–Se, respectively.42 The XANES and EXAFS spectra for Se also demonstrate no changes in K-edge and interatomic distance before and after irradiation (Fig. S3†). Our findings affirm that no varied bond lengths were formed even under rigorous proton irradiation, revealing the structural stability of the CIGS material.
However, the observed energy shift of the K-edge for Cu and Ga, indicates a reduction in the oxidation state, potentially implying the generation of a Frenkel defect pair. This entails Cu or Ga atoms vacating their initial lattice positions to create vacancies while simultaneously occupying interstitial positions within the solid crystal during irradiation, as denoted by using eqn (3) and (4):
 | (3) |
 | (4) |
 and
and  may migrate to vacancies and return to a neutral state, as illustrated in the following eqn (5) and (6).
 | (5) |
 | (6) |
Cu and Ga atoms are recognized for having the two lowest displacement energies,43 leading to the highest defect introduction rate due to energetic particle bombardment.44 Our findings reveal that CIGS exhibits flexibility in defect healing during HLS, suggesting the potential reversibility of irradiation-induced defects. HLS furnishes ample energy to facilitate the migration of mobile interstitials back to their respective or neighboring vacancy sites. This result also implies the existence of an inherent self-adjustment system to mitigate damage prior to external healing intervention, preventing the possibility of permanent damage to the solar cells. In fact, J.-F. Guillemoles and colleagues suggested that CIGS can be considered a “smart material”.45 When a local defect disrupts a dynamic equilibrium, the internal system adjusts to counteract the disturbance and restore equilibrium, following principles akin to Le Chatelier's principle. The abundant native defect complex  and point defect
  within CIGS may serve as a buffer to balance the mobile interstitial Cu and neutralize electrically active defects. Our results show that not only Cu but Ga also acquires a similar reversible defect mechanism, implying that chalcopyrite CIGS obtains superior capability to accommodate the irradiation-induced defects even though it is a non-Cu-related defect. Therefore, the suppression of a DAP (from a DAP to FB) and the reduction of non-radiative centers in PL after HLS may signify the healing of irradiation defects. The mechanism is illustrated in Fig. 7b. However, in the PL spectra and PV performance, we still observe some irreversible irradiation-induced transitions and non-fully recovered efficiency, even after undergoing HLS (see HLS-p-C2 and HLS-p-Cs2). This observation prompts us to consider that the buffer defects could reach saturation when exposed to an excessive proton dosage irradiation (refers to a higher fluence of 3 × 1014 cm−2).
The proposed effect of flexibility on defect healing reflects the robustness of CIGS solar cells for the harsh space environment. Utilizing HLS treatment for CIGS is analogous to tapping into solar energy while orbiting in space aboard a satellite. These solar cells withstand cosmic ray damage while simultaneously benefiting from the sun's restorative power, allowing for self-healing. The nature of chalcopyrite CIGS, with a large defect concentration as a compound semiconductor, accommodates more possibilities to enhance its radiation hardness. Given the potential of thin-film tandem technologies, exemplified by perovskite-on-CIGS tandem solar cells, which boast power-to-weight ratios surpassing those of state-of-the-art III–V semiconductor-based multi-junctions, the robustness against radiation becomes increasingly crucial for long-term space application. When compared to silicon-based solar cells, CIGS demonstrates impressive resilience and adaptability in challenging environments as a bottom cell in thin-film tandem solar cells.46 Additionally, its response to heat during recovery highlights its ability to capture longer-wavelength light when serving as the bottom cell in tandem structures for space-based endeavors. Our work investigates the effects of irradiation on not only the CIGS absorber layer but also the solar cell levels before and after could better align the goals to meet space application requirements. Notably, this study also represents an instance in which proton testing was conducted on CIGS solar cells that have a PCE exceeding 17%, which is emblematic of the potential for future high-efficiency space solar cells. As we continue to explore the cosmos, CIGS solar cells stand as a testament to our ingenuity in harnessing the abundant energy of the sun, even amidst harsh cosmic challenges.
4. Conclusions
In summary, our research offers a comprehensive characterization of proton-induced damage and subsequent healing processes. PV performance shows that the behaviors of control and Cs-treated CIGS after irradiation and following HLS are identical. Interestingly, when irradiated samples exposed to a fluence of 1 × 1012 cm−2 at 380 keV undergo HLS, they all exhibit nearly complete recovery, while Cs-treated CIGS solar cells always experience relatively significant degradation during irradiation. KPFM shows that the remaining Cs-compound on Cs-treated CIGS may absorb protons and then change the surface contact potential after irradiation. Furthermore, the PL spectra indicate higher radiative emissions in Cs-treated CIGS, suggesting that the Cs-compound may act as a shielding material, protecting the inner CIGS from radiation-induced damage. XAS measurements confirm the structural integrity of CIGS even after exposure to high irradiation fluences, with the energy shift observed at the K-edge providing evidence of Frenkel defect pair formation. Following HLS, the K-edge shifts back to its initial state, indicating a reversible defect healing mechanism. The presence of a high defect concentration in CIGS proves to be pivotal in accommodating such severe irradiation-induced defects, highlighting its resilience and adaptability in harsh environments.Author contributions
Tzu-Ying Lin, Ph.D. (conceptualization: lead; data curation: lead; formal analysis: lead; funding acquisition: lead; investigation: lead; methodology: lead; project administration: lead; resources: lead; software: lead; supervision: lead; validation: lead; visualization: lead; writing – original draft: lead; writing – review & editing: lead); Chi-Feng Hsieh, M. S. (data curation: supporting; formal analysis: equal; investigation: equal; methodology: equal); Ayaka Kanai, Ph.D. (formal analysis: equal; methodology: equal; validation: supporting); Takahiko Yashiro, M. S. (data curation: supporting; investigation: equal; methodology: supporting); Wen-Jing Zeng (methodology: supporting); Jian-Jie Ma (methodology: supporting); Sung-Fu Hung, Ph.D. (resources: lead; software: equal; supervision: supporting); Mutsumi Sugiyama, Ph.D. (project administration: equal; resources: equal; supervision: equal).Conflicts of interest
There are no conflicts to declare.Acknowledgements
This work received funding from the Young Scholar Fellowship Einstein Program of the National Science and Technology Council (NSTC), Taiwan (Grant No. NSTC 109-2636-E-007-024-, 110-2636-E-007-015-, 111-2636-E-007-026-, and 112-2636-E-007-006-). Proton irradiation was carried out using the QST (Takasaki) TIARA facility supported by the Inter-University Program for the Joint-use of JAEA/QST Facilities, Nuclear Professional School, School of Engineering, University of Tokyo (proposal no. 20015). The support from the National Science and Technology Council, Taiwan (Contract No. NSTC 112-2628-M-A49-001) is gratefully acknowledged. SFH is also thankful for the support from the Yushan Young Scholar Program and the Center for Emergent Functional Matter Science, Ministry of Education, Taiwan.Notes and references
-
M. Edoff, Presented at the State of the Art and Future Prospects of Thin Film CIGS Solar Cells, Université du Luxembourg, 2023, available: https://wwwde.uni.lu/forschung/fstm/dphyms/news_events/ph Search PubMed
.
-
Best Research- Cell, Efficiency Chart|Photovoltaic Research|, accessed 12.12.22., https://www.nrel.gov/pv/cell-efficiency.html Search PubMed
.
- M. Jošt, E. Köhnen, A. Al-Ashouri, T. Bertram, S. Tomšič, A. Magomedov, E. Kasparavicius, T. Kodalle, B. Lipovšek and V. Getautis, ACS Energy Lett., 2022, 7, 1298–1307 CrossRef
.
-
https://www.nrel.gov/pv/cell-efficiency.html
.
- K. Yoshikawa, H. Kawasaki, W. Yoshida, T. Irie, K. Konishi, K. Nakano, T. Uto, D. Adachi, M. Kanematsu and H. Uzu, Nat. Energy, 2017, 2, 1–8 CrossRef
.
- M. Green, E. Dunlop, J. Hohl-Ebinger, M. Yoshita, N. Kopidakis and X. Hao, Prog. Photovoltaics, 2021, 29, 3–15 Search PubMed
.
- P. Jackson, R. Wuerz, D. Hariskos, E. Lotter, W. Witte and M. Powalla, Phys. Status Solidi RRL, 2016, 10, 583–586 CrossRef CAS
.
- T. Kato, J.-L. Wu, Y. Hirai, H. Sugimoto and V. Bermudez, IEEE J. Photovolt., 2019, 9, 325–330 Search PubMed
.
- M. Nakamura, K. Yamaguchi, Y. Kimoto, Y. Yasaki, T. Kato and H. Sugimoto, IEEE J. Photovolt., 2019, 9, 1863–1867 Search PubMed
.
- T.-Y. Lin, I. Khatri, J. Matsuura, K. Shudo, W.-C. Huang, M. Sugiyama, C.-H. Lai and T. Nakada, Nano Energy, 2020, 68, 104299 CrossRef CAS
.
- P. Schöppe, S. Schönherr, R. Wuerz, W. Wisniewski, G. Martínez-Criado, M. Ritzer, K. Ritter, C. Ronning and C. S. Schnohr, Nano Energy, 2017, 42, 307–313 CrossRef
.
- R. Wuerz, W. Hempel and P. Jackson, J. Appl. Phys., 2018, 124, 165305 CrossRef
.
- J. Notte, D. Runt, F. Khanom, B. Lewis, S. Sijbrandij, C. Guillermier and D. Dowsett, Microsc. Microanal., 2019, 25, 526–527 CrossRef
.
- M. Raghuwanshi, A. Vilalta-Clemente, C. Castro, S. Duguay, E. Cadel, P. Jackson, D. Hariskos, W. Witte and P. Pareige, Nano Energy, 2019, 60, 103–110 CrossRef CAS
.
- M. Malitckaya, H.-P. H.-P. Komsa, V. Havu and M. J. Puska, J. Phys. Chem. C, 2017, 121, 15516–15528 CrossRef CAS
.
- A. Jasenek, U. Rau, K. Weinert, I. M. Kötschau, G. Hanna, G. Voorwinden, M. Powalla, H. W. Schock and J. H. Werner, Thin Solid Films, 2001, 387, 228–230 CrossRef CAS
.
- M. Sugiyama, T. Yasuniwa, H. Nakanishi, S. F. Chichibu and S. Kimura, Jpn. J. Appl. Phys., 2010, 49(4R), 042302, DOI:10.1143/JJAP.49.042302
.
- S. Kawakita, M. Imaizumi, M. Yamaguchi, K. Kushiya, T. Ohshima, H. Itoh and S. Matsuda, Jpn. J. Appl. Phys., 2002, 41, 1–4 CrossRef
.
- I. Khatri, T. Lin, T. Nakada and M. Sugiyama, Phys. Status Solidi RRL, 2019, 1900519, 1–6 Search PubMed
.
-
T. Sumita, M. Imaizumi, S. Kawakita, S. Matsuda, S. Kuwajima, T. Ohshima and T. Kamiya, in 2003 IEEE Radiation Effects Data Workshop, IEEE, 2003, pp. 11–16 Search PubMed
.
- M. Imaizumi, T. Sumita, K. Kushiya, T. Ohshima, M. Yamaguchi and S. Matsuda, Photovoltaic Energy Conversion, Proceedings of 3rd World Conference, 2003, 1, 693–696 Search PubMed
.
- S. Kawakita, M. Imaizumi, T. Sumita, K. Kushiya, T. Ohshima, M. Yamaguchi, S. Matsuda, S. Yoda and T. Kamiya, 3rd World Conference onPhotovoltaic Energy Conversion, Proc. IEEE, 2003, 1, 693–696 Search PubMed
.
- M. Imaizumi, T. Sumita, S. Kawakita, K. Aoyama, O. Anzawa, T. Aburaya, T. Hisamatsu and S. Matsuda, Prog. Photovoltaics, 2005, 13, 93–102 CAS
.
- W. Van Sciver and R. Hofstadter, Phys. Rev., 1952, 87, 522 CrossRef CAS
.
- M. M. Ter-Pogossian, D. C. Ficke, J. T. Hood Sr, M. Yamamoto and N. A. Mullani, J Comput Assist Tomogr, 1982, 6, 125–133 CrossRef CAS PubMed
.
- W. Zhao, G. Ristic and J. A. Rowlands, Med. Phys., 2004, 31, 2594–2605 CrossRef CAS PubMed
.
-
C. E. Crouthamel, F. Adams and R. Dams, Applied Gamma-Ray Spectrometry, Elsevier, 2013, vol. 41 Search PubMed
.
- Y. Hirose, M. Warasawa, I. Tsunoda, K. Takakura and M. Sugiyama, Jpn. J. Appl. Phys., 2012, 51(11R), 111802, DOI:10.1143/JJAP.51.111802
.
- T.-Y. Lin, T. Yashiro, I. Khatri and M. Sugiyama, Jpn. J. Appl. Phys., 2020, 59(5), 058003, DOI:10.35848/1347-4065/ab891f
.
- J. V Logan, M. P. Short, P. T. Webster, C. P. Morath and E. H. Steenbergen, J. Mater. Chem. C, 2019, 7, 8905–8914 RSC
.
-
H. Matsumoto, in Japan Aerospace Exploration Agency 3rd Space Studies Seminar in Kyoto University, 2015 Search PubMed
.
- I. Khatri, T.-Y. Lin, T. Nakada and M. Sugiyama, Phys. Status Solidi RRL, 2019, 13, 1900519 CrossRef CAS
.
- A. Jasenek and U. Rau, J. Appl. Phys., 2001, 90, 650–658 CrossRef CAS
.
- J. Matsuura, I. Khatri, T. Lin, M. Sugiyama and T. Nakada, Prog. Photovoltaics, 2019, 27, 623–629 CAS
.
- I. Khatri, T. Lin, T. Yashiro and M. Sugiyama, Prog. Photovoltaics, 2020, 28, 1158–1166 CAS
.
- M. Jahandardoost, M. Nardone, T. M. Friedlmeier, C. Walkons and S. Bansal, J. Mater. Res., 2022, 37, 436–444 CrossRef CAS
.
- Y. Ando, S. Ishizuka, S. Wang, J. Chen, M. M. Islam, H. Shibata, K. Akimoto and T. Sakurai, Jpn. J. Appl. Phys., 2018, 57, 08RC08 CrossRef
.
- E. Zacks and A. Halperin, Phys. Rev. B, 1972, 6, 3072 CrossRef CAS
.
- T. Unold and L. Gütay, Advanced Characterization Techniques for Thin Film Solar Cells, 2016, 1, 275–297 Search PubMed
.
-
P. Yu, Fundamentals of Semiconductors, Springer, 2005 Search PubMed
.
- H. Tangara, Y. He, M. M. Islam, S. Ishizuka and T. Sakurai, Jpn. J. Appl. Phys., 2022, 61, SC1050 CrossRef
.
- C. S. Schnohr, H. Kämmer, C. Stephan, S. Schorr, T. Steinbach and J. Rensberg, Phys. Rev. B, 2012, 85, 245204 CrossRef
.
-
A. Jasenek, Eigenschaften von Defekten in Cu (In, Ga) Se2 nach Elektronen-und Protonenbestrahlung, Shaker, 2002 Search PubMed
.
- S. Kawakita, M. Imaizumi, S. Ishizuka, S. Niki, S. Okuda and H. Kusawake, Thin Solid Films, 2013, 535, 353–356 CrossRef CAS
.
- J. Guillemoles, U. Rau, L. Kronik, H. Schock and D. Cahen, Adv. Mater., 1999, 11, 957–961 CrossRef CAS
.
- F. Lang, M. Jošt, K. Frohna, E. Köhnen, A. Al-Ashouri, A. R. Bowman, T. Bertram, A. B. Morales-Vilches, D. Koushik and E. M. Tennyson, Joule, 2020, 4, 1054–1069 CrossRef CAS PubMed
.
Footnote |
| † Electronic supplementary information (ESI) available. See DOI: https://doi.org/10.1039/d3ta06998b |
| This journal is © The Royal Society of Chemistry 2024 |

