 Open Access Article
A robust Ni single-atom catalyst for industrial current and exceptional selectivity in electrochemical CO2 reduction to CO†
Zhicheng
Liu
ab,
Longsheng
Cao
*a,
Manli
Wang
ab,
Yun
Zhao
 a,
Ming
Hou
 *a and
Zhigang
Shao
 *a
*a
aFuel Cell System and Engineering Laboratory, Key Laboratory of Fuel Cell & Hybrid Power Sources, Dalian Institute of Chemical Physics, Chinese Academy of Sciences, Dalian, Liaoning 116023, China. E-mail: houming@dicp.ac.cn; caolsh@dicp.ac.cn; zhgshao@dicp.ac.cn
bUniversity of Chinese Academy of Sciences, Beijing, 100049, China
First published on 21st February 2024
Abstract
While achieving a faradaic efficiency (FE) over 90% in the electroreduction of CO2 to CO with a single transition metal atom anchoring nitrogen-doped carbon (M–N–C) catalyst is indeed notable, the challenge remains in elevating the CO current density to a level suitable for industrial application. Here, we present the synthesis of a hydrophobic Ni single-atom catalyst (Ni–N-HCNs-5h) featuring unsaturated Ni–N coordination and abundant micropores, created by immobilizing nickel atoms on hollow carbon nanospheres. In virtue of the increased accumulation of CO2, inhibited hydrogen evolution reaction (HER), and optimized adsorption strength of intermediates, the Ni–N-HCNs-5h achieves an exceptional CO current density of 577 mA cm−2 with 96% CO FE at a potential of −1.17 V vs. RHE. Impressively, CO FE over 95% is sustained across a wide range of total current densities, spanning from 100 to 600 mA cm−2. Density functional theory calculations provide insights into reducing the free energy for generating the *COOH intermediate and the suppression of the HER on unsaturated NiN3V sites (where V denotes a coordination vacancy) compared to the NiN4 site. Our work sheds new light on developing M–N–C catalysts with high product selectivity and current densities suitable for industrial-scale CO2 electroreduction to CO.
Introduction
Anthropogenic activities and the excessive utilization of fossil fuels have led to a substantial surge in atmospheric CO2 concentrations, resulting in serious environmental and climate challenges, including global warming, ocean acidification, and rising sea levels.1 Electrochemical reduction of CO2 (ECR) to fuels and value-added chemicals powered by renewable electricity is emerging as a promising approach to mitigate environmental and energy dilemmas. This is due to its uncomplicated experimental setup, mild reaction conditions, and significant potential for industrial application.2–4 ECR represents a multi-proton-coupled electron reaction, offering a spectrum of reduction products attainable through various reaction pathways that depend on electrocatalysts and specific experimental conditions. These products include carbon monoxide (CO),5,6 formate,7 methanol,8 ethanol,9 and so on. Among these, CO stands out as an economically lucrative product, owing to its notable advantages: (1) minimal overpotential for reduction and relatively high faradaic efficiency (FE); (2) the ECR to CO is a two-electron reaction process, which is more kinetically favorable than that to multi-electron products like methanol and ethanol; (3) CO can be easily separated from the electrolyte; (4) CO can be blended with hydrogen to create syngas, which can be subsequently converted into liquid hydrocarbons, such as gasoline and diesel, through Fischer–Tropsch synthesis.10,11 Numerous electrocatalysts have been explored for ECR to CO, including noble metal catalysts,12–14 molecular catalysts,15–17 and even metal-free catalysts.18–20 However, the above electrocatalysts suffer from serious issues, including low stability, restricted performance, and intricate preparation procedures.21,22 Therefore, the development of easily prepared, cost-effective catalysts characterized by robust durability and exceptional catalytic activity is of paramount importance.Transition metal single atom anchoring nitrogen-doped carbon (M–N–C) materials represent a novel class of electrocatalysts for ECR to CO due to their nearly 100% atom-utilization efficiency and distinctive electronic structure.23,24 This approach was pioneered by Strasser and coworkers, who employed Fe–N–C catalysts to achieve efficient conversion of CO2 to CO.25 To date, while many M–N–C catalysts have achieved an impressive FE of CO (exceeding 90%), their reaction current densities often fall below 100 mA cm−2, significantly lower than the threshold of greater than 300 mA cm−2 necessary for economically viable ECR.26,27 The primary reason for this limitation is the constrained concentration of reactants at the electrode interface. To address this challenge, various strategies have been employed to improve the catalytic activity significantly. These strategies include amino modification,28 electronic structure regulation,29,30 and reactor optimization.31–33 Furthermore, studies have highlighted that coordinatively unsaturated M–N sites can boost the intrinsic activity of catalysts by fine-tuning the binding strength of crucial intermediates, leading to increased reaction current densities in ECR to CO.34,35
Studies on CO2 capture have demonstrated that porous carbon materials with ultra-large specific surface areas and abundant micropores exhibit substantial CO2 adsorption capacity. This is attributed to the kinetic diameter of CO2 molecules, which is mere 0.33 nm, with micropores being particularly conducive to CO2 adsorption.36,37 Given that the M–N–C catalyst shares similarities with the carbon material, it can be inferred that increasing the specific surface area and micropore content of the M–N–C catalysts can enhance their CO2 adsorption capacity, thereby bolstering the catalytic activity of the ECR.
Traditional M–N–C catalysts are typically prepared through the pyrolysis of a mixture containing metal salts, nitrogen precursors, and carbon sources at elevated temperatures in an inert gas atmosphere. Subsequent laborious steps involve strong acid etching and additional heat treatments.38–40 This method results in heterogeneity in catalyst morphology and structure, along with limited control over the coordination environment of active sites. Therefore, there is an urgent need for the facile and controlled synthesis of M–N–C catalysts with well-defined active sites and microenvironments.
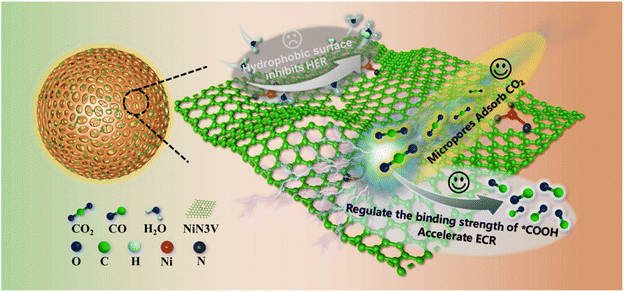
In this study, we present a microenvironment engineering design strategy aimed at achieving a high current and exceptional selectivity in the electrochemical reduction of CO2 to CO by the integration of measures to enhance CO2 accumulation, suppress the hydrogen evolution reaction (HER), and optimize the adsorption strength of intermediates on the catalyst surface (Fig. 1). First, abundant micropores enhance the catalyst's adsorption capacity for CO2 and intermediates, greatly augmenting catalytic activity. Second, the existence of unsaturated NiN3V sites can modulate the binding strength of the crucial intermediate *COOH in comparison to the NiN4 site, thus promoting CO production. Furthermore, rendering the catalyst surface highly hydrophobic proves advantageous for suppressing water transport, thereby expediting the ECR while inhibiting the hydrogen evolution reaction (HER). Lastly, the design of an isolated catalytic active site effectively suppresses the HER, as it often requires at least two adjacent catalytic active sites for hydrogen generation.41 Therefore, we propose a strategy for the controlled synthesis of a hydrophobic Ni single-atom catalyst with unsaturated NiN coordination and a substantial number of micropores. We employ hollow carbon nanospheres (HCNs) characterized by an ultra-high specific surface area as carbon supports. The resulting Ni–N-HCNs-5h catalyst exhibits an industrial-level CO current density exceeding 570 mA cm−2 and an impressive CO faradaic efficiency exceeding 95% in a flow cell containing 1.0 M KOH.
Results and discussion
The detailed synthesis process of Ni–N-HCNs-5h is depicted in Fig. S1.† Firstly, the HCNs with an average diameter of 90–100 nm (Fig. S3 and S6a†) were fabricated by directly carbonizing polyaniline-co-polypyrrole at 800 °C under an Ar atmosphere. Since the specific surface area (SSA) of HCNs is only 177.2 m2 g−1, CO2 activation was used to enhance the SSA. The morphology and size of HCNs remained virtually unchanged after CO2 activation (Fig. S3–S5†), suggesting the excellent structural stability of HCNs. Nitrogen adsorption–desorption isotherms (Fig. S7a†) indicate that the SSA of HCNs increased significantly after CO2 activation, especially for HCNs-5h (1591.0 m2 g−1) and HCNs-7h (1726.5 m2 g−1). The detailed information on the pore volume and SSAs of all samples is presented in Table S2,† further proving that CO2 activation can increase both the numbers of micropores and mesopores for HCNs. The DFT pore size distribution (Fig. S7b†) implies that the HCNs-5h shows numerous micropores and mesopores compared to HCNs. In addition, Raman spectroscopy (Fig. S8a†) and XRD (Fig. S8b†) indicate that HCNs-5h have more carbon defects than HCNs. Afterward, nitric acid was used to generate oxygen-containing groups (C![[double bond, length as m-dash]](https://www.rsc.org/images/entities/char_e001.gif) O, COOH, OH) on the surface of HCNs-5h, which is beneficial for adsorbing metal ions in aqueous solution.42 Many studies43,44 have shown that the oxidation treatment of nitric acid impacts the SSA and pore structure of carbon black, in agreement with our experimental results (Fig. S9†). Because of the ultra-high SSA, massive micropores, the presence of defects as well as oxygen-containing groups on the surface, O–HCNs-5h has an immense adsorption ability towards Ni2+ in aqueous solution, which is helpful to obtain a high single metal loading. Besides, the presence of massive micropores wrapped with Ni2+ can harness the protective strength in the subsequent pyrolysis procedure, preventing the aggregation and migration of nickel metal, thereby leading to the formation of isolated Ni atoms. Finally, the Ni2+–O-HCNs-5h was mixed with C3N4 as the nitrogen source at a mass ratio of 1
O, COOH, OH) on the surface of HCNs-5h, which is beneficial for adsorbing metal ions in aqueous solution.42 Many studies43,44 have shown that the oxidation treatment of nitric acid impacts the SSA and pore structure of carbon black, in agreement with our experimental results (Fig. S9†). Because of the ultra-high SSA, massive micropores, the presence of defects as well as oxygen-containing groups on the surface, O–HCNs-5h has an immense adsorption ability towards Ni2+ in aqueous solution, which is helpful to obtain a high single metal loading. Besides, the presence of massive micropores wrapped with Ni2+ can harness the protective strength in the subsequent pyrolysis procedure, preventing the aggregation and migration of nickel metal, thereby leading to the formation of isolated Ni atoms. Finally, the Ni2+–O-HCNs-5h was mixed with C3N4 as the nitrogen source at a mass ratio of 1![[thin space (1/6-em)]](https://www.rsc.org/images/entities/char_2009.gif) :
:![[thin space (1/6-em)]](https://www.rsc.org/images/entities/char_2009.gif) 15 and pyrolyzed at 800 °C under an N2 flow to obtain the Ni–N-HCNs-5h catalyst.
15 and pyrolyzed at 800 °C under an N2 flow to obtain the Ni–N-HCNs-5h catalyst.
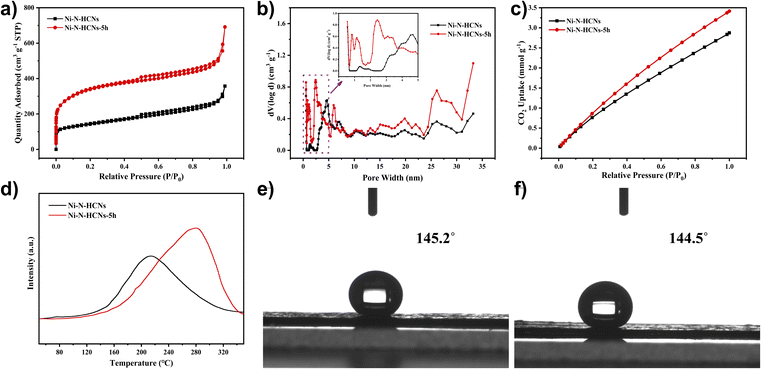
The SSA and porosity of the as-prepared catalysts were first characterized by nitrogen adsorption–desorption measurement. As illustrated in Fig. 2a, the Ni–N-HCNs-5h and Ni–N-HCNs both exhibit a typical type IV isotherm featuring a pronounced H-type hysteresis loop at medium pressure, suggesting the presence of a mesoporous structure. Besides, the rapid increase in low-pressure area, especially for Ni–N-HCNs-5h, is indicative of microporous characteristics. The DFT pore size distribution plot (Fig. 2b) further confirms the coexistence of micropores and mesopores. In addition, Ni–N-HCNs-5h shows more micropores and mesopores than those of Ni–N-HCNs (Table S3†), which is more conducive to the adsorption of CO2 and the exposure of active sites.
To further characterize the adsorption capacity and binding strength of the catalysts to the reactants, CO2-BET and CO2-TPD measurements were performed. As shown in Fig. 2c, Ni–N-HCNs-5h has a significantly larger CO2 adsorption capacity than Ni–N-HCNs. Fig. 2d shows the CO2-TPD profiles of the Ni–N-HCNs-5h and Ni–N-HCNs. The higher desorption temperature means greater binding strength between the catalyst and adsorbate.45,46 The chemical desorption peaks for Ni–N-HCNs and Ni–N-HCNs-5h were located at the temperatures of 214 °C and 280 °C, respectively, indicating that Ni–N-HCNs-5h binds to CO2 more easily than Ni–N-HCNs. In addition, the adsorption capacity of the adsorbate is positively correlated with the area of the desorption peak.47 The Ni–N-HCNs-5h presents a significantly larger adsorption capacity for CO2 than Ni–N-HCNs. Besides, Ni–N-HCNs-5h and Ni–N-HCNs present high hydrophobicity (Fig. 2e and f), which can inhibit water transport and thus suppress the HER.
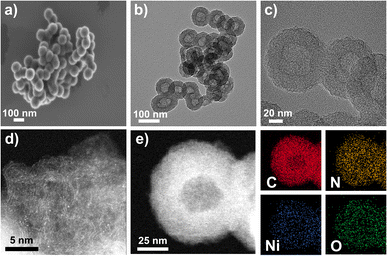
The morphologies and structures of the catalysts were studied by scanning electron microscopy (SEM). As shown in Fig. 3a, S10, and S11, all catalysts inherit the morphology of the supports, demonstrating uniform spherical shapes with an average diameter of 90–100 nm. By comparing backscatter (BED-C) and low-resolution SEM (LED) images (Fig. S10b, S10d, S11b and S11d†), it is evident that metal NPs are absent in any catalyst because no bright dots were observed in BED-C images. High-resolution TEM (HRTEM) images (Fig. 3b, c, S12, and S13†) show that the Ni–N-HCNs-5h and Ni–N-HCNs catalysts present a hollow sphere shape with an outer diameter of 90–100 nm (Fig. S6c and S6d†), which is in line with SEM results. The low-resolution HAADF-STEM images (Fig. S14†) suggest that Ni may exist as single atoms in all catalysts due to the uniformly distributed bright areas. Besides, the corresponding EDS images show that the elements of C, N, Ni, and O are uniformly distributed in Ni–N-HCNs (Fig. S15a†) and Ni–N-HCNs-5h (Fig. S15b†). To further confirm whether Ni in the Ni–N-HCNs-5h catalyst exists as an isolated atom, high-resolution HAADF-STEM was conducted. As shown in Fig. 3d, many bright dots are uniformly dispersed and separated from each other, which are treated as heavier Ni single atoms compared with C. The high-resolution HAADF-STEM with the EDS image (Fig. 3e) shows that the elements of C, N, Ni, and O are evenly dispersed on a single hollow carbon sphere, matching the EDS images of low-resolution HAADF-STEM (Fig. S15b†).
As shown in Fig. S16a,† only graphitic carbon (002) and (101) planes were observed among all the catalysts, indicating the absence of Ni NPs, which aligns with the HAADF-STEM, HRTEM, and SEM results. Besides, the intensity of the graphitic carbon (002) peak in Ni–N-HCNs-5h is weaker than in Ni–N-HCNs, suggesting more defective carbon in Ni–N-HCNs-5h than in Ni–N-HCNs. Furthermore, the Raman spectroscopy depicted in Fig. S16b† indicates more defects in Ni–N-HCNs-5h than in Ni–N-HCNs, consistent with the XRD results. X-ray photoelectron spectroscopy (XPS) was performed to study the surface compositions and chemical states of Ni–N-HCNs-xh and Ni–N-HCNs. As shown in Fig. S17a and Table S3,† all catalysts contain four elements: C, N, Ni, and O, and the content of Ni in Ni–N-HCNs-5h (2.21 wt%) is significantly higher than that in Ni–N-HCNs (0.32 wt%). Fig. S16c† presents the Ni 2p XPS of the as-prepared catalysts. All the binding energies of the Ni 2p3/2 peak in the catalysts are around 855.0 eV, which is lower than that of Ni2+ in NiPc (855.7 eV)48 and higher than that of Ni0 in Ni metal (853.0 eV),49 revealing the valence state of Ni in all catalysts is between 0 and +2. The peak intensity of Ni 2p increases from Ni–N-HCNs to Ni–N-HCNs-5h and then decreases to Ni–N-HCNs-7h, in agreement with the Ni loading testing by XPS (Table S3†). However, by comparing the Ni content measured by ICP-OES and XPS, we found that except for Ni–N-HCNs-7h, the Ni content obtained by both quantitative methods remained almost the same for other catalysts, suggesting many active sites were located deeper inside the Ni–N-HCNs-7h and found it challenging to participate in the CO2 electrochemical reaction due to the long distance for the reactant to travel. The N 1s XPS of all catalysts (Fig. S16d and S17b–S17e†) could be deconvolved into five types of nitrogen, including pyridinic N (398.2 ± 0.2 eV), metal N (399.3 ± 0.2 eV), pyrrolic N (400.0 ± 0.2 eV), graphitic N (402.0 ± 0.2 eV), and oxidized N (>403.5 eV).25,50,51 As shown in Table S4,† the Ni–N-HCNs-5h catalyst yields the highest metal–N content (3.67 wt%), which explains Ni–N-HCNs-5h's outstanding CO2 electrochemical activity due to the Ni–N species being directly related to the catalytic activity.52
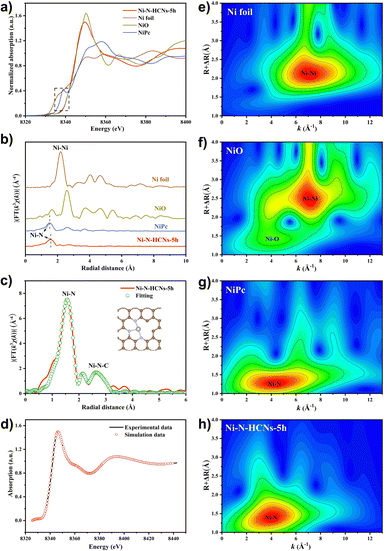
The electronic structure and local coordination environment of the Ni atom in Ni–N-HCNs-5h were further investigated by X-ray absorption spectroscopy (XAS). Fig. 4a shows the Ni K-edge X-ray absorption near-edge structure (XANES) of Ni–N-HCNs-5h, as well as those of NiPc, NiO, and Ni foil as the references. Clearly, the pre-edge and near-edge adsorption energies of Ni–N-HCNs-5h are between those of Ni foil and NiO and much closer to that of NiO, indicating that the valence state of the Ni atom in Ni–N-HCNs-5h is approaching +2, which is consistent with the Ni 2p XPS results. The Fourier transform (FT) k3-weighted χ(k) function of the extended X-ray absorption fine structure (EXAFS) spectra of Ni–N-HCNs-5h presents a prominent peak located at 1.56 Å, which can be assigned to the Ni–N bond (Fig. 4b). The absence of a Ni–Ni peak at about 2.21 Å confirms the isolated Ni atom for Ni–N-HCNs-5h. Furthermore, the relative intensity in Ni–N-HCNs-5h is lower than that of NiPc, indicating the coordinatively unsaturated state of the Ni species. It must be mentioned that the weak peak at 2.15 Å for Ni–N-HCNs-5h can be ascribed to the scatter signal of Ni–N–C at the second coordination shell instead of the Ni–Ni bond (Table S5†). To determine the coordination environment of the Ni atom, the FT-EXAFS of Ni–N-HCNs-5h was fitted in R space. The fitting curves agree well with the experimental curves (Fig. S18a†). As shown in Fig. 4c and Table S5,† the Ni–N coordination number is 3.2 ± 0.3 for Ni–N-HCNs-5h, implying the coordinatively unsaturated state of Ni species. Compared with Ni foil, NiO, and NiPc (Fig. 4e–g), only the Ni–N coordination signal was observed in the Wavelet Transform (WT) spectrum of Ni–N-HCNs-5h (Fig. 4h), which further proves that the Ni species in the catalyst exist as single atoms rather than clusters and nanoparticles. Based on the HAADF-STEM and XAS results, we constructed a model of NiN3V (where V represents a vacancy) to simulate the catalytic active site of Ni–N-HCNs-5h. To prove the rationality and accuracy of the constructed model, we conducted the synchrotron simulation calculations of Ni–N-HCNs-5h. As shown in Fig. 4d, the simulation curve fits the experimental curve well, indicating the catalytic active site mode is consistent with NiN3V.
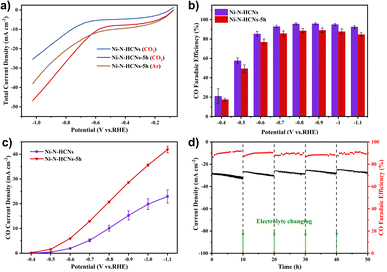
The CO2 electroreduction performance was first evaluated in a gas-tight H-type cell containing 0.5 M KHCO3 solution (see the Experimental section for details). Fig. 5a shows the LSV curves of Ni–N-HCNs and Ni–N-HCNs-5h under CO2 and Ar atmospheres. Apparently, Ni–N-HCNs-5h exhibits a more considerable current density in CO2-saturated electrolytes than in an Ar atmosphere from −0.6 V to −1.0 V, indicating Ni–N-HCNs-5h is active for ECR. Besides, the current density of Ni–N-HCNs-5h is much larger than that of Ni–N-HCNs in CO2-saturated 0.5 M KHCO3 solution, suggesting that much better catalytic activity could be achieved in Ni–N-HCNs-5h. Then, the selectivity and reaction rate of Ni–N-HCNs-5h and Ni–N-HCNs towards ECR were investigated by controlled potential electrolysis in CO2-saturated electrolyte. During potentiostatic electrolysis ranging from −0.4 V to −1.1 V (Fig. S19†), the current density of all catalysts remains stable over time. Only CO and H2 were detected by online gas chromatography (Fig. S20†), and no liquid products were formed by nuclear resonance spectroscopy (Fig. S21†). Fig. 5b shows the CO faradaic efficiency of Ni–N-HCNs and Ni–N-HCNs-5h under different applied potentials. Clearly, Ni–N-HCNs maintain the highest CO FE over the entire potential range, and the maximum CO FE achieved is 95.7% at −0.9 V, while that of Ni–N-HCNs-5h is 89.0% at −0.9 V. Besides, when we reduced the loading of Ni–N-HCNs-5h on the working electrode from 1.5 mg cm−2 to 0.1 mg cm−2, the selectivity of CO was significantly improved (Fig. S22a†). Although the increasing loading in the working electrode enhances the number of active sites, the accumulation of catalyst particles leads to a decrease in the utilization of active sites, adversely influencing the selectivity of the product. The total and partial product current densities are also significant indicators of CO2 electrochemical performance. As shown in Fig. S22b,† Ni–N-HCNs-5h shows a significantly enhanced current density compared to Ni–N-HCNs, obtaining a total current density of 49.5 mA cm−2 at −1.1 V.
Furthermore, the CO partial current densities of Ni–N-HCNs and Ni–N-HCNs-5h are depicted in Fig. 5c. The CO partial current density of Ni–N-HCNs-5h was greater than that of Ni–N-HCNs, reaching 41.9 mA cm−2 at −1.1 V, almost twice that of Ni–N-HCNs. Additionally, Ni–N-HCNs-5h remains stable and yields a CO FE ranging from 89% to 91% at −0.9 V for 50 h in the CO2-saturated 0.5 M KHCO3 solution (Fig. 5d). The slight decay in the total current density may arise from the frequent start-stop because the electrolyte needed to be refreshed every 10–12 h to eliminate the effect of KHCO3 concentration on the performance. Besides, as shown in Fig. S23,† the contact angle of the catalyst changes from 143.7° to 124.2°, indicating the surface of the electrode became hydrophilic (Fig. S23†) due to prolonged immersion in the electrolyte, which may also be a trigger for the slight attenuation of the current density. The HRTEM images of Ni–N-HCNs-5h after the stability test (Fig. S24a–S24d†) show no changes in morphology and structure. Besides, the low-resolution HAADF-STEM corresponding with the EDS images (Fig. S23e†) shows that C, N, Ni, and O are evenly distributed on the surface of the Ni–N-HCNs-5h. After the stability test, the cathode electrolyte was characterized using ICP-OES, and no Ni ions were detected, suggesting the robust stability of the Ni–N-HCNs-5h.
To investigate the CO2 activation time on the catalyst performance, a series of Ni–N-HCNs-xh (x = 1, 3, 5, and 7) catalysts were prepared. As shown in Fig. S25, Ni–N-HCNs-5h, prepared with a CO2 activation time of 5 h, exhibited the best catalytic activity and selectivity. In addition, to explore the effect of pyrolysis temperature on the catalytic activity, we synthesized the Ni–N-HCNs-5h catalysts under different temperatures (700 °C, 800 °C, and 900 °C). Fig. S26a and S26b† show that Ni–N-HCNs-5h obtained by pyrolysis at 800 °C exhibits the best catalytic activity and product selectivity toward CO2 electrochemical reduction. According to the analysis data of Raman (Fig. S26c†) and XPS (Fig. S16d, S26d–S26f, and Table S7†), too low pyrolysis temperature resulted in a lower carbon content of the catalyst, which affects the conductivity of the catalyst and leads to a significant reduction in current density. Meanwhile, at a higher pyrolysis temperature (900 °C), Ni is prone to migrate and agglomerate, resulting in the loss of Ni–Nx active sites (Table S7†), manifested by an apparent decrease in the CO FE. Similarly, we optimized the doping amount of C3N4 and found the optimal ratio of Ni2+–O-HCNs-5h and C3N4 is 1![[thin space (1/6-em)]](https://www.rsc.org/images/entities/char_2009.gif) :
:![[thin space (1/6-em)]](https://www.rsc.org/images/entities/char_2009.gif) 15 (Fig. S27a and S27b†), due to the highest content of carbon (Fig. S27c and Table S7†) and metal–N (Fig. S27d, S27e, and Table S7†).
15 (Fig. S27a and S27b†), due to the highest content of carbon (Fig. S27c and Table S7†) and metal–N (Fig. S27d, S27e, and Table S7†).
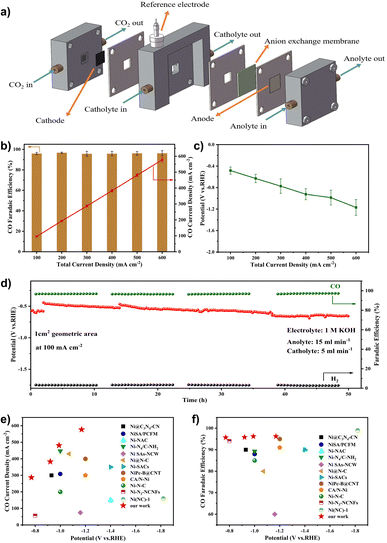
We used the gas-fed flow cell coupled with a gas diffusion electrode (GDE) instead of the H-cell to address the mass transfer limit and thus obtain high current density (Fig. 6a). To demonstrate the superiority of the flow cell configuration, we compared the electrocatalytic performance of the Ni–N-HCNs-5h catalyst in the flow cell and H-cell. As shown in Fig. S22b† and 6c, the total current density of the flow cell is much better than that in the H-cell at the same potential. For example, the total current density reaches 500 mA cm−2 in the flow cell, which is 12.3 times that in the H-cell (40.7 mA cm−2) at −1.0 V. It is worth noting that the CO FE of Ni–N-HCNs-5h remains over 95% in a broad operating total current density range from 100 mA cm−2 to 600 mA cm−2 in the flow cell (Fig. 6b), which is much better than that of the H-cell (Fig. 5b, the FE of CO is less than 90% at all applied potentials). During the continuous 50 h constant current electrolysis, Ni–N-HCNs-5h shows no decays in the CO faradaic efficiency (∼96%) and only a slight attenuation of the potential (∼200 mV), suggesting the excellent stability of Ni–N-HCNs-5h (Fig. 6d). Besides, after the stability test, the structure and morphology of Ni–N-HCNs-5h remained intact (Fig. S28a and Fig. S28b†). Besides, Ni ions were absent in the electrolyte after the stability test measured by ICP-OES, suggesting the outstanding stability of the Ni–N-HCNs-5h. To clarify the reason for the potential change, we first characterized the wettability of the catalyst before and after the stability test, and the results are shown in Fig. S28c and S28d.† The contact angle of the catalyst varied from 146.3° to 118.0°, indicating a significant decrease in hydrophobicity, which may also be a major reason for potential degradation. Compared with other previously reported catalysts (Fig. 6e and f), Ni–N-HCNs-5h is one of the state-of-the-art Ni single-atom catalysts for ECR to CO (the detailed results of catalysts are displayed in Table S9†).
To shed light on the excellent ECR activity of Ni–N-HCNs-5h, the electrochemically active surface area (ECSA) of the catalysts was estimated using the double-layer capacitance (Cdl) method to study their available surface area during the electrocatalytic process.53,54 As shown in Fig. S29a–S29c,† the Cdl of Ni–N-HCNs-5h is 19.51 mF cm−2, 1.4 times higher than that of Ni–N-HCNs (Cdl = 13.84 mF cm−2). The higher ECSA in Ni–N-HCNs-5h should be derived from exposure to more catalytic active sites, consistent with the rich and well-developed porous structure in Ni–N-HCNs-5h. Additionally, the Ni–N-HCNs-5h has a Tafel slope of 143 mV dec−1 (Fig. S28e†), smaller than that of Ni–N-HCNs (150.7 mV dec−1), indicating the faster kinetics toward the generation of CO over Ni–N-HCNs-5h. The Tafel slope of Ni–N-HCNs-5h is close to 118 mV dec−1, implying that the CO2 molecule binding with a proton and electron to form a *COOH intermediate is the rate-determining step (RDS).55
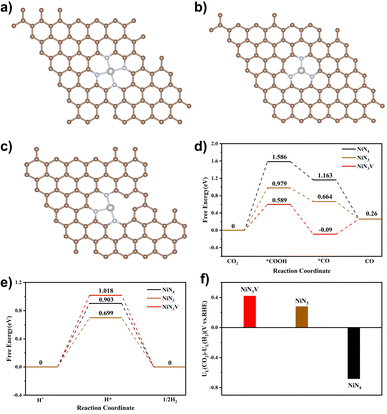
DFT calculations were performed to further explain the high catalytic activity of Ni–N-HCNs-5h. Based on the EXAFS and XANES results, we constructed three typical Ni–N structures: NiN4 (Fig. 7a), NiN3 (Fig. 7b), and NiN3V (Fig. 7c), where V represents a coordination vacancy. Most of the electrochemical processes, such as nitrate reduction to ammonia and CO2 reduction to CO, occur in aqueous solution, so it is necessary to consider the influence of the solution environment on the free energy of reaction intermediates.56 Based on the above considerations, the Poisson–Boltzmann implicit solvation model with a dielectric constant of e = 80 for water was used to simulate the H2O solvent environment.
The reaction pathway for ECR to CO often involves three steps, in which the formation of *COOH or the desorption of *CO is considered a potential RDS depending on the binding energy of *COOH and *CO. For most Ni single-atom catalysts, the reduction of CO2 to *COOH tends to be the RDS, which agrees with our experiment results (the Tafel slope is close to 118 mV dec−1). As shown in Fig. 7d, the free energy required to generate the *COOH intermediate at the NiN3V site (0.589 eV) is significantly lower than that of the NiN4 site (1.586 eV) and NiN3 site (0.979 eV), indicating that the unsaturated Ni–N site has much higher ECR activity. Since the HER is the primary competitive reaction in the ECR to CO, the free energy diagrams of the HER were also calculated. As shown in Fig. 7e, the H* prefers to adsorb on NiN3 than NiN3V and NiN4 sites, due to the lowest free energy needed to generate the H* intermediate on NiN3 (0.699 eV) compared to NiN3V (1.018 eV) and NiN4 (0.903 eV).
To demonstrate the effect of the solution environment on the reaction free energy clearly, we compared the free energies of the ECR and HER at NiN3V and NiN4 sites in the presence and absence of the H2O environment. After the introduction of the H2O into the calculation system, the free energies of all intermediates are changed. For example, the free energy for *COOH formation decreased from 0.644 eV to 0.598 eV over the NiN3V site (Fig. S30a†), indicating the introduction of water molecules has a facilitating effect on the first step of the ECR to CO. Besides, the H* is preferred to adsorb on the NiN3V site than NiN4 in the absence of H2O, due to the lower free energy for H* over NiN3V (0.632 eV) compared to that of NiN4 (1.533 eV). However, in the aqueous solution system, the adsorption energy of H* has changed significantly. The free energy for H* is much smaller over NiN4 (0.903 eV) than NiN3V (1.018 eV), suggesting that the HER is more likely to occur at the NiN4 site in the real solution environment.
Recent studies have shown that the difference in the thermodynamic limiting potential between the HER and ECR (UL(CO2) − UL(H2)) has a great impact on the selectivity of the product, and the more positive the value of (UL(CO2) − UL(H2)), the higher the CO selectivity.57–59 As shown in Fig. 7f, the NiN3V site presents a more positive (UL(CO2) − UL(H2)) value than NiN3 and NiN4, suggesting the unsaturated Ni–N site may have higher product selectivity. These results further indicated that the superior activity of Ni–N-HCNs-5h toward ECR originated from the large adsorption capacity with CO2 and the strong binding strength with the *COOH intermediate due to the porous structure and unsaturated Ni–N sites.
Conclusions
In summary, we have successfully synthesized a robust Ni single-atom catalyst, denoted as Ni–N-HCNs-5h, by anchoring nickel atoms onto hollow carbon nanospheres characterized by a microporous structure and a high specific surface area. The hydrophobic nature of the catalyst inhibits unwanted hydrogen evolution side reactions, the microporous structure contributes to a substantial CO2 adsorption capacity, and the unsaturated Ni–N structure enhances the affinity for *COOH. The combination of these three advantages results in an electrochemical reduction (ECR) of CO2 to CO with an exceptional selectivity, achieving a remarkable 95% CO faradaic efficiency (FE) consistently across a wide range of continuous current densities, from 100 mA cm−2 to 600 mA cm−2. Importantly, the catalyst exhibits an impressive CO partial current density of 577 mA cm−2 at a minimal overpotential of just −1.17 V vs. RHE. These findings underscore the considerable potential of microenvironment engineering, realized through the amalgamation of a hydrophobic surface, microporous structure, and unsaturated Ni–N active sites, to markedly elevate current densities in industrially pertinent electrochemical CO2-to-CO reduction by single-atom catalysts.Author contributions
Zhicheng Liu: conceptualization, methodology, investigation, formal analysis, visualization, writing – original draft, writing – review & editing. Longsheng Cao: supervision, writing – review & editing, formal analysis, project administration. Manli Wang: methodology, investigation. Yun Zhao: writing – review & editing, project administration, funding acquisition. Ming Hou: supervision, writing – review & editing, project administration. Zhigang Shao: supervision, writing – review & editing, project administration.Conflicts of interest
The authors declare no conflict of interest.Acknowledgements
This work was supported by the National Natural Science Foundation of China (NSFC) with grant no. 22279134.Notes and references
- L. Li, Y. Huang and Y. Li, EnergyChem, 2020, 2, 100024 CrossRef.
- N. Landaluce, M. Perfecto-Irigaray, J. Albo, G. Beobide, O. Castillo, A. Irabien, A. Luque, A. S. J. Méndez, A. E. Platero-Prats and S. Pérez-Yáñez, Sci. Rep., 2022, 12, 8505 CrossRef CAS.
- T. Ahmad, S. Liu, M. Sajid, K. Li, M. Ali, L. Liu and W. Chen, Nano Res. Energy, 2022, 1, 9120021 CrossRef.
- L. Li, I. M. u. Hasan, Farwa, R. He, L. Peng, N. Xu, N. K. Niazi, J.-N. Zhang and J. Qiao, Nano Res. Energy, 2022, 1, 9120015 Search PubMed.
- S. Mou, Y. Li, L. Yue, J. Liang, Y. Luo, Q. Liu, T. Li, S. Lu, A. M. Asiri and X. J. N. R. Xiong, Nano Res., 2021, 14, 2831–2836 CrossRef CAS.
- S. Gao, T. Wang, M. Jin, S. Zhang, Q. Liu, G. Hu, H. Yang, J. Luo and X. Liu, Sci. China Mater., 2023, 66, 1013–1023 CrossRef CAS.
- S. Zhang, P. Kang and T. J. Meyer, J. Am. Chem. Soc., 2014, 136, 1734–1737 CrossRef CAS.
- S. Mou, T. Wu, J. Xie, Y. Zhang, L. Ji, H. Huang, T. Wang, Y. Luo, X. Xiong, B. Tang and X. Sun, Adv. Mater., 2019, 31, 1903499 CrossRef PubMed.
- L. Ji, L. Li, X. Ji, Y. Zhang, S. Mou, T. Wu, Q. Liu, B. Li, X. Zhu and Y. J. A. C. Luo, Angew. Chem., Int. Ed., 2020, 132, 768–772 CrossRef.
- S. Liang, Q. Jiang, Q. Wang and Y. Liu, Adv. Energy Mater., 2021, 11, 2101477 CrossRef CAS.
- C. Wang, X. Hu, X. S. Hu, X. Y. Liu, Q. X. Guan, R. Hao, Y. P. Liu and W. Li, Appl. Catal. B Environ., 2021, 296, 120331 CrossRef CAS.
- W. Zhu, R. Michalsky, Ö. Metin, H. Lv, S. Guo, C. J. Wright, X. Sun, A. A. Peterson and S. Sun, J. Am. Chem. Soc., 2013, 135, 16833–16836 CrossRef CAS PubMed.
- Q. Lu, J. Rosen, Y. Zhou, G. S. Hutchings, Y. C. Kimmel, J. G. Chen and F. Jiao, Nat. Commun., 2014, 5, 3242 CrossRef.
- D. Gao, H. Zhou, J. Wang, S. Miao, F. Yang, G. Wang, J. Wang and X. Bao, J. Am. Chem. Soc., 2015, 137, 4288–4291 CrossRef CAS PubMed.
- Y. Pan, R. Lin, Y. Chen, S. Liu, W. Zhu, X. Cao, W. Chen, K. Wu, W.-C. Cheong, Y. Wang, L. Zheng, J. Luo, Y. Lin, Y. Liu, C. Liu, J. Li, Q. Lu, X. Chen, D. Wang, Q. Peng, C. Chen and Y. Li, J. Am. Chem. Soc., 2018, 140, 4218–4221 CrossRef CAS.
- Q. Chang, Y. Liu, J.-H. Lee, D. Ologunagba, S. Hwang, Z. Xie, S. Kattel, J. H. Lee and J. G. Chen, J. Am. Chem. Soc., 2022, 144, 16131–16138 CrossRef CAS.
- S. Ren, D. Joulié, D. Salvatore, K. Torbensen, M. Wang, M. Robert and C. P. Berlinguette, Science, 2019, 365, 367–369 CrossRef CAS.
- B. Kumar, M. Asadi, D. Pisasale, S. Sinha-Ray, B. A. Rosen, R. Haasch, J. Abiade, A. L. Yarin and A. Salehi-Khojin, Nat. Commun., 2013, 4, 2819 CrossRef.
- T. Liu, S. Ali, Z. Lian, C. Si, D. S. Su and B. Li, J. Mater. Chem. A, 2018, 6, 19998–20004 RSC.
- H. Yang, Y. Wu, Q. Lin, L. Fan, X. Chai, Q. Zhang, J. Liu, C. He and Z. Lin, Angew. Chem., Int. Ed., 2018, 57, 15476–15480 CrossRef CAS PubMed.
- C. Wang, Y. Liu, H. Ren, Q. Guan, S. Chou and W. Li, ACS Catal., 2022, 12, 2513–2521 CrossRef CAS.
- J. Xie, X. Zhao, M. Wu, Q. Li, Y. Wang and J. Yao, Angew. Chem., Int. Ed., 2018, 57, 9640–9644 CrossRef CAS PubMed.
- T. Hou, J. Ding, H. Zhang, S. Chen, Q. Liu, J. Luo and X. Liu, Mater. Chem. Front., 2023, 7, 4952–4960 RSC.
- T. Wang, Q. Zhang, K. Lian, G. Qi, Q. Liu, L. Feng, G. Hu, J. Luo and X. Liu, J. Colloid Interface Sci., 2024, 655, 176–186 CrossRef CAS.
- A. S. Varela, N. Ranjbar Sahraie, J. Steinberg, W. Ju, H.-S. Oh and P. Strasser, Angew. Chem., Int. Ed., 2015, 54, 10758–10762 CrossRef CAS.
- D. M. Weekes, D. A. Salvatore, A. Reyes, A. Huang and C. P. Berlinguette, Acc. Chem. Res., 2018, 51, 910–918 CrossRef CAS.
- T. N. Nguyen and C.-T. Dinh, Chem. Soc. Rev., 2020, 49, 7488–7504 RSC.
- Z. Chen, X. Zhang, W. Liu, M. Jiao, K. Mou, X. Zhang and L. Liu, Energy Environ. Sci., 2021, 14, 2349–2356 RSC.
- L. Lin, H. Li, C. Yan, H. Li, R. Si, M. Li, J. Xiao, G. Wang and X. Bao, Adv. Mater., 2019, 31, 1903470 CrossRef CAS.
- A. Zhang, R. He, H. Li, Y. Chen, T. Kong, K. Li, H. Ju, J. Zhu, W. Zhu and J. Zeng, Angew. Chem., Int. Ed., 2018, 57, 10954–10958 CrossRef CAS.
- H. Li, H. Li, P. Wei, Y. Wang, Y. Zang, D. Gao, G. Wang and X. Bao, Energy Environ. Sci., 2023, 16, 1502–1510 RSC.
- F. P. García de Arquer, C.-T. Dinh, A. Ozden, J. Wicks, C. McCallum, A. R. Kirmani, D.-H. Nam, C. Gabardo, A. Seifitokaldani, X. Wang, Y. C. Li, F. Li, J. Edwards, L. J. Richter, S. J. Thorpe, D. Sinton and E. H. Sargent, Science, 2020, 367, 661–666 CrossRef.
- C. Xia, P. Zhu, Q. Jiang, Y. Pan, W. Liang, E. Stavitski, H. N. Alshareef and H. Wang, Nat. Energy, 2019, 4, 776–785 CrossRef CAS.
- K. Mou, Z. Chen, X. Zhang, M. Jiao, X. Zhang, X. Ge, W. Zhang and L. Liu, Small, 2019, 15, 1903668 CrossRef CAS.
- X. Wang, Z. Chen, X. Zhao, T. Yao, W. Chen, R. You, C. Zhao, G. Wu, J. Wang, W. Huang, J. Yang, X. Hong, S. Wei, Y. Wu and Y. Li, Angew. Chem., Int. Ed., 2018, 57, 1944–1948 CrossRef CAS PubMed.
- G. Zeng, S. Lou, H. Ying, X. Wu, X. Dou, N. Ai and J. Wang, J. Chem., 2018, 2018, 4319149 Search PubMed.
- K. Duy Anh, N. Hong Nam and T. Tsubota, Biomass Bioenergy, 2021, 148, 106039 CrossRef.
- Q. Cheng, K. Mao, L. Ma, L. Yang, L. Zou, Z. Zou, Z. Hu and H. Yang, ACS Energy Lett., 2018, 3, 1205–1211 CrossRef CAS.
- H. Yang, Q. Lin, Y. Wu, G. Li, Q. Hu, X. Chai, X. Ren, Q. Zhang, J. Liu and C. He, Nano Energy, 2020, 70, 104454 CrossRef CAS.
- H. Yang, Q. Lin, C. Zhang, X. Yu, Z. Cheng, G. Li, Q. Hu, X. Ren, Q. Zhang, J. Liu and C. He, Nat. Commun., 2020, 11, 593 CrossRef CAS PubMed.
- Z. W. Seh, J. Kibsgaard, C. F. Dickens, I. Chorkendorff, J. K. Nørskov and T. F. Jaramillo, Science, 2017, 355, eaad4998 CrossRef.
- H. Chang, H. Pan, F. Wang, Z. Zhang, Y. Kang and S. Min, Nanoscale, 2022, 14, 10003–10008 RSC.
- A. Khelifi, M. C. Almazan-Almazan, M. Perez-Mendoza, M. Domingo-Garcia, F. J. Lopez-Domingo, L. Temdrara, F. J. Lopez-Garzon and A. Addoun, Fuel Process. Technol., 2010, 91, 1338–1344 CrossRef CAS.
- R. Berenguer and E. Morallon, Front. Mater., 2019, 6, 130 CrossRef.
- W. Guo and D. G. Vlachos, Nat. Commun., 2015, 6, 8619 CrossRef CAS.
- Q. Li, W. Xie, G. Chen, Y. Li, Y. Huang and X. Chen, Nano Res., 2015, 8, 3075–3084 CrossRef CAS.
- D. Deng, X. Chen, L. Yu, X. Wu, Q. Liu, Y. Liu, H. Yang, H. Tian, Y. Hu, P. Du, R. Si, J. Wang, X. Cui, H. Li, J. Xiao, T. Xu, J. Deng, F. Yang, P. N. Duchesne, P. Zhang, J. Zhou, L. Sun, J. Li, X. Pan and X. Bao, Sci. Adv., 2015, 1, e1500462 CrossRef PubMed.
- F. Petraki, V. Papaefthimiou and S. Kennou, Org. Electron., 2007, 8, 522–528 CrossRef CAS.
- Y. Goto, K. Taniguchi, T. Omata, S. Otsuka-Yao-Matsuo, N. Ohashi, S. Ueda, H. Yoshikawa, Y. Yamashita, H. Oohashi and K. Kobayashi, Chem. Mater., 2008, 20, 4156–4160 CrossRef CAS.
- F. Pan, W. Deng, C. Justiniano and Y. Li, Appl. Catal. B Environ., 2018, 226, 463–472 CrossRef CAS.
- N. R. Sahraie, U. I. Kramm, J. Steinberg, Y. Zhang, A. Thomas, T. Reier, J.-P. Paraknowitsch and P. Strasser, Nat. Commun., 2015, 6, 8618 CrossRef CAS PubMed.
- X. Tan, C. Yu, S. Cui, L. Ni, W. Guo, Z. Wang, J. Chang, Y. Ren, J. Yu, H. Huang and J. Qiu, Chem. Eng. J., 2022, 433, 131965 CrossRef CAS.
- C. Wang, Z. Liu, L. Dong, F. Du, J. Li, C. Chen, R. Ma, C. Li and C. Guo, J. Power Sources, 2023, 556, 232523 CrossRef CAS.
- F. Du, Z. Yao, J. Xiang, J. Li, C. Wang, C. Zhang, T. Hu, J. Liu, C. Li and C. Guo, Appl. Surf. Sci., 2023, 608, 155057 CrossRef CAS.
- C. W. Lee, N. H. Cho, S. W. Im, M. S. Jee, Y. J. Hwang, B. K. Min and K. T. Nam, J. Mater. Chem. A, 2018, 6, 14043–14057 RSC.
- T. Hu, C. Wang, M. Wang, C. M. Li and C. Guo, ACS Catal., 2021, 11, 14417–14427 CrossRef CAS.
- D. Kim, C. Xie, N. Becknell, Y. Yu, M. Karamad, K. Chan, E. J. Crumlin, J. K. Nørskov and P. Yang, J. Am. Chem. Soc., 2017, 139, 8329–8336 CrossRef CAS PubMed.
- W. Bi, X. Li, R. You, M. Chen, R. Yuan, W. Huang, X. Wu, W. Chu, C. Wu and Y. Xie, Adv. Mater., 2018, 30, 1706617 CrossRef.
- W. Ren, X. Tan, W. Yang, C. Jia, S. Xu, K. Wang, S. C. Smith and C. Zhao, Angew. Chem., Int. Ed., 2019, 58, 6972–6976 CrossRef CAS.
Footnote |
| † Electronic supplementary information (ESI) available. See DOI: https://doi.org/10.1039/d3ta07216a |
| This journal is © The Royal Society of Chemistry 2024 |

