DOI:
10.1039/D3TA07379C
(Paper)
J. Mater. Chem. A, 2024,
12, 9038-9054
Modulation of active surface sites on Ni–Fe–S by the dynamic hydrogen bubble template method for energy-saving hydrogen production†
Received
29th November 2023
, Accepted 4th March 2024
First published on 5th March 2024
Abstract
A 3-D porous structure of Ni–Fe–S nanosheets was created using a dynamic hydrogen bubble template (DHBT), which promotes active site exposure, on a nickel foam substrate as an efficient electrode for production of hydrogen through electrochemical splitting assisted by the urea oxidation reaction. In a DHBT, high applied current densities result in the reduction of H+ ions alongside the Ni–Fe–S, forming H2. These H2 bubbles block the surface and force the remaining ions to electrodeposit between the bubbles, resulting in a porous structure. The electrocatalyst exhibited remarkable performance for both the hydrogen evolution reaction (HER) and urea oxidation reaction (UOR). The parameters investigated in this study included applied current density, duration time, and FeSO4 concentration. The electrocatalyst synthesized at 5 A cm−2, 10 s, and 0.1 M FeSO4 demonstrated the highest catalytic activity, resulting in values of 85 and 173 mV vs. RHE for the HER and 1.26 and 1.30 V vs. RHE for the UOR to reach 10 and 100 mA cm−2, respectively. In the two electrode system of Ni–Fe–S//Ni–Fe–S, it only requires a low voltage of 1.337 V vs. RHE to launch a current density of 10 mA cm−2. The enhanced activity is thought to stem from charge separation between the negatively charged S and the positively charged Ni and Fe, as well as the larger electrochemical active surface area (ECSA) and increased porosity. An insignificant shift in the potential was observed over a duration of 50 h at 100 mA cm−2, indicating exceptional electrocatalytic stability for both the HER and UOR. This study presents the impact of the utilization of the UOR on enhancing the electrocatalytic performance of hydrogen production.
Introduction
Worldwide energy demand and limitations of fossil fuels, such as their scarcity and pollution, have obligated us to find stable and eco-friendly alternatives such as fuel cells, batteries, etc. Meanwhile, researchers have become interested in hydrogen due to its high energy density (33.6 kW h kg−1) recently.1–3 Electrochemical water splitting (EWS) is considered a promising method for hydrogen production due to its ability to generate high-purity hydrogen and its environmentally friendly nature. The HER and oxygen evolution reaction (OER) take place at the cathode and anode, respectively. The theoretical cell voltage for EWS is 1.23 V vs. SHE, but in practice, because of the sluggish kinetics of the OER and the electrocatalyst's surface resistance, 40–70% more is needed.4–6 Several options have been considered to resolve these issues: improving the kinetics of half-reactions by exploration of appropriate electrocatalysts and the substitution of the OER with alternative anodic reactions that offer more favorable characteristics.7,8 The OER can be replaced with alternative reactions that require lower overpotentials, such as urea, ethanol, methanol, hydrazine and other oxidation reactions.9–11 Li et al. reported a F–CoP bifunctional electrocatalyst fabricated via electrodeposition as a hydrazine-assisted water electrolyser with low Tafel slopes and great stability which requires only potentials of −90 mV and 41 mV at 1 A cm−2 for the HER and hydrazine oxidation reaction (HzOR).10 The UOR, which exhibits a lower potential of 0.37 V compared to the OER with a potential of 1.23 V vs. SHE, has been recognized as a promising and efficient alternative to the OER. Moreover, urea as wastewater in industrial and domestic sewage causes pollution which leads to health issues for humans and the environment because of its natural decomposition products.12 However, in urea electrolysis N2 and CO2 can be used to produce carbonates (eqn (1)–(3)). Hence, pairing the UOR and HER can increase hydrogen production potentially, decrease environmental problems with urea, and also prevent the formation of explosive combinations of O2/H2. The challenge for the UOR is that it requires high-performance electrocatalysts due to its 6e− transfer mechanism.12,13
Anode (UOR):
| | | CO(NH2)2 + 6OH− → N2 + 5H2O + CO2 + 6e− (E = 0.46 V vs. SHE) | (1) |
Cathode (HER):
| | | 6H2O + 6e− → 3H2 + 6OH− (E = 0.83 V vs. SHE) | (2) |
Overall:
| | | CO(NH2)2 + H2O → 3H2 + N2 + CO2 (ΔE = 0.37 V) | (3) |
Precious noble metals such as Pt and their oxides and complex structures (such as perovskite, spinel, and layered) have shown the best catalytic performance to date. In both acidic and basic electrolytes, they demonstrate low overpotential with fast kinetics.14–18 However, their high-cost and rarity do not make them affordable. Hence, it is highly desired to alter precious metals with plentiful nonprecious elements.19,20 Transition metal (especially Ni in strongly alkaline solutions) compounds such as sulfides, phosphides, selenides, hydroxides, and oxides have received much attention.21–25 Alloying Ni with other metals such as Fe, Mn, Mo, Co and so on has revealed improvements in catalytic efficiency.26–28 Recently, there has been significant interest in Ni–Fe alloys owing to their abundant availability and cost-effectiveness. Moreover, the inclusion of Fe in these alloys has been found to enhance the rate of hydrogen adsorption and desorption, making them even more attractive for various applications.29,30 Xie et al. synthesized Ni2P/FeP2 which can boost the OER activity via activating the Ni site with a new hydroxyl transmission channel and build the optimized reaction path of oxygen intermediates for lower adsorption energy.31 Ongoing investigations into Fe-based catalysts are driven by their abundance in the Earth's crust. Zhang et al. reported the remarkable durability of Fe3O4 electrodes doped with phosphorus, demonstrating 1000 hours of stability at a current density of 1000 mA cm−2 and a low overpotential of 138 mV at 100 mA cm−2 in 6 M KOH.32 Additionally, fluorine-doped cobalt-iron phosphides, synthesized through a hydrothermal method, exhibited excellent hydrogen production at high current densities, achieving just 304.4 mV.33 To further enhance catalytic performance, the introduction of heteroatoms such as S, P, and N has shown promise due to their intrinsic properties. Li et al. developed a P-modified Co/Ni3P heterostructure for water electrolysis assisted with hydrazine oxidation via a novel alternating electrodeposition strategy, achieving a high current density of 300 mA cm−2 with a small potential of 50 mV in a two-electrode system.34 Moreover, multielement or high-entropy alloys have garnered attention for their unique compounds. For instance, CoFeNiCrMn phosphide electrodeposited on NF revealed a distinctive nanosheet morphology, delivering 100 mA cm−2 with a low overpotential of 51 mV for the hydrogen evolution reaction coupled with hydrazine.35 The simultaneous presence of iron and sulfur can increase electrical conductivity, reduce energy barriers, and enhance reaction kinetics.36,37 In this regard, Cao et al. fabricated nano-porous Ni–Fe via dealloying for hydrogen production from urea sewage with a potential of 1.33 V vs. RHE at 10 mA cm−2.38 Moreover, Yin et al. constructed Ni–Fe–S through a solvothermal method with an overpotential of 115 mV vs. RHE for the HER at 10 mA cm−2.39 Nevertheless, the large-scale preparation of high-quality Ni–Fe–S remains a significant obstacle for its industrial applications. However, research studies indicate that Ni has gained significant attention as a catalyst due to its exceptional performance, characterized by a reduced hydrogen overpotential and high catalytic activity.
Recently, porous materials have attracted attention in electrocatalytic applications due to their high active surface area.40 Porous materials are synthesized through different methods such as nanoparticle-based, templating, decorations, and dealloying techniques.41–44 In the templating method removing conventional templates can be a complex process that risks damaging the structure. Porous materials fabricated using the dealloying technique may not be suitable for catalytic applications due to the uniform size of their pores. Mass transport restrictions caused by nano-pores located near the top surface of the structure can lead to limited transportation of electro-active species, such as gas or ions, to the interior of the structure. As a result, the overall surface area utilization is reduced, resulting in low efficiency.45 One promising approach to producing porous materials with a controllable porous structure and strong adherence is the utilization of the dynamic hydrogen bubble template (DHBT) as a binder-free method. Moreover, DHBT electrodeposition has other advantages such as a facile one-step synthesis process, eco-friendliness, low-cost, composition, coating thickness, potential, and current. Also, electrocatalysts that are produced through electrodeposition usually demonstrate great electrical conductivity. Zhong et al. fabricated NiFeOxHy nanosheets on nickel mesh via the DHBT method for OER applications with η100 = 256 mV vs. RHE.46 Wang et al. employed the DHBT method to create a porous structure of NiCo electrodes for the HER with an overpotential 54 mV for 10 mA cm−2.47 Other electrodes, such as fractal Ni,48 NiCuP,49 and CuCoP,50 were fabricated using the DHBT method for HER and OER applications. Hierarchical porous structures exhibit a high active surface area and appropriate wettability, thereby enhancing both ion and electron transportation as well as bubble detachment. These structures can possess superaerophobic or superhydrophilic properties, leading to improved electrocatalytic performance.51 The nanosheet architecture is frequently utilized in the creation of superaerophobic/superhydrophilic surfaces, and it enhances the efficiency of processes such as the HER and other evolution reactions. The utilization of nanosheets can greatly increase the active surface area and, at the same time, divide the triple phase contact line (TPCL) into separate points. This division results in a decrease in the volume of bubbles formed during their detachment from the surface, leading to a reduced number of bubbles and improved wettability. As a result, the electrocatalytic activity is enhanced.52,53 In recent years, there has been growing interest in transition metal sulfide (TMS) nanosheets due to their unique structure, abundant active sites, and capacity to adjust their electronic properties. TMSs have exhibited exceptional performance and show great potential for various applications, including electrocatalysis, batteries, photocatalysts, and supercapacitors.54–57 Particular attention has been paid to TMSs in the field of the HER due to their excellent chemical stability and electrical conductivity, for instance, WS2, CoS2, Co3S4, MoS2, CoMoSx, and NCoS2.58–63 Intrinsic activity and the extent of the active surface area are two key factors that can greatly influence electrocatalytic performance. Therefore, by carefully choosing and developing electrocatalysts that possess both high intrinsic electrocatalytic activity and a nanosheet structure, it is possible to create an electrocatalyst with exceptional electrocatalytic performance. In the current study, we employed DHBT electrodeposition to synthesize a Ni–Fe–S electrode, which serves as a dual-functional electrocatalyst for both the HER and the UOR. Here, the impacts of the applied current density, electrodeposition time, and concentration of FeSO4 as a main source of Fe were investigated.
Experimental procedure
Materials
Chemical reagents (NiSO4·6H2O (Ni and S source), NiCl2·6H2O (Ni source), Na2S2O3·5H2O (S source), Na3C6H5O7·2H2O (complexing agent), FeSO4·7H2O (Fe and S source), and H3BO3 (buffer) were purchased from Merck Co. and a local company and were of analytical grade. They were used without further purification.
Synthesis of 3D Ni–Fe–S electrocatalysts
A nickel foam (NF) substrate was cut into 1 cm × 1 cm pieces. In order to clean, activate, and eliminate surface oxides, substrates were immersed in acetone (C3H6O) and 20% HCl for 30 min and 30 s ultrasonically, respectively. This was then followed by rinsing in distilled water and drying in air. Electrodeposition was performed at different current densities (1, 2, 3, 5, and 6 A cm−2) and different duration times (3, 5, 10, and 30 s). The composition of the electrodeposition bath included 0.36 M NiSO4·6H2O, 0.12 M NiCl2·6H2O, 0.32 M Na2S2O3·5H2O, 0.3 M Na3C6H5O7·2H2O, 0.65 M H3BO3, and 0, 0.1, 0.2, and 0.3 M FeSO4·7H2O. A Pt electrode and NF substrates were utilized as the anode and cathode in the electrodeposition process. Also, the pH and temperature of the bath were set to 4.2 and 30 °C.
Electrochemical measurements
In the case of testing catalytic activity and performance linear sweep voltammetry (LSV) and electrochemical impedance spectroscopy (EIS) tests were conducted. In LSV tests, the potential range was −1 to −2 V vs. Ag/AgCl with a scan rate of 5 mV s−1. EIS tests were carried out at frequencies from 100 kHz to 10 mHz. For HER performance evaluation, the tests were carried out at potentials of 0, −100, and −200 mV vs. RHE, while for UOR performance evaluation, the tests were conducted at potentials of 1.3, 1.4, and 1.5 V vs. RHE. ZView software was employed to fit EIS data. To determine the stability of the electrodes, chronopotentiometry (CP) tests were performed for a period of 50 h, while a constant current density of 100 m cm−2 was applied. Cyclic voltammetry (CV) tests were performed for assessment of the double layer capacitance of electrodes in a 0.1 V non-faradic potential range with different scan rates from 5 to 100 mV s−1. Potentials were reported in terms of RHE. All tests were carried out using a three-electrode system, with the synthesized electrode, a Pt electrode, and a Ag/AgCl electrode as the working, counter, and reference electrode respectively in 1 M KOH + 0.5 M urea electrolyte with potentiostat/galvanostat Autolab 302N. All potentials were converted to RHE using eqn (4).| | | ERHE = E(Ag/AgCl) + 0.197 V vs. Ag/AgCl + 0.0591 pH | (4) |
Characterization
The surface morphology and chemical composition of the samples were examined using a TESCAN MIRA3 field-emission scanning electron microscope (FESEM) equipped with an energy-dispersive X-ray spectroscopy (EDS) detector. To further investigate X-ray diffraction (XRD) analysis was conducted. The XRD measurements were performed using a Cu Kα (λ = 1.5406 Å) radiation source, and the scanning rate was set at 0.02° s−1. This technique provides information on the crystallographic structure and phase composition of the samples, aiding in the understanding of their material properties. Additionally, X-ray photoelectron spectroscopy (XPS) analysis was carried out using a PHI Quantrera SXM instrument. This technique allowed for the characterization of the sample's surface chemistry and elemental oxidation states. By measuring the binding energies of the emitted photoelectrons, XPS provided valuable information on the elemental composition and chemical bonding of the surface species present in the samples.
Results and discussion
Microstructure and morphology
Fig. 1–3 display FESEM images illustrating the impact of applied current density, duration time, and FeSO4 concentration at magnifications of 1k× and 10k×, respectively. As the current was applied to the NF substrate 3D porous Ni–Fe–S was electrodeposited. Concurrently, the formation of H2 bubbles served as a template for the creation of a porous nanostructure. The electrodeposition reactions of ions can be described as follows (eqn (5)–(8)):| | | SO42− + 6e− + 8H+ → S + 4H2O | (7) |
| | | 2S2O32− + 8e− + 12H+ → 4S + 6H2O | (8) |
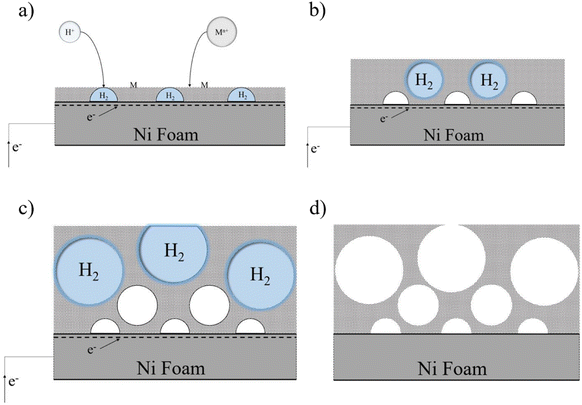 |
| | Fig. 1 Porous structure formation stages through time via the DHBT method. | |
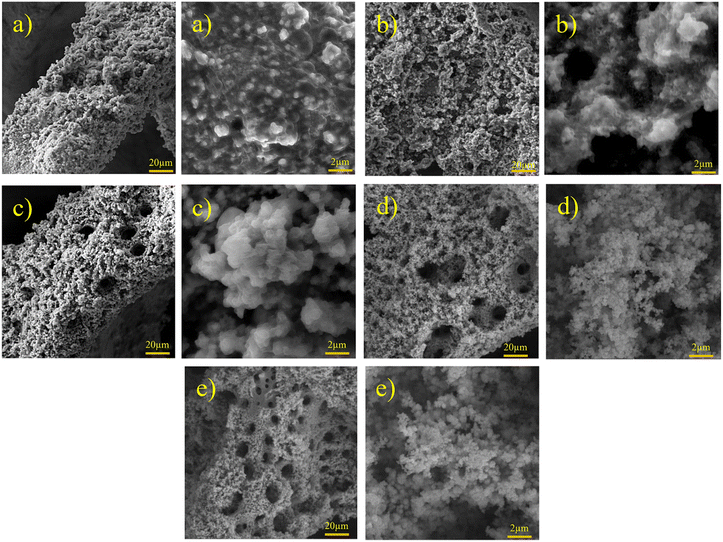 |
| | Fig. 2 FESEM images of Ni–Fe–S with magnifications of 1k× and 10k× at 10 s, 0.1 M FeSO4, and (a) 1, (b) 2, (c) 3, (d) 5, and (e) 6 A cm−2. | |
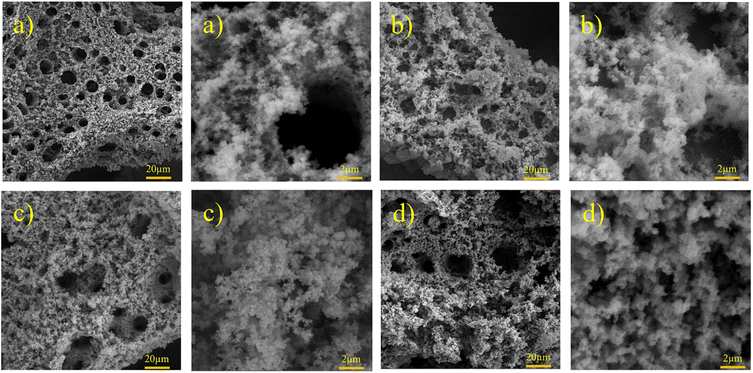 |
| | Fig. 3 FESEM images of Ni–Fe–S with magnifications of 1k× and 10k× at 5 A cm−2, 0.1 M FeSO4, and (a) 3, (b) 5, (c) 10, and (d) 30 s. | |
In the field of electrochemistry, it is generally beneficial to work within the potential range determined using the supporting electrolyte, regardless of whether it is an acid, base, or ionic liquid. The purpose of this is to avoid the degradation of the electrolyte, which could lead to negative consequences during the investigation of electrochemical phenomena or interfere with the formation of films. To ensure stable and uniform film growth, electrodeposition is typically conducted at current densities below half of the limiting current. This precautionary measure helps prevent the formation of unstable structures or protrusions, such as dendrites, which could compromise the quality and integrity of the deposited films.64 In contrast, the DHBT method operates at extreme overpotentials, which intentionally causes the electrolyte, typically an acidic aqueous solution, to undergo breakdown and generate hydrogen bubbles. These hydrogen bubbles play a crucial role in shaping and forming films that possess porous structures and high surface areas. In the DHBT method due to high applied current and voltage, in addition to deposition of ions, co-reduction of hydrogen also occurs and hydrogen gas is produced, as follows in eqn (9) and (10)).
Formed H2 micro-bubbles attach to the surface, coalesce, and act as a dynamic template. Simultaneously, metal ions deposit between the bubbles, and a porous structure forms, as seen in Fig. 1. Over time, as the deposit grows, hydrogen bubbles combine, yielding the formation of larger bubbles at higher layers of the coating.65 As a result, the diameter of the holes increases as we move further away from the substrate surface, resulting in a hierarchical 3D porous structure.66,67 Until they reach the ‘bubble break-off diameter,’ which is a specific size threshold, the hydrogen bubbles formed during the DHBT method continue to grow and evolve within the electrolyte. Once the bubbles reach this critical size, they detach from the electrode surface.67,68 The diameter at which a bubble breaks off is influenced by two factors: the bubble's ability to coalesce or merge with other bubbles and its duration or residence time on the surface of the electrode. The surface energy and morphology of the electrode surface where the reduction process takes place are crucial factors that determine the ability of bubbles to coalesce and the duration of their residence time. The behavior of hydrogen bubbles during electrochemical processes, particularly the kinetics of hydrogen evolution on metal, significantly influences the bubble formation's rate and the diameter at which bubbles break-off. These factors, subsequently, have an effect on the size and morphology of the pores that are formed in the electrode or film. Differences in the exchange current density (J0), which represents the rate of hydrogen evolution per unit area of surface, can result in variations in the size and distribution of pores formed during the electrodeposition process. A higher rate of bubble formation, resulting from a faster hydrogen evolution reaction, causes the residence times of bubbles on the electrode surface to become shorter. This shorter residence time reduces the opportunity for bubbles to coalesce and merge with each other. As a result, smaller bubbles are formed, and these smaller bubble sizes directly correlate with the pore size in the final deposited material.69 In summary, a faster rate of bubble formation leads to smaller break-off diameters, limiting the time available for coalescence and ultimately resulting in smaller pore sizes in the deposited material. The surface properties, including its structure and composition, play a significant role in determining how bubbles interact and detach from the electrode during the electrochemical process. In electrodeposition processes, species naturally move towards the electrode through convection, leading to the creation of a diffusion layer. According to Fick's second law, the thickness of the diffusion layer increases over time in electrodeposition processes. However, stirring the solution can effectively reduce the thickness of the diffusion layer. When a large overpotential is applied, causing the rapid evolution of hydrogen bubbles, an environment of turbulence is created. In this turbulent environment, the solution is effectively stirred, causing the diffusion layer to become compressed.66 In other words, the vigorous formation and movement of hydrogen bubbles act as a stirring mechanism, resulting in the thinning of the diffusion layer. The impact of the rapid evolution of hydrogen bubbles under the hydrodynamic conditions results in a reduction of the diffusion layer due to the turbulent environment. This compression has the ability to overcome kinetic limitations that may arise when depositing multiple metals simultaneously. It forces the deposition of different metals to occur in a regime where diffusion controls the process, where the mass transport of metal ions is the dominant factor governing the deposition process. This diffusion-controlled regime allows for more efficient and controlled deposition of multiple metals during electrodeposition. When an electric current is passed through the substrate electrode, Ni2+ and Fe2+ ions are converted into metallic Ni and Fe, respectively. Additionally, SO42− and S2O32− from NiSO4·6H2O, FeSO4·7H2O, and Na2S2O3·5H2O undergo reduction and get converted into S within the Ni–Fe–S foams. As seen in Fig. 2–4, the diameter of the pores increases with an increasing applied current density, from approximately 1 to 50 μm and this is because higher electrodeposition current densities provide more electrons and make the formation of bubbles easier. Moreover, pore density increases with current density. Furthermore, it is important to mention that when the applied current density reaches 5 A cm−2 or higher, it leads to the formation of nanosheets. The hydrodynamic conditions and overpotential have a significant influence on the nucleation and growth mechanism of the metal during electrodeposition. These factors ultimately determine the fine morphology of the resulting metal film. Nikolic et al. conducted research and found that altering the conditions of electrodeposition has an effect on the morphology and structure of copper deposits.70 They found that dendritic deposits are more likely to form under diffusion-limited conditions. The researchers noted that the morphology of the deposit is notably influenced by the presence of hydrogen evolution, which leads to a reduction in the thickness of the diffusion layer. Formation of nanosheets, in turn, leads to an augmentation of the active surface area. At an applied current density of 6 A cm−2, the nanosheets become thicker and the surface becomes smoother which leads to a decrease in active surface area. Similarly, the pore diameter increases from about 5 to 40 μm with increasing duration time due to the combining of the bubbles and from nearly 5 to 30 μm with an increase in the concentration of FeSO4. Furthermore, it is observed that adding FeSO4 affects the surface roughness. For instance, in Ni–Fe–S 5 A cm−2/10 s/0 M, a smooth surface with small pores is observed, but the diameter of pores and the roughness increase in the presence of FeSO4. However, when a concentration of 0.3 M FeSO4 is used, the number of pores decreases. This is attributed to the inhibitory effect of 0.3 M FeSO4 on the formation of a porous structure, primarily due to the highly active HER. Nonetheless, as the size of the holes and the proportion of pores in the area increase, the active surface area also increases up to a certain threshold. Beyond this threshold, however, the value of the active surface area begins to decline as the diameter of the pores and the proportion of pores in the area continue to increase.71 Furthermore, the application of a current density of 5 A cm−2, a duration time of 10 s, and a FeSO4 concentration of 0.1 M leads to the formation of microspheres. Consequently, Ni–Fe–S 5 A cm−2/10 s/0.1 M exhibits the highest active surface area due to the presence of microspheres (with an average diameter of 1 μm) accompanied by interconnected nanosheets (with an average thickness of 25 nm). In Fig. 5(a), FESEM images of Ni–Fe–S 5 A cm−2/10 s/0.1 M are presented at magnifications of 1k×, 10k×, and 100k×, revealing pores with diameters ranging from 10 to 25 μm. The Ni–Fe–S 5 A cm−2/10 s/0.1 M sample was further characterized using a transmission electron microscope (TEM). The TEM images (Fig. 5(b)) reveal the presence of a microsphere composed of interconnected nanosheets, consistent with the findings from the FESEM images. The EDS result and elemental mapping, demonstrating the uniform distribution of Ni, Fe, and S, are depicted in Fig. 5(c) and S1.† Due to the preferential reduction of Ni over Fe, the coatings may exhibit a core–shell-like structure. EDS analysis for a 3-second duration revealed Ni and Fe at 70.66 and 3.97 wt%, respectively, whereas for a 30-second duration, these values shifted to 63.40 and 21.98 wt%, respectively. Moreover, an increase in the concentration of Fe2+ in the electrodeposition electrolyte led to a higher weight percentage of Fe in the coating. Specifically, the EDS results for Ni–Fe–S 5 A cm−2/10 s/0.1 M indicated Ni, Fe, and S at 55.28, 19.77, and 11.56 wt%, respectively. The loading mass of catalysts was approximately 1.5 mg cm−2, except for varying duration times, which were 1, 1.2, 1.5, and 2 mg cm−2 for 3, 5, 10, and 30 seconds, respectively. The pore diameters for different electrodes are shown in Table S1.†
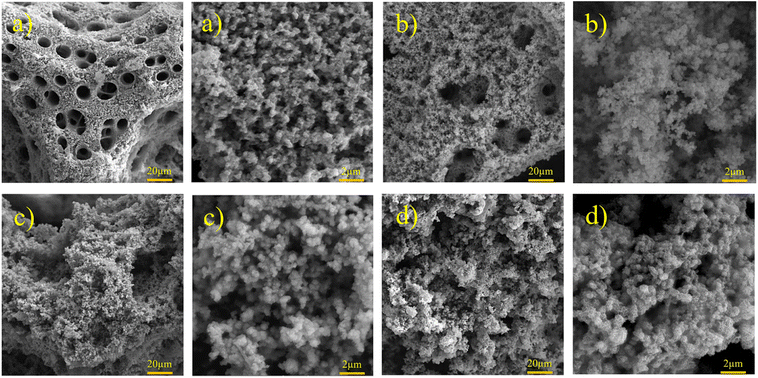 |
| | Fig. 4 FESEM images of Ni–Fe–S with magnifications of 1k× and 10k× at 5 A cm−2, 10 s, and (a) 0, (b) 0.1, (c) 0.2, and (d) 0.3 M FeSO4. | |
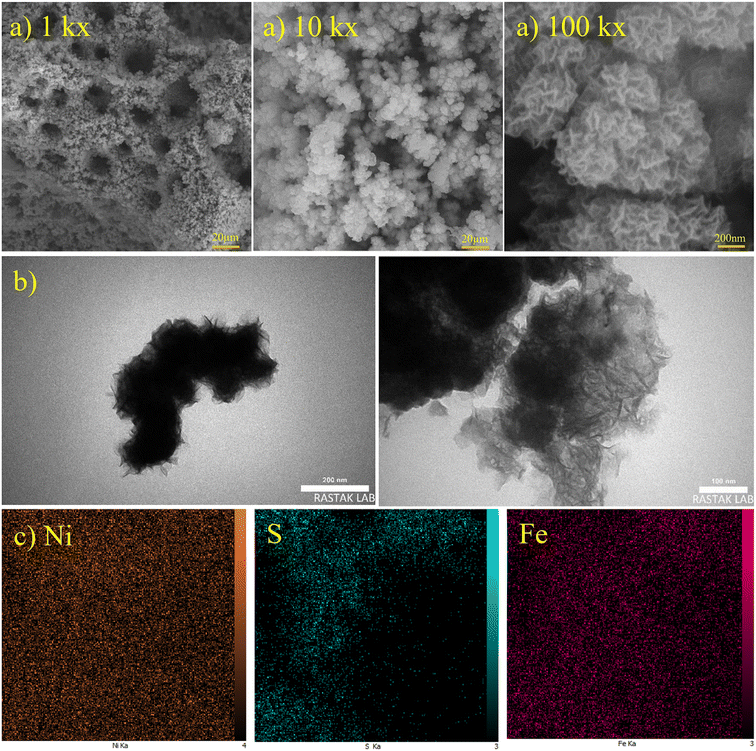 |
| | Fig. 5 (a) FESEM images with magnifications of 1k×, 10k×, and 100k×, (b) TEM images and (c) elemental mapping with magnification of 5k× for optimum Ni–Fe–S 5 A cm−2/10 s/0.1 M. | |
Fig. 6(a) presents the XRD pattern and Fig. 6(b)–(d) present XPS spectra of Ni–Fe–S 5 A cm−2/10 s/0.1 M. The three diffraction peaks are found at 2θ angles of 44.54°, 51.91°, and 76.48°, and they are attributed to the cubic Ni of the substrate (JCPDS 04-0850). Additionally, a broad peak suggests the presence of a dominant amorphous phase. This is likely due to the low temperature and high applied current density, which prevent the atoms from forming a crystalline structure. Several XRD patterns for different electrodes synthesized with varying FeSO4 concentrations are compiled in Fig. S2† to illustrate that there are no significant differences between the electrodes. The XPS test was carried out to analyse the elemental surface composition and chemical states. The surface was found to contain Ni (at approximately 856.15 eV), Fe (at around 713 eV), and S (at approximately 162.4 eV). In the high-resolution spectra of Ni 2p, the peak at 752.95 eV corresponds to metallic Ni 2p3/2. As depicted in Fig. 6(b), the observed peaks at 861.49 and 879.42 eV are associated with the Ni 2p3/2 and Ni 2p1/2 of the Ni2+ state, respectively. Additionally, peaks at 863.53 and 880.86 eV are attributed to Ni3+. Furthermore, two accompanying peaks at around 867.79 and 885.97 eV correspond to their satellites. A slight positive shift in the binding energies of Ni 2p3/2 and Ni 2p1/2, compared to reported Ni–S-based catalysts, suggests that the presence of Fe atoms can significantly alter the electronic structure of Ni sites.72,73 As shown in Fig. 6(c), the peak at 705.87 belongs to metallic Fe. The peaks are located at 710.22 and 723.36 eV corresponding to 2p3/2 and 2p1/2 of Fe2+, respectively. And the peaks at 713.46 and 728.66 eV can be attributed to 2p3/2 and 2p1/2 of Fe3+, respectively. It has been observed that the Fe 2p peaks in our study are located at higher binding energies compared to those reported in some literature studies.74 This small positive shift in the binding energies may be related to the formation of sulfide, confirming the presence of Fe–S.75 Furthermore, two remaining peaks observed at 717.76 and 736.65 eV correspond to the shakeup satellite. The peaks observed at 162.46 and 164.12 eV in Fig. 6(d) correspond to the S 2p orbitals, indicating the presence of typical metal-sulfur bonds in Ni–S and Fe–S. These bonds on metal sulfides, due to their strong covalent properties, are advantageous. The proper adjustment of the energy band levels of the metal's conduction and valence bands during the oxidation and reduction reactions allows for the exposure of numerous active sites for the HER and UOR.76 The broad peaks at 168.07 and 169.89 eV are assigned to S–O, suggesting surface oxidation of metal sulfides in air.77
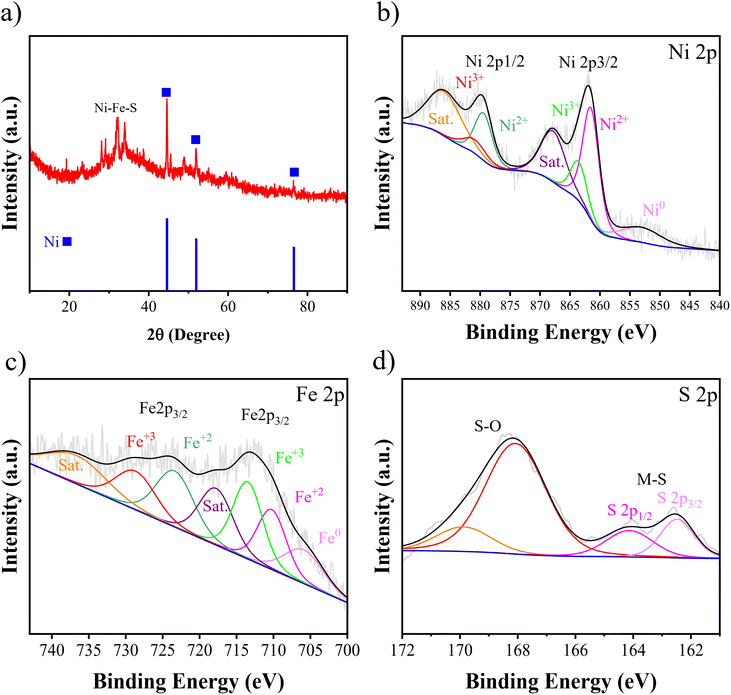 |
| | Fig. 6 (a) XRD pattern and high resolution XPS spectra of (b) Ni, (c) Fe, and (d) S for optimum Ni–Fe–S 5 A cm−2/10 s/0.1 M. | |
Electrochemical performance
The LSV test is an electrochemical technique that involves measuring the current response of an electrochemical system while applying a potential in a linear sweep manner to study the behaviour of the system and understand its electrochemical properties. Therefore, η10 and η100 refer to the overpotential at 10 and 100 mA cm−2 current densities during an electrochemical reaction. The lower these values are, the higher the activity of the electrocatalyst. For assessment of HER performance, Fig. 7 shows LSV curves and Tafel slopes for different electrodes. It has been shown in Fig. 7(a) that increasing the applied current density from 1 to 5 A cm−2 improves the catalytic performance. In other words, η10 decreases from −180 to −85 mV vs. RHE and η100 decreases from −375 to −173 mV vs. RHE. However, further increasing applied current density to 6 A cm−2 results in a decrease in HER performance to −90 and −195 mV vs. RHE for η10 and η100, respectively. Fig. 7(b) shows that increasing the duration time from 3 to 10 s results in an improvement of η10 from −111 to −85 mV vs. RHE and η100 from −245 to −173 mV vs. RHE, but beyond that, at 30 s, it leads to a decrease in performance to −121 and −260 mV vs. RHE for η10 and η100, respectively. Moreover, adding 0.1 M Fe shows an increase in catalytic activity, but afterwards, it causes a decrease in activity, as seen in Fig. 7(c). So that η10 values are −111, −85, −116, and −129 mV vs. RHE and η100 values are −254, −173, −221, and 240 mV vs. RHE at 0, 0.1, 0.2, and 0.3 M FeSO4, respectively. Thereby, Ni–Fe–S 5 A cm−2/10 s/0.1 M demonstrates the best activity with the lowest amounts of η10 and η100 equal to 85 and 173 mV vs. RHE, respectively. Fig. 7(a) also demonstrates LSV curves for the Pt electrode and Ni foam for the sake of comparison. The amounts of η10 and η100 for Ni foam were 261 and 427 mV vs. RHE and for the Pt electrode were 53 and 105 mV vs. RHE respectively. In this regard, several studies have been conducted and the results are revealed in Table S2.† For instance, Yan et al. reported NiFeMoS/NF with an overpotential of 100 mV vs. RHE for the HER in η10.78 In order to elucidate the mechanism and the kinetics of hydrogen generation of the electrodes, Tafel slopes were investigated. A lower Tafel slope indicates superior kinetic activity. Fig. 7(d)–(f) show Tafel slopes for different fabricated electrodes. As shown in Fig. 7(d), Tafel slopes for Ni–Fe–S 5 A cm−2/10 s/0.1 M, Ni foam, and the Pt electrode were 50, 136, and 42 mV dec−1, respectively. Ni–Fe–S 5 A cm−2/10 s/0.1 M reveals the fastest kinetics among the fabricated electrocatalysts. Hence, the synthesized electrode follows the Volmer–Heyrovsky mechanism according to the Tafel slope.79 The first step of this mechanism is the Volmer reaction (eqn (11)), which breaks the O–H bonds in water molecules. As a result, atomic hydrogen becomes adsorbed on the surface of the electrocatalyst. Following that, the Heyrovsky reaction (eqn (12)) proceeds, wherein the adsorbed hydrogen combines with an electron and a water molecule. This results in the formation of H2 bubbles, which separate from the surface.| | | H2O + e− + M → M–H* + OH− | (11) |
| | | H2O + e− + M–H* → M + OH− + H2 | (12) |
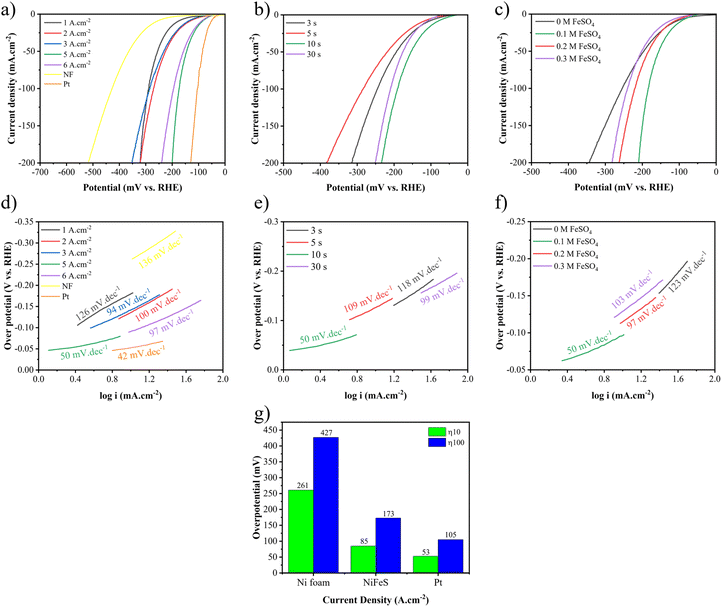 |
| | Fig. 7 LSV curves and Tafel curves for the HER at different (a and d) applied current densities, (b and e) duration times, and (c and f) FeSO4 concentrations, and (g) η10 and η100 of Pt, NF, and optimum Ni–Fe–S. | |
The LSV and Tafel curves for assessing UOR performances are shown in Fig. 8. Similar to the HER, an improvement in catalytic performance for the UOR is observed by increasing the applied current density from 1 to 5 A cm−2, as seen in Fig. 8(b). The required potential for 10 mA cm−2 decreased from 1.367 to 1.267 V vs. RHE and for 100 mA cm−2 decreased from 1.456 to 1.309 V vs. RHE. Fig. 8(c) demonstrates the impact of the duration time. As it increases from 3 to 10, the required potential decreases from 1.344 to 1.267 V vs. RHE at 10 mA cm−2. Increasing the duration time to 30 s increases it to 1.345 V vs. RHE. Increasing the FeSO4 concentration from 0 to 0.1 M enhances the performance from 1.358 to 1.267 V vs. RHE at 10 mA cm−2 and from 1.396 to 1.309 V vs. RHE at 100 mA cm−2. As the FeSO4 concentration increases to 0.2 and 0.3 M, the required voltage increases to 1.357 and 1.366 V vs. RHE at 10 mA cm−2 and to 1.398 and 1.413 V vs. RHE at 100 mA cm−2, respectively.
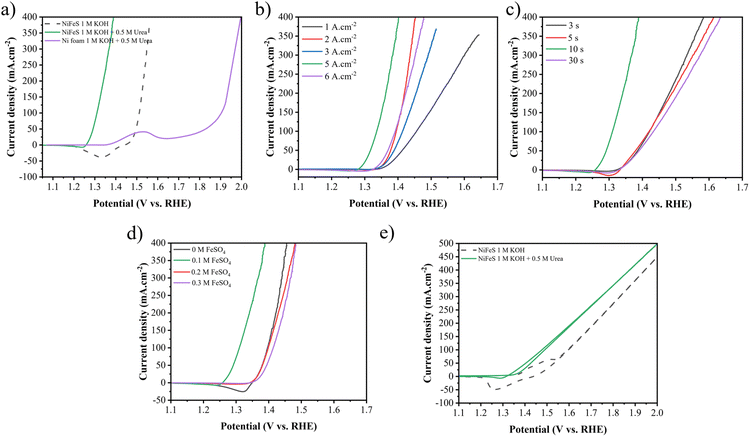 |
| | Fig. 8 (a) LSV curves of NF for the UOR and Ni–Fe–S 5 A cm−2/10 s/0.1 M for the UOR and OER, LSV curves of the synthesized electrodes with different (b) applied current densities, (c) duration times, and (d) FeSO4 concentrations in 1 M KOH + 0.5 M urea electrolyte, and (e) LSV curves of 2 electrode system Ni–Fe–S 5 A cm−2/10 s/0.1 M‖Ni–Fe–S 5 A cm−2/10 s/0.1 M towards overall urea oxidation and water splitting. | |
As a result, Ni–Fe–S 5 A cm−2/10 s/0.1 M shows the best activity with potentials of 1.26 and 1.30 V vs. RHE to reach 10 and 100 mA cm−2 current densities, respectively. Fig. 8(a) exhibits LSV curves of Ni–Fe–S 5 A cm−2/10 s/0.1 M for the UOR and OER and NF for the UOR. It is observed that the synthesized catalyst shows better performance for the UOR in comparison to the OER and it needs lower potential to achieve 10 and 100 mA cm−2 current densities. Fig. 8(e) shows the 2 electrode system of Ni–Fe–S 5 A cm−2/10 s/0.1 M‖Ni–Fe–S 5 A cm−2/10 s/0.1 M for overall urea and water oxidation. As expected, for overall urea oxidation it requires a low cell voltage of 1.337 and 1.477 V for 10 and 100 mA cm−2, respectively, which is 128 and 120 mV lower than the required potential for water oxidation (1.465 and 1.597 V vs. RHE for 10 and 100 mA cm−2). For instance, Diao et al. fabricated NiFe NSs/NF with a cell voltage of 1.40 V vs. RHE in 1 M KOH + 0.33 M urea.80 Tables S2 and S3† provided in the ESI† show a comparison between the literature sources regarding the potentials required for the HER, UOR and overall cell voltage at 10 and 100 mA cm−2 current densities. These tables provide an overview of the potential values reported in different studies, allowing for a comparison of the performance of various catalysts and electrode materials in HER and UOR processes.
As was mentioned before, enhanced electrocatalytic performance could be due to increasing active surface area, which could be obtained from ECSA. To determine the ECSA, cyclic voltammetry tests were performed in different nonfaradic potential regions with different scan rates in 1 M KOH + 0.5 M urea to determine Cdl from eqn (13).81,82
| | | Cdl = (janodic − jcathodic)/v | (13) |
Then, by dividing it by the specific capacitance of an atomically smooth surface (20 μF cm−2), ECSA can be measured. CV curves for different electrodes are shown in Fig. S3–S5.† As shown in Fig. 9(a)–(c), the amount of Cdl increases at 5 A cm−2, 10 s, and 0.1 M FeSO4. Therefore, the values of Cdl and ECSA for Ni–Fe–S 5 A cm−2/10 s/0.1 M were calculated at 11.24 mF cm−2 and 562, as seen in Fig. 9(b). Also, for the sake of comparison, the values of Cdl and ECSA were calculated for Ni foam to be 0.36 mF cm−2 and 18, respectively. These calculations indicate that Ni–Fe–S is approximately 31 times larger than NF, highlighting that significant enhancement in catalytic activity can be attributed to its large electrochemical active surface area.
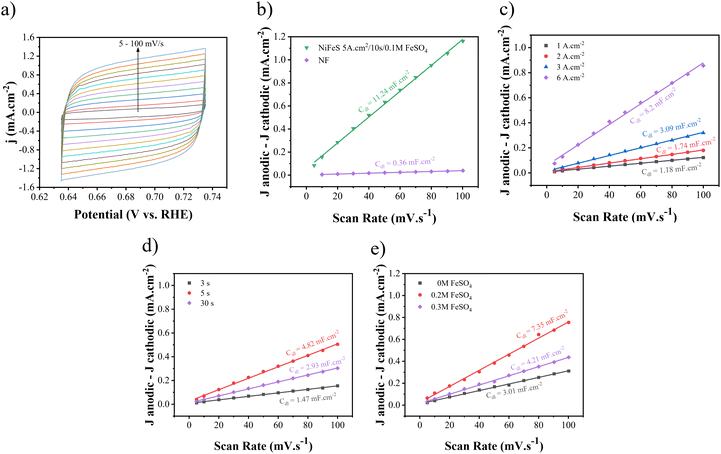 |
| | Fig. 9 (a) CV curves with different scan rates (5–100 mV s−1) and Cdl plots for (b) optimum Ni–Fe–S and NF and Ni–Fe–S synthesized at (c) different electrodeposition current densities, (d) different duration times, and (e) different concentrations of FeSO4. | |
To acquire the charge transfer resistance (Rct), the electrochemical impedance spectroscopy (EIS) technique was employed, utilizing different dynamic potentials during the experiments. Fig. 10 and 11 demonstrate the EIS curve for the HER and UOR, respectively. From a comparative standpoint, curves corresponding to an overpotential of −100 mV for the HER and 1.4 V vs. RHE for the UOR have been depicted, as can be observed in Fig. 10(a)–(c) and Fig. 11(a)–(c) as Nyquist curves and Fig. 10(d)–(f) and Fig. 11(d)–(f) as Bode plots. Fig. 10(g) and 11(g) demonstrate the EIS curves of optimum Ni–Fe–S electrodes at different overpotentials, where increasing potential results in Rct reduction, showing HER and UOR kinetic improvement. In order to analyse the electrochemical data derived from the EIS curves, an equivalent circuit as illustrated in Fig. 10(h) was employed to fit the data. RS represents solution resistance which has already been used for potential correction. Since the same electrolyte (1 M KOH + 0.5 M urea) was used for all samples, the value of RS remains relatively constant. The first constant phase element (CPE1) and R1, observed at higher frequencies, represent the time constant associated with porosities and surface roughness. Alternatively, CPE2 and R2, which are observed at lower frequencies, correspond to the time constant of the charge transfer process occurring at the electrode–electrolyte interface.83 At high frequencies, the semicircles in the circuit do not exhibit any noticeable differences, suggesting that the phase constant at high frequencies is mainly influenced by the surface roughness and porosity. The primary difference in the diameter of the semicircles becomes evident at low frequencies. The charge transfer resistance, represented by the value of R2, decreases as the potential increases. A lower Rct and impedance value implies higher electrode performance. In the first step, when the applied current density is elevated to 5 A cm−2, the Rct decreases from 21.53 to 3.31 Ω cm2. However, as the process continues, the charge transfer resistance starts to increase again, as seen in Fig. 10(a). A similar pattern is noted for the UOR, where the Rct decreases from 12.72 to 2.46 Ω cm2 at an applied current density of 5 A cm−2. In the second step, as the duration time increased, the Rct values were 4.25, 3.93, 3.14, and 6.82 Ω cm2 for the HER and they were 8.82, 2.8, 2.45, and 20.53 Ω cm2 for the UOR at 3, 5, 10, and 30 s, respectively. At last, for different concentrations of FeSO4 at 0, 0.1, 0.2, and 0.3 M the values of the Rct for the HER were 5.32, 3.21, 5.73, and 8.22 Ω cm2 and for the UOR were 4.25, 2.49, 36.84, and 41.87 Ω cm2, respectively. Moreover, it is observed from the Bode plots that there is a similar trend in the amount of impedance for both the HER and UOR. The impedance values obtained for the optimum electrode Ni–Fe–S 5 A cm−2/10 s/0.1 M were 4.61 Ω cm2 for the HER and 2.98 Ω cm2 for the UOR. The results mean that increasing surface area and the presence of Fe and introducing S to form mixed sulfide can increase HER and UOR activities by decreasing the catalyst resistances due to its intrinsic catalytic behaviour.84,85 Therefore, all findings from the EIS align with previously carried out examinations and observations. An essential aspect to highlight in the era of porous electrocatalysts is the utilization of binder materials for creating a coating, which significantly impacts electrical conductivity. In the case of this binder-free approach, the value of charge transfer resistance is relatively minimal.7
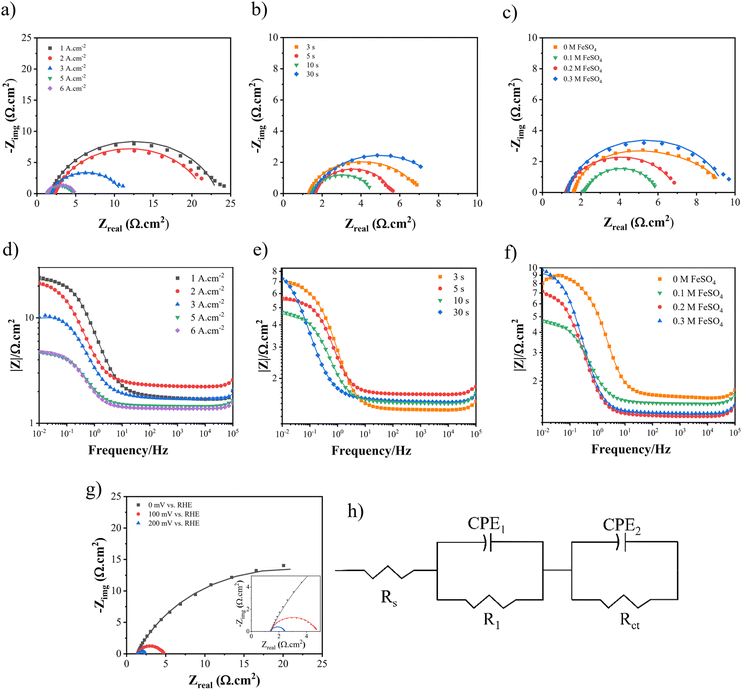 |
| | Fig. 10 The Nyquist curves and Bode plots at an overpotential of −100 mV for electrodes fabricated at different (a and d) electrodeposition current densities, (b and e) duration times, and (c and f) FeSO4 concentrations, (g) Nyquist curves of Ni–Fe–S 5 A cm−2/10 s/0.1 M at different overpotentials, and (h) equivalent circuit. | |
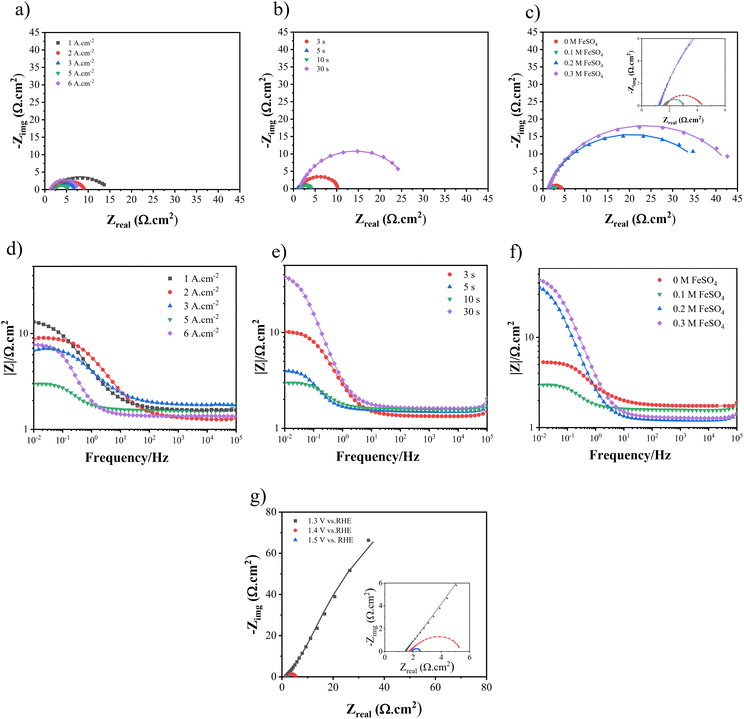 |
| | Fig. 11 The Nyquist curves and Bode plots at an overpotential of 1.4 V for electrodes fabricated at different (a and d) electrodeposition current densities, (b and e) duration times, and (c and f) FeSO4 concentrations, and (g) Nyquist curves for Ni–Fe–S 5 A cm−2/10 s/0.1 M at different overpotentials. | |
Furthermore, a catalyst will demonstrate excellent efficiency in electrolytes that can spread throughout all accessible locations, and the electrochemical reactions will take place across the entire active surface area. In order to conduct a more effective analysis, the wettability of optimum Ni–Fe–S was examined from the perspective of contact angle, as shown in the ESI video.† The fewer contact angles, the more active sites are available. As can be seen, the contact angle is 0° and reveals high wettability and diffusion of electrolyte and superhydrophilicity of the fabricated Ni–Fe–S. This unique feature allows electrolyte to diffuse through the pores and have access to all active sites. Therefore, another contributing factor to the improved catalytic activity of Ni–Fe–S 5 A cm−2/10 s/0.1 M is the superhydrophilicity of its surface.
By combining the results of electrochemical tests, it can be concluded that the increased electrochemical surface area due to the addition of Fe, along with the improved electron and mass transfer observed in various tests such as LSV, Tafel slope, and EIS, results in the exposure of active sites for the HER and UOR. These active sites are mainly composed of exposed Ni and Fe (especially in alkaline electrolytes) on the surface of Ni–Fe–S, and this may be related to their adsorption energy with water at the surface. Adsorption energy is particularly important in alkaline environments due to the absence of H+ ions. As per the literature, Liu et al. developed Fe-doped Ni3S2 and found that in the presence of Fe, the Gibbs free energy for the UOR decreased significantly to 1.06 eV, compared to 2.12 eV for Ni3S2, indicating a substantial improvement in the thermodynamics of the UOR in the presence of Fe.86 Moreover, the addition of Fe was observed to enhance the conductivity, thus acting as active sites. Additionally, the presence of sulfur vacancies within the Ni–Fe–S structure is believed to contribute to the overall catalytic activity and improve the electrode's performance.87,88 Furthermore, Choi et al. reported that for undoped and sulfur-doped NiFe-oxides, the rate-determining step of H2O dissociation showed a lower barrier height of 0.11 eV and 0.17 eV, respectively.89 Therefore, the results indicated that sulfur doping in the electrocatalyst enhanced the intrinsic HER activity by modifying the electronic structure of the electrocatalyst. The introduction of Fe alters the coordination environment of Ni and optimizes the binding strength of UOR intermediates on Ni active sites. The binding energies of Ni 2p3/2 are shifted towards lower binding energies, indicating that Fe could impact the electronic structure. Fe facilitates electron transport and improves the electrical conductivity, thereby enhancing its activity. The electrochemical impedance exhibited a similar trend in the UOR and HER. The circle radii of all Ni–Fe–S samples are lower than those with 0 M FeSO4. It was also observed that the Rct of Ni–Fe–S 5 A cm−2/10 s/0.1 M is smaller than that of Ni–Fe–S 5 A cm−2/10 s/0 M, suggesting that Fe can reduce impedance and improve conductivity, which is beneficial for electron transfer. Lastly, Fe increases the electrochemical active area. The double layer capacitance (Cdl) is increased in the presence of Fe, indicating that Fe results in a larger surface area and more active sites. Feng et al. reported S–FeNi/NF, where the dissociation energy of the water molecule on S–FeNi/NF (−1.87 eV) is much more negative than that on FeNi-LDH/NF (−0.49 eV), indicating that water dissociation is thermodynamically favored after S-treatment for improved HER. In the OER, the potential-limiting step is the conversion of *O to *OOH, accompanied by a large overpotential. However, in the presence of S, the OER proceeds along a new reaction path. According to the literature, S has demonstrated a stable binding site for OH. In the proposed OER mechanism, the second step is the conversion of the *OH group to *O. In the presence of S, adding the second hydroxyl group to the Fe atom can be the thermodynamically preferred reaction path. In the third step, the deprotonation of *O on the Fe atom can occur with a small amount of energy. Subsequently, the formation of high-energy *OOH can be achieved by a thermally activated combination of *O on Fe and *OH on S.90
Durability is a crucial factor in determining catalytic performance, directly impacting the practical applications of electrocatalysts. To evaluate the stability of the synthesized electrocatalyst for the HER and the UOR, chronopotentiometry (CP) tests were conducted at a constant current density of 100 mA cm−2, as depicted in Fig. 12(a) and (b). The CP tests were carried out over a 50-hour period, revealing minimal changes in polarization. Specifically, for the HER, the overpotential shifted from −174 to −192 mV vs. RHE, representing a mere 10% increase, while for the UOR, it changed from 1.30 to 1.32, indicating only a 1.5% increase. Furthermore, to achieve a current density of 100 mA cm−2 in the cell setup, there was a mere 1.5% increase in the required potential. The LSV curves after CP tests demonstrate minor shifts in overpotentials, as depicted in Fig. 12(c) and (d). Additionally, the FESEM images (Fig. 12(e)) after CP tests revealed the preservation of the porous morphology. EDS analysis also indicated the presence of Ni, Fe, and S elements after the CP tests, as shown in Fig. S6.† Overall, it can be concluded that the Ni–Fe–S electrode exhibits excellent durability as a bifunctional electrocatalyst. The synthesis method plays a crucial role in the durability of an electrocatalyst. The use of a binder can lead to surface clogging and reduced adhesion of the coating, potentially compromising durability, especially at high current densities. In the present study, a binder-free electrodeposition approach was employed. Therefore, it can be inferred that the Ni–Fe–S electrode demonstrates remarkable durability when utilized as a bifunctional electrocatalyst.
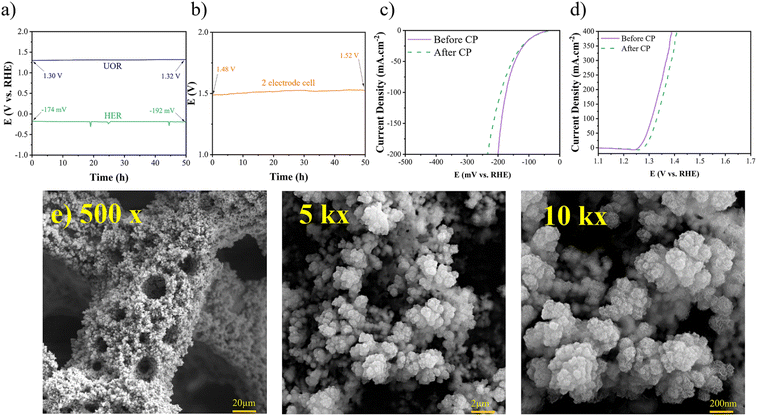 |
| | Fig. 12 (a) CP for the HER, UOR, and (b) 2 electrode system recorded at 100 mA cm−2 for 50 h, LSV curves after CP for (c) HER and (d) UOR, and (e) FESEM images after CP with different magnifications of 500×, 1k×, and 10k×. | |
Conclusions
In summary, this study successfully fabricated porous Ni–Fe–S nanosheets using a one-step electrodeposition technique known as the DHBT method. The optimized parameters, including an applied current density of 5 A cm−2, a duration time of 10 s, and an FeSO4 concentration of 0.1 M, yielded the most superior catalytic performance by placing in contact with active sites on the surface. For the HER, the electrode exhibited overpotentials of 85 and 173 mV vs. RHE at 10 and 100 A cm−2, with a Tafel slope of 50 mV dec−1. The corresponding potentials for the UOR were 1.26 V and 1.30 V vs. RHE. Additionally, within a dual-electrode system, the cell voltage was measured to be 1.33 and 1.47 V at 10 and 100 mA cm−2. The presence of Fe and S played a crucial role in enhancing the catalytic performance in both the HER and UOR. This improvement can be attributed to the chemical interaction and rearrangement of metal–S bonds, with the electronegativity of sulfur playing a decisive role and modification of the electronic structure due to addition of Fe. The prepared electrocatalyst exhibited a large ECSA of 562, along with an increased pore fraction in its electrode structure. Furthermore, the optimized electrode demonstrated exceptional stability during a CP test conducted at 100 mA cm−2 over a 50-hour duration for both the HER and UOR. The electrode showed negligible changes in potential, indicating remarkable stability under these conditions. The outstanding performance of the electrode can be related to its superhydrophilicity and the binder-free synthesis process. It is anticipated that this study will serve as inspiration for the purpose of strategically designing porous structures of bifunctional bimetallic sulfide electrocatalysts that exhibit both high activity and stability.
Author contributions
Amirreza Fathollahi: conceptualization, investigation, data curation, methodology, writing the original draft; Taghi Shahrabi: supervision, funding acquisition, project administration, review and editing; Ghasem Barati Darband: conceptualization, methodology, review and editing.
Conflicts of interest
There are no conflicts to declare.
References
- D. Guan, J. Zhong, H. Xu, Y.-C. Huang, Z. Hu, B. Chen, Y. Zhang, M. Ni, X. Xu, W. Zhou and Z. Shao, Appl. Phys. Rev., 2022, 9, 011422 CAS.
- F. Abdelghafar, X. Xu, S. P. Jiang and Z. Shao, Mater. Rep. Energy, 2022, 2, 100144 CAS.
- K. Hu, S. Jeong, G. Elumalai, S. Kukunuri, J.-i. Fujita and Y. Ito, ACS Appl. Energy Mater., 2020, 3, 7535–7542 CrossRef CAS.
- X. Li, X. Hao, A. Abudula and G. Guan, J. Mater. Chem. A, 2016, 4, 11973–12000 RSC.
- B. Rezaei, A. R. Taghipour Jahromi and A. A. Ensafi, Electrochim. Acta, 2018, 283, 1359–1365 CrossRef CAS.
- Y. Ji, L. Yang, X. Ren, G. Cui, X. Xiong and X. Sun, ACS Sustain. Chem. Eng., 2018, 6, 11186–11189 CrossRef CAS.
- M. Maleki, A. Sabour Rouhaghdam, G. Barati Darband, D. Han, M. Chehelamirani and S. Shanmugam, J. Electroanal. Chem., 2022, 916, 116379 CrossRef CAS.
- D. Zhu, H. Zhang, J. Miao, F. Hu, L. Wang, Y. Tang, M. Qiao and C. Guo, J. Mater. Chem. A, 2022, 10, 3296–3313 RSC.
- R. B. Araujo, D. Martin-Yerga, E. C. dos Santos, A. Cornell and L. G. Pettersson, Electrochim. Acta, 2020, 360, 136954 CrossRef CAS.
- K. Li, Y. Tong, J. He, X.-Y. Liu and P. Chen, Mater. Horiz., 2023, 10, 5277–5287 RSC.
- D. Feng, X. Ren and Y. Tong, Int. J. Hydrogen Energy, 2023, 48, 34244–34254 CrossRef CAS.
- Y. Xu and B. Zhang, ChemElectroChem, 2019, 6, 3214–3226 CrossRef CAS.
- B. Zhu, Z. Liang and R. Zou, Small, 2020, 16, 1906133 CrossRef CAS PubMed.
- C. C. L. McCrory, S. Jung, I. M. Ferrer, S. M. Chatman, J. C. Peters and T. F. Jaramillo, J. Am. Chem. Soc., 2015, 137, 4347–4357 CrossRef CAS PubMed.
- F. Song, L. Bai, A. Moysiadou, S. Lee, C. Hu, L. Liardet and X. Hu, J. Am. Chem. Soc., 2018, 140, 7748–7759 CrossRef CAS PubMed.
- X. Xu, W. Wang, W. Zhou and Z. Shao, Small Methods, 2018, 2, 1800071 CrossRef.
- X.-M. Liu, X. Cui, K. Dastafkan, H.-F. Wang, C. Tang, C. Zhao, A. Chen, C. He, M. Han and Q. Zhang, J. Energy Chem., 2021, 53, 290–302 CrossRef CAS.
- Q. Kang, L. Vernisse, R. C. Remsing, A. C. Thenuwara, S. L. Shumlas, I. G. McKendry, M. L. Klein, E. Borguet, M. J. Zdilla and D. R. Strongin, J. Am. Chem. Soc., 2017, 139, 1863–1870 CrossRef CAS PubMed.
- X. Du, Z. Yang, Y. Li, Y. Gong and M. Zhao, J. Mater. Chem. A, 2018, 6, 6938–6946 RSC.
- M. He, C. Feng, T. Liao, S. Hu, H. Wu and Z. Sun, ACS Appl. Mater. Interfaces, 2020, 12, 2225–2233 CrossRef CAS PubMed.
- O. Diaz-Morales, D. Ferrus-Suspedra and M. T. M. Koper, Chem. Sci., 2016, 7, 2639–2645 RSC.
- D. Chinnadurai, R. Rajendiran and P. Kandasamy, J. Colloid Interface Sci., 2022, 606, 101–112 CrossRef CAS PubMed.
- A. Ray, S. Sultana, L. Paramanik and K. Parida, J. Mater. Chem. A, 2020, 8, 19196–19245 RSC.
- L. Zhu, S. Shan, V. Petkov, W. Hu, A. Kroner, J. Zheng, C. Yu, N. Zhang, Y. Li, R. Luque, C.-J. Zhong, H. Ye, Z. Yang and B. H. Chen, J. Mater. Chem. A, 2017, 5, 7869–7875 RSC.
- M. Yu, G. Moon, E. Bill and H. Tüysüz, ACS Appl. Energy Mater., 2019, 2, 1199–1209 CrossRef CAS.
- D. Feng, X.-Y. Liu, R. Ye, W. Huang and Y. Tong, J. Colloid Interface Sci., 2023, 634, 693–702 CrossRef CAS PubMed.
- Y.-N. Zhou, W.-L. Yu, H.-J. Liu, R.-Y. Fan, G.-Q. Han, B. Dong and Y.-M. Chai, EcoEnergy, 2023, 1, 425–436 CrossRef.
- W.-K. Gao, M. Yang, J.-Q. Chi, X.-Y. Zhang, J.-Y. Xie, B.-Y. Guo, L. Wang, Y.-M. Chai and B. Dong, Sci. China Mater., 2019, 9, 1285–1296 CrossRef.
- X. Zhang, Y. Zhao, Y. Zhao, R. Shi, G. I. Waterhouse and T. Zhang, Adv. Energy Mater., 2019, 9, 1900881 CrossRef.
- E. Hatami, A. Toghraei and G. B. Darband, Int. J. Hydrogen Energy, 2021, 46, 9394–9405 CrossRef CAS.
- J. Xie, F. Wang, Y. Zhou, Y. Dong, Y. Chai and B. Dong, Nano-Micro Lett., 2024, 16, 39 CrossRef CAS PubMed.
- J. Zhang, X. Shang, H. Ren, J. Chi, H. Fu, B. Dong, C. Liu and Y. Chai, Adv. Mater., 2019, 31, 1905107 CrossRef CAS PubMed.
- X.-Y. Zhang, Y.-R. Zhu, Y. Chen, S.-Y. Dou, X.-Y. Chen, B. Dong, B.-Y. Guo, D.-P. Liu, C.-G. Liu and Y.-M. Chai, Chem. Eng. J., 2020, 399, 125831 CrossRef CAS.
- K. Li, G. Zhou, Y. Tong, Y. Ye and P. Chen, ACS Sustain. Chem. Eng., 2023, 11, 14186–14196 CrossRef CAS.
- K. Li, J. He, X. Guan, Y. Tong, Y. Ye, L. Chen and P. Chen, Small, 2023, 19, 2302130 CrossRef CAS PubMed.
- S.-C. Sun, F.-X. Ma, Y. Li, L.-W. Dong, H. Liu, C.-M. Jiang, B. Song, L. Zhen and C.-Y. Xu, Sustain. Energy Fuels, 2020, 4, 3326–3333 RSC.
- M. G. S. da Silva, C. M. Leite, M. A. L. Cordeiro, V. R. Mastelaro and E. R. Leite, ACS Appl. Energy Mater., 2020, 3, 9498–9503 CrossRef CAS.
- Z. Cao, T. Zhou, X. Ma, Y. Shen, Q. Deng, W. Zhang and Y. Zhao, ACS Sustain. Chem. Eng., 2020, 8, 11007–11015 CAS.
- Z. Yin, S. Zhang, J. Li, S. Ma, W. Chen, X. Ma, Y. Zhou, Z. Zhang and X. Wang, New J. Chem., 2021, 45, 12996–13003 RSC.
- R. Li, H. Mao, J. Zhang, T. Huang and A. Yu, J. Power Sources, 2013, 241, 660–667 CrossRef CAS.
- S. Gopi, A. G. Ramu, S. Sakthivel, G. Maia, C.-H. Jang, D. Choi and K. Yun, Chemosphere, 2021, 265, 129052 CrossRef CAS PubMed.
- X. Li, B. Y. Guan, S. Gao and X. W. D. Lou, Energy Environ. Sci., 2019, 12, 648–655 RSC.
- Y. Boyjoo, H. Shi, E. Olsson, Q. Cai, Z. S. Wu, J. Liu and G. Q. Lu, Adv. Energy Mater., 2020, 10, 2000651 CrossRef CAS.
- A. Pavlišič, P. Jovanovič, V. S. Šelih, M. Šala, M. Bele, G. Dražić, I. Arčon, S. Hočevar, A. Kokalj and N. Hodnik, ACS Catal., 2016, 6, 5530–5534 CrossRef.
- H. C. Shin, J. Dong and M. Liu, Adv. Mater., 2003, 15, 1610–1614 CrossRef CAS.
- B. Zhong, P. Kuang, L. Wang and J. Yu, Appl. Catal. B Environ., 2021, 299, 120668 CrossRef CAS.
- J. Wang, H. Shao, S. Ren, A. Hu and M. Li, Appl. Surf. Sci., 2021, 539, 148045 CrossRef CAS.
- M. Hao, V. Charbonneau, N. N. Fomena, J. Gaudet, D. R. Bruce, S. Garbarino, D. A. Harrington and D. Guay, ACS Appl. Energy Mater., 2019, 2, 5734–5743 CrossRef CAS.
- M. Asnavandi, B. H. R. Suryanto, W. Yang, X. Bo and C. Zhao, ACS Sustain. Chem. Eng., 2018, 6, 2866–2871 CrossRef CAS.
- Y. S. Park, W.-S. Choi, M. J. Jang, J. H. Lee, S. Park, H. Jin, M. H. Seo, K.-H. Lee, Y. Yin, Y. Kim, J. Yang and S. M. Choi, ACS Sustain. Chem. Eng., 2019, 7, 10734–10741 CrossRef CAS.
- R. Ojani, E. Hasheminejad and J. B. Raoof, Int. J. Hydrogen Energy, 2014, 39, 8194–8203 CrossRef CAS.
- K. Akbar, J. H. Kim, Z. Lee, M. Kim, Y. Yi and S.-H. Chun, NPG Asia Mater., 2017, 9, e378 CrossRef CAS.
- Y. Li, H. Zhang, M. Jiang, Q. Zhang, P. He and X. Sun, Adv. Funct. Mater., 2017, 27, 1702513 CrossRef.
- Z. Wu, B. Fang, A. Bonakdarpour, A. Sun, D. P. Wilkinson and D. Wang, Appl. Catal. B Environ., 2012, 125, 59–66 CrossRef CAS.
- S. Hyun, B. Son, H. Kim, J. Sanetuntikul and S. Shanmugam, Appl. Catal. B Environ., 2020, 263, 118283 CrossRef CAS.
- H. Zhang, Y. Dong, S. Zhao, G. Wang, P. Jiang, J. Zhong and Y. Zhu, Appl. Catal. B Environ., 2020, 261, 118233 CrossRef CAS.
- W. Li, S. Wang, L. Xin, M. Wu and X. Lou, J. Mater. Chem. A, 2016, 4, 7700–7709 RSC.
- L. Cheng, W. Huang, Q. Gong, C. Liu, Z. Liu, Y. Li and H. Dai, Angew. Chem., Int. Ed., 2014, 53, 7860–7863 CrossRef CAS PubMed.
- J. Hao, W. Yang, Z. Huang and C. Zhang, Adv. Mater. Interfaces, 2016, 3, 1600236 CrossRef.
- X. Zhu, J. Dai, L. Li, D. Zhao, Z. Wu, Z. Tang, L.-J. Ma and S. Chen, Carbon, 2020, 160, 133–144 CrossRef CAS.
- J. Xie, H. Zhang, S. Li, R. Wang, X. Sun, M. Zhou, J. Zhou, X. W. Lou and Y. Xie, Adv. Mater., 2013, 25, 5807–5813 CrossRef CAS PubMed.
- H. Mu, G. Lin, Y. Zhang, Y. Xiao and J. Liu, Colloids Surf., A, 2021, 623, 126734 CrossRef CAS.
- L. Zhu, L. Liu, G. Huang and Q. Zhao, Appl. Surf. Sci., 2020, 504, 144490 CrossRef CAS.
-
Y. D. Gamburg and G. Zangari, Theory and Practice of Metal Electrodeposition, Springer, 2011, pp. 1–24 Search PubMed.
- S. Van Damme, P. Maciel, H. Van Parys, J. Deconinck, A. Hubin and H. Deconinck, Electrochem. Commun., 2010, 12, 664–667 CrossRef CAS.
- B. J. Plowman, L. A. Jones and S. K. Bhargava, Chem. Commun., 2015, 51, 4331–4346 RSC.
- Y. Liu and S. Dillon, Chem. Commun., 2014, 50, 1761–1763 RSC.
- D. Fernandez, P. Maurer, M. Martine, J. Coey and M. E. Möbius, Langmuir, 2014, 30, 13065–13074 CrossRef CAS PubMed.
- Y. Li, W.-Z. Jia, Y.-Y. Song and X.-H. Xia, Chem. Mater., 2007, 19, 5758–5764 CrossRef CAS.
- N. D. Nikolić, K. I. Popov, L. J. Pavlović and M. Pavlović, Surf. Coat. Technol., 2006, 201, 560–566 CrossRef.
- J. Zhang, M. D. Baró, E. Pellicer and J. Sort, Nanoscale, 2014, 6, 12490–12499 RSC.
- B. Fei, C. Ziliang, J. Liu, H. Xu, X. Yan, H. Qing, M. Chen and R. Wu, Adv. Energy Mater., 2020, 10, 2001963 CrossRef CAS.
- R. Wang, J. Liu, J. Xie, Z. Cai, Y. Yu, Z. Zhang, X. Meng, C. Wang, X. Xu and J. Zou, Appl. Catal. B Environ., 2023, 324, 122230 CrossRef CAS.
- C. Qiao, Z. Usman, T. Cao, S. Rafai, Z. Wang, Y. Zhu, C. Cao and J. Zhang, Chem. Eng. J., 2021, 426, 130873 CrossRef CAS.
- J. Nai, Y. Lu, L. Yu, X. Wang and X. W. D. Lou, Adv. Mater., 2017, 29, 1703870 CrossRef PubMed.
- T. Jiang, P. Dai, W. Zhang and M. Wu, Electrochim. Acta, 2021, 373, 137903 CrossRef CAS.
- K. Liu, Z. Zhu, M. Jiang, L. Li, L. Ding, M. Li, D. Sun, G. Yang, G. Fu and Y. Tang, Chemistry, 2022, 28, e202200664 CrossRef CAS PubMed.
- K.-L. Yan, J.-F. Qin, Z.-Z. Liu, B. Dong, J.-Q. Chi, W.-K. Gao, J.-H. Lin, Y.-M. Chai and C.-G. Liu, Chem. Eng. J., 2018, 334, 922–931 CrossRef CAS.
- P. Yu, F. Wang, T. A. Shifa, X. Zhan, X. Lou, F. Xia and J. He, Nano Energy, 2019, 58, 244–276 CrossRef CAS.
- Y. Diao, Y. Liu, G. Hu, Y. Zhao, Y. Qian, H. Wang, Y. Shi and Z. Li, Biosens. Bioelectron., 2022, 211, 114380 CrossRef CAS PubMed.
- Y. S. Park, W.-S. Choi, M. J. Jang, J. H. Lee, S. Park, H. Jin, M. H. Seo, K.-H. Lee, Y. Yin and Y. Kim, ACS Sustain. Chem. Eng., 2019, 7, 10734–10741 CrossRef CAS.
- B. Dong, X. Zhao, G.-Q. Han, X. Li, X. Shang, Y.-R. Liu, W.-H. Hu, Y.-M. Chai, H. Zhao and C.-G. Liu, J. Mater. Chem. A, 2016, 4, 13499–13508 RSC.
- N. Lotfi and G. Barati Darband, J. Electrochem. Soc., 2022, 169, 096508 CrossRef CAS.
-
R. Ahmed and K. Reifsnider, International Conference on Fuel Cell Science, Engineering and Technology, 2010, vol. 44052, pp. 167–175 Search PubMed.
- K. Kant, C. Priest, J. G. Shapter and D. Losic, Electrochim. Acta, 2014, 139, 225–231 CrossRef CAS.
- C. Liu, F. Li, S. Xue, H. Lin, Y. Sun, J. Cao and S. Chen, ACS Appl. Energy Mater., 2021, 5, 1183–1192 CrossRef.
- A. Ma, C. Wang, Y. Lu, X. Wu, B. B. Mamba, A. T. Kuvarega, K. K. Kefeni, J. Gui and D. Liu, ChemElectroChem, 2020, 7, 2199–2204 CrossRef CAS.
- X. Long, G. Li, Z. Wang, H. Zhu, T. Zhang, S. Xiao, W. Guo and S. Yang, J. Am. Chem. Soc., 2015, 137, 11900–11903 CrossRef CAS PubMed.
- J. Choi, A. Nkhama, A. Kumar, S. R. Mishra, F. Perez and R. K. Gupta, Int. J. Hydrogen Energy, 2022, 47, 7511–7521 CrossRef CAS.
- K. Feng, R. Song, J. Xu, Y. Chen, C. Lu, Y. Li, W. Hofer, H. Lin, Z. Kang and J. Zhong, Appl. Catal. B Environ., 2023, 325, 122365 CrossRef CAS.
|
| This journal is © The Royal Society of Chemistry 2024 |
Click here to see how this site uses Cookies. View our privacy policy here.  a,
Taghi
Shahrabi
 *a and
Ghasem Barati
Darband
 *b
*b


