 Open Access Article
Creative Commons Attribution 3.0 Unported Licence
Molecular perspective and engineering of thermal transport and thermoelectricity in polymers
Sai C.
Yelishala
 a,
Connor
Murphy
a and
Longji
Cui
 *abc
*abc
aDepartment of Mechanical Engineering, University of Colorado Boulder, CO 80309, USA. E-mail: longji.cui@colorado.edu
bMaterials Science and Engineering Program, University of Colorado Boulder, CO 80309, USA
cCenter for Experiments on Quantum Materials (CEQM), University of Colorado Boulder, CO 80309, USA
First published on 2nd April 2024
Abstract
Designing polymers with desirable thermal or thermoelectric properties has been a great goal in the field of organic functional materials. This is widely considered challenging because polymers manifest complicated transport characteristics due to their intertwined molecular chains, complex intra- and inter-molecular interactions, and strong heterogeneities in both morphology and pathways of primary energy carriers. These molecular- and nano-scale attributes regulate energy transport and conversion, leading to low bulk-level thermal conductivity and moderate thermoelectric energy conversion performance. Polymers with extreme and controllable thermophysical properties hold the potential to advance many thermal management and renewable energy technologies. The past decade has witnessed significant progress on this topic, owing to the advances in micro-, nano-, and molecular-scale engineering that have created polymers with metal-like thermal conductivity for thermal management technologies and polymers with high charge carrier density for thermoelectric applications. This review focuses on molecular perspective and engineering in two key areas: thermoelectric properties in conducting polymers and thermal transport in polymers with phonons as the dominant energy carrier. The review begins with a theoretical explanation of charge and thermal transport in polymers from a molecular and mesoscale perspective. It reviews thermoelectric polymer synthesis and modification methods for increasing thermoelectric efficiency. The later section of the review surveys molecular engineering efforts in optimizing thermal transport in polymers with phonons as the dominant energy carrier and discusses the interrelated charge and thermal transport in conducting polymers. We also summarize recent efforts to study the dynamic control of thermal and thermoelectric properties of polymers using external stimuli. Finally, we discuss some outstanding challenges and potential future directions.
1. Introduction
Designing polymers with desirable thermoelectric or thermal properties represents a formidable challenge. Addressing it requires a molecular and nanoscale engineering approach that starts from the monomer level,1 as polymers contain amorphous parts that comprise complex molecular chain networks and defects like voids and impurities.2 These molecular- and nano-scale complex attributes fundamentally regulate charge and energy transport and scattering. For instance, macroscopic thermal conductivity (κ) of polymers is observed only in an ultranarrow range3–5 of 0.1 to 1 W m−1 K−1. This strongly contrasts the measured thermal conductivity of inorganic solids that spans over five orders of magnitude. The low thermal conductivity of polymers6 could pave the way for high-performance thermal insulation applications7,8 and enable efficient organic thermoelectric devices for waste heat recovery and renewable power generation.9–11 Conversely, polymers with extreme and controllable energy transport hold a great potential to advance applications such as thermal interface materials, personal thermal management using fabrics12,13 and textiles,14,15 flexible electronics,16–18 photovoltaic cells,19 and energy storage.20Polymer thermoelectric devices deliver inexpensive, readily available, and flexible energy conversion21,22 and heating/cooling systems compared to inorganic devices.23 Organic semiconductors (OSCs) make wearable thermoelectric devices a reality by opening the pathway to use thermal energy from the human body.24–26 Despite recent advancements in molecular engineering studies, there is a significant research gap in measuring thermal transport in polymers with high thermoelectric power factors, which is crucial for evaluating thermoelectric efficiency. This research gap is narrowing due to the recent high-resolution experimental techniques, studying thermal transport27 and thermoelectrics28 in organic systems with atomic and molecular scale resolutions.
This review focuses on molecular perspective and engineering efforts in two primary transport characteristics of polymers. (1) Charge transport in OSCs that affect the thermoelectric properties of the polymer, like electrical conductivity and Seebeck coefficient. (2) Thermal transport in polymers with phonon as the primary energy carrier. A holistic approach covering both charge and thermal transport from molecular and nanoscale perspectives is missing from previous review articles in this field. It is of great interest to construct a complete physical picture regarding the structure–function relationship in the study of thermoelectricity in polymers. The scope of this review entails only intrinsic polymers with micro- and nano-scale or molecular-scale dimensions engineered to tune the transport and interaction properties directly. An alternative strategy to manipulate the thermal properties of polymers is to create composite materials, which integrate polymers with a diverse set of materials such as metals,29 ceramics,30 nanodiamonds,31 and other inorganic constituents. Several thermally conductive fillers32 are also highly electrically conductive, rendering the polymer less suited for scenarios requiring electrical insulation33 and negating a significant advantage over metals. As reviewing composites is beyond the scope of this article, interested readers can refer to in-depth review articles33–41 published in recent years.
The structure of this article is as follows: Section 2 describes the basic theoretical framework and numerical modeling methods to understand charge and phonon transport in polymers. Section 3 describes a spectrum of experimental characterization methods to measure the thermal transport of polymers with nano- and micro-scale dimensions. Section 4 summarizes the molecular engineering methods used to create organic semiconducting polymers and increase the thermoelectric power factor. Section 5 explores the molecular effects and engineering endeavors to tune phonon transport in polymers for desired thermal conductivity. It also discusses the interrelated charge and thermal transport in OSCs. Section 6 delves into dynamically controlled transport characteristics under external stimuli such as light,42 heat, pressure,43 and humidity.44 We provide a summary and outlook for future directions in Section 7.
2. Theory
2.1 Landauer formulation for thermoelectricity and thermal transport at the molecular scale
The basic understanding of thermal transport and thermoelectricity at the molecular scale can be formulated in the framework pioneered by Landauer.45,46 The original picture was based on charge transport in meso- and nano-scale conductors and then generalized to energy transport of phonons and other quasi-particles. Briefly, particles are assumed to be noninteracting within the nanoscale systems and free to propagate before scattering occurs at the lead-conductor interface. Therefore, charge and energy current are proportional to the transmission probability for the particles to transverse the nanoscale structures. Electron transport described by Landauer formulation,45 | (1) |
The thermoelectrical properties of molecular scale devices can also be understood within the Landauer transport picture. The generation of electrical potential (ΔV) across a material when there is a temperature gradient (ΔT) is described by the Seebeck coefficient (also called thermopower), S = −ΔV/ΔT, which can be directly related to the transmission coefficient of the nanoscale conductor by,47,48
 | (2) |
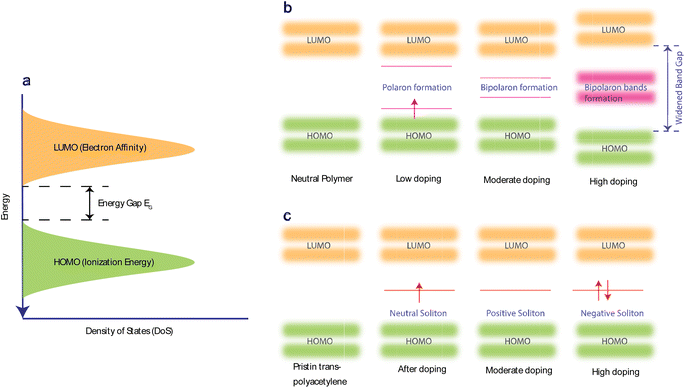
Beyond simple electron transport in conventional metals, in semiconducting thermoelectric polymers, the major charge carriers are the quasi-particles known as polarons,54,55 bipolarons,56 and solitons,57 which are formed by dopants in conjugated polymers. A polaron comprises an electron/hole and an accompanying lattice distortion or polarization. A bipolaron contains two electrons/holes coupled by an attractive interaction behaving as a single entity. A soliton refers to a solitary wave packet that represents a stable, localized charge carrier that forms due to Peierls distortion (i.e., a spontaneous distortion in neutral conjugated polymer, which leads to the formation of alternating single and double bond lengths and breaks the symmetry of the polymer chain). These quasi-particles are found in materials with strong electron–phonon interactions, like organic semiconductors.
Solid-state heat engines can be created using the above thermoelectric effect to convert thermal energy to electrical energy through the Seebeck effect. In thermoelectric devices/materials, the energy conversion performance is determined by ZT, a nondimensional number quantifying the figure of merit of the system of interest and defined as,
 | (3) |
 is given by,59
 | (4) |
Optimizing a thermoelectric material requires decreasing the thermal conductivity to make a “phonon” glass and simultaneously increasing the power factor to obtain an “electronic” crystal. From eqn (3), a high-performing thermoelectric material will have high electrical conductivity, high Seebeck coefficient, and low thermal conductivity, which can be demonstrated by semiconducting polymers.60 Polymers are inherently bad thermal conductors; therefore, research to increase ZT is usually carried out by improving the power factor. Eqn (4) illustrates that power generation efficiency is directly related to Carnot efficiency, which depends on the temperature differential. Due to their lower melting points and susceptibility to photo-induced oxidation and degradation, polymers, unlike inorganic materials, are limited by smaller temperature differences and lower working temperatures for power generation.
The electrical and thermal conductance are partially coupled by Wiedemann–Franz (WF) law61 through the electronic contribution to thermal transport. For inorganic materials, the WF law is given by,
 | (5) |
 For organic materials the expectation of having a constant Lorenz number like inorganic materials (Sommerfield value) is invalid and is further discussed in Section 5.8.
In a molecular scale system, the Landauer formulation62–64 can be used to calculate the contribution to thermal transport from both electrons (Qel) and phonons (Qph) between a hot (Th) and cold (Tc) reservoirs,65
 | (6) |
 | (7) |
 | (8) |
The phononic thermal conductance quantum was first measured in electrically insulating silicon nitride nanostructures with a thermal conductance of 16G0,th at temperatures below 0.6 K.68 The electronic contribution to thermal conductance is quantized for electrical conductors due to quantized electrical transport, measured at both cryogenic (∼20 mK)69 and room temperature (∼300 K).70,71
2.2 Thermal transport in mesoscopic polymer systems
While the macroscopic thermal transport in polymers can be well approximated using the conventional Fourier law of heat conduction, it encounters limitations when the classical law is applied in systems with spatial heterogeneity in structure and temperature at the scales comparable to the mean free path of basic energy carriers.72,73 In electrically insulating polymers, thermal properties are dominated by phonon transport and interactions. Thermal conductivity is determined by considering the intricate dynamics of phonon-scattering mechanisms, including phonon–phonon interactions (Umklapp scattering and normal scattering), boundary scattering, and impurity scattering. Researchers often employ kinetic theory that uses a particle analogy to study thermal transport at the mesoscopic or above. It should be noted that the validity of this particle picture diminishes when effects such as interference, diffraction, and tunneling gain significance. In contrast to the Landauer transport theory above, which distinguishes the quantum properties of different energy carriers, the kinetic theory applies a universal approximation that works for all energy carriers. The thermal conductivity (κ) under summation of all phonon modes is expressed as,74 | (9) |
The mean free path of the dominant phonon decreases with temperature, increasing the chance of scattering in an anharmonic lattice.75 The phonon mean free path for normal processes are given as follows,76–78
 | (10) |
 | (11) |
 | (12) |
 is the average mass of backbone atoms.
The specific heat of phonons is also closely related to ΘD. Under the assumption of a linear dispersion relation, the specific heat for acoustic phonons is given by,64
 | (13) |
 | (14) |
2.3 Simulation methods
The above theories provide the basic framework for understanding thermal transport and thermoelectric properties in polymers. Quantitative details of typically complex polymer molecular systems require simulation and modeling methods. Here, we will describe three methods for predicting thermal transport and thermoelectric properties in polymers with geometrical and material constraints. | (15) |
| τ(ω) = trace[ΓLGRΓRGA] | (16) |
3. Experimental methods for measuring thermal conductivity in nanoscale/microscale systems
The past decade has witnessed remarkable progress in understanding and controlling the thermal properties of polymers at the micro- and nano-scale.93 Mainly, advances in micro- and nano-engineering have created polymers with metal-like high thermal conductivity,94 as high as ∼100 W m−1 K−1. Quantifying the thermal conductivity of polymers demands careful control of experimental variables, notably convection and radiation effects, which may otherwise dominate measurements at small scales. For this reason, experiments are conducted in high vacuum conditions and are shielded from potential radiation heat transfer. Various approaches have been developed to assess thermal conductivity in polymer materials, each with limitations and constraints. They are typically classified into optical and electrical resistive methods, where the former reads surface emission or reflection, and the latter uses a temperature-sensitive resistor to measure the heat flow through the polymer. Below, these methodologies are explored in detail, and their key attributes and comparisons are summarized in Table 1. As reviewing bulk scale methods to measure the thermal conductivity of thermoelectric materials is out of the scope of the article, the readers are referred to comprehensive reviews.95,96 Experimental thermal conductivity values for different polymers, limited to microfibers, nanofibers, and thin films, are tabulated in Table 2.| Experiment method | Minimum scale (μm) | Advantages | Limitations | Sample type | Ref. |
|---|---|---|---|---|---|
| Thermal bridge | 0.01 | Direct measurement | Contact resistance and complex manipulation to install samples | Fiber | 97 |
| SThM | Nano-to-atomic scale | Direct characterization of heterogeneous sample and thermal mapping | Complex microfabrication of scanning thermal probes | Fiber or single chain | 70 |
| TDTR | 10 | Mean free path estimation | Indirect measurement, need transducer coating | Fiber and films | 98 |
| Cantilever deflection | 0.01 | Micro/nano-scale, and one stop method with drawing and measurement | Laser induced deflection on cantilever, indirect measurement | Fiber | 98 |
| TTG | 0.1 | No transducer layer | Sample thickness limitation | Films | 99 |
| LFA | 30 | Non-contact and fast | Need emissive coating, indirect measurement | Fiber and films | 100 |
| 3ω method | 0.1 | Direct measurement | Film thickness limitation | Films | 101 |
| Steady-state infrared thermography | 0.1 | Direct measurement and non-contact | Sample emissivity limitation | Films | 102 |
| Polymer | Molecular structure | Size (μm)-sample type | Method | κ (W m−1 K−1) | Fabrication technique | Ref. |
|---|---|---|---|---|---|---|
| PT |

|
0.071 fiber | Thermal bridge | 4.4 | Template | 109 |
| Zylon |

|
10 fiber | Thermal bridge | 60 | — | 110 |
| 10–30 fiber | TDTR | 23 | Epoxy block | 111 | ||
| 10–30 fiber | TDTR | 19 | Epoxy block | 111 | ||
| 16 film | LFA | 36.7 | Building blocks | 112 | ||
| PE |

|
12 fiber | Thermal bridge | 50 | — | 110 |
| NA fiber | Thermal bridge | 90 | Transient heat stretch | 94 | ||
| NA fiber | Thermal bridge | 100 | Gel drawing | 98 | ||
| NA fiber | Thermal bridge | 8 | Electro spinning | 113 | ||
| NA film | TTG | 40 | Rolling and stretching | 114 | ||
| 0.1 fiber array | LFA | 20 | Nano porous template | 100 | ||
| 4 tape | Pulsed photothermal | 30 | Tensile drawing | 115 | ||
| 6 single crystal | Pulsed photothermal | 40 | Tensile drawing | 115 | ||
| Mat | LFA | 18.4 | Hot rolling | 116 | ||
| 30 tape/film | Thermal bridge | 1.8 | Electrospinning | 117 | ||
| Fiber | Steady state system | 62 | Extrude and roll–roll | 118 | ||
| 150 film | LFA | 38 | Gel spun | 119 | ||
| NA fiber | Hot disk | 10.7 | Solution gel sheared | 120 | ||
| NA film | Photoacoustic | 7 | Nanofibrous template | 121 | ||
| 0.2 fiber | Photoacoustic | 3 | Nanofibrous template | 121 | ||
| 0.2 fiber | TDTR | 17 | Epoxy block | 111 | ||
| 10–30 fiber | TDTR | 12 | Epoxy block | 111 | ||
| TDTR | 15 | Epoxy block | 111 | |||
| Polysilsesquioxane-C6 |

|
2 rod | Thermal bridge | 0.4 | Synthesis | 122 |
| Polysilsesquioxane-C8 |

|
2 rod | Thermal bridge | 0.5 | Synthesis | 122 |
| Kevlar |

|
10–30 fiber | TDTR | 3.5 | Epoxy block | 122 |
| Vectra |

|
10–30 fiber | TDTR | 1.75 | Epoxy block | 122 |
| M5AS |

|
10–30 fiber | TDTR | 9 | Epoxy block | 122 |
| PBT |

|
10–30 fiber | TDTR | 12 | Epoxy block | 122 |
| PI |

|
0.037 fiber | Thermal bridge | 3 | Electrospinning | 123 |
| 23 fiber | Transient electro | 2 | Spinning and hot draw | 124 | ||
| 2.25 film | 3-Omega | 0.1–1 | — | 125 | ||
| 15 mat/film | Thermal bridge | 1 | Electro spinning and hot pressing | 126 | ||
| Azo-benzene |
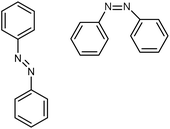
|
0.28 film | TDTR | Trans: 0.35 | Spin coating | 42 |
| Cis: 0.1 | ||||||
| PAC |

|
10 film | 3-Omega | 1.2 | Spin coating | 127 |
| P3HT |

|
0.16 film | TDTR | 2.2 | oCVD | 128 |
| 0.1 fiber | Photoacoustic | 7 | Nanofibrous template | 121 | ||
| Nylon-11 |
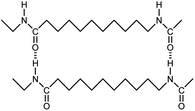
|
0.07 fiber | Thermal bridge | 1.6 | Electrospinning | 129 |
| Poly(3-methylthiophene) |

|
0.04 film | TDTR | 2 | Surface-initiated polymerization | 130 |
| PS |

|
0.12 fiber | Cantilever deflection | 14.4 | Electrospinning | 131 |
| PVDF |

|
0.072 fiber | Thermal bridge | 0.9 | Electrospinning | 117 |
| PVA |

|
0.061 fiber | Thermal bridge | 1.7 | Electrospinning | 117 |
| PVC |

|
0.054 fiber | Thermal bridge | 0.5 | Electrospinning | 117 |
| Cellulose |

|
6 fiber | Thermal bridge | 14.5 | Hydrodynamic focusing | 132 |
3.1 Thermal bridge
This method employs one or two suspended islands, each less than 100 μm in size, that are embedded with a calorimeter to record temperature changes on the islands. The suspension of the islands ensures high thermal resistance relative to the surrounding heat sink, thereby enhancing the calorimeter's sensitivity to detect small heat fluxes.97 A micro/nanoscale polymer fiber or film bridges the two islands maintained at different temperatures (ΔT). This temperature difference drives a heat flow (q) from the hot to the cold side through the polymer, measurable via a small temperature change on the island (Fig. 1(b)(ii)). Subsequently, the thermal conductance of the polymer is determined by Gth = q/ΔT, which is then used to calculate the thermal conductivity based on the measured geometry dimensions of the polymer material.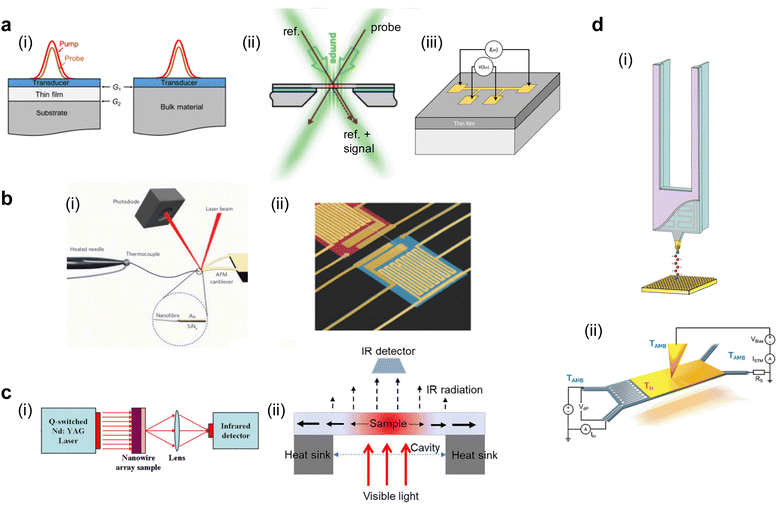 | ||
| Fig. 1 Schematic of different experimental methods for thermal conductance measurements (a) Thin film measurement methods: (i) Time Domain Thermal Reflectance (TDTR). Reproduced with permission.42 Copyright, 2018, American Institute of Physics – JAP. (ii) Transient Thermal Grating (TTG). Reproduced with permission.99 Copyright, 2013, American Physical Society – PRL. (iii) 3-Omega method. Reproduced with permission.105 Copyright, 2021, Nature Materials. (b) Microfiber and nanofiber measurement methods: (i) bi-material cantilever. Reproduced with permission98 Copyright, 2010, Nature Nanotechnology. (ii) Thermal bridge. Reproduced with permission.106 Copyright, 2019, Science Advances. (c) Bulk scale measurements: (i) Laser Flash Analysis (LFA). Reproduced with permission100 Copyright, 2011, Polymer. (ii) Steady-state-infrared-thermography. Reproduced with permission102 Copyright, 2017, American Institute of Physics – RSI. (d) Nanofiber and molecular level measurement methods: (i) Scanning Thermal Microscopy (SThM) with a resistor on a probe. Reproduced with permission27 Copyright, 2019, Nature. (ii) Scanning Thermal Microscopy (SThM) with a resistor on the sample. Reproduced with permission71 Copyright, 2017, Nature Nanotechnology. | ||
3.2 Bi-material cantilever
This technique utilizes a cantilever like those used in laser-based atomic force microscopy (AFM). However, it is constructed from two distinct materials, each with a different coefficient of thermal expansion (CTE). This bi-material cantilever, characterized by its low stiffness, exhibits deflection when the temperature on the cantilever changes due to the differential expansion rates of the materials.103,104 In an experiment, a polymer fiber is placed between the terminal point of the cantilever and a hot thermal reservoir, as illustrated in Fig. 1(b)(ii). The heat flowing to the cantilever through the fiber causes a temperature-induced deflection, which is quantitatively measured using a laser and a photodetector in AFM. This deflection is converted into a temperature increase on the cantilever through calibration measurements. Like the thermal bridge technique, this temperature increase can be converted into the thermal conductivity of the polymer fiber using Fourier's law. Shen et al.98 have employed the bi-material cantilever method to measure the thermal conductivity of polyethylene nanofibers, thus validating its applicability for assessing the thermal characteristics of polymeric materials.3.3 Time domain thermal reflectance (TDTR)
TDTR is a non-contact, optical method used to measure the thermal properties of thin materials,42 particularly thermal diffusivity and thermal conductivity. It uses a dual-laser system consisting of a pump laser and a probe laser (Fig. 1(a)(i)) spit from the same laser source but with slightly different arrival times to the sample surface. The pump laser heats the sample periodically, while the probe laser measures the resulting change in the sample's reflectance due to this heating.107 To overcome the low reflectivity of polymers and enhance the accuracy of measurements, the sample is coated with a transducer film, typically made of aluminum, known for its temperature-dependent reflectance properties. The probe laser's reflection is measured at a high frequency (femtosecond to picosecond scales), capturing how the sample's temperature changes in response to the pump laser heating. This time-resolved measurement allows for calculating the sample's thermal properties by analyzing the heat flow away from the surface over time. This analysis involves fitting the data to a thermal model that accounts for the sample's interfacial contact thermal resistance from the multi-layer structure.3.4 Laser flash analysis (LFA)
LFA operates on the principle of transient heat propagation through a material sample.108 In this method, a brief laser pulse is applied to the center or the extreme end of the sample, initiating a heat wave that traverses the material (Fig. 1(c)(i)). The time elapsed for the heat wave to reach the ends of the sample is recorded. Using a heat diffusion equation, this temporal data is subsequently employed to calculate the material's thermal conductivity. An added layer of complexity can be introduced by subjecting the sample to varying temperatures in a furnace; this allows for examining the temperature dependence of the material's thermal conductivity.3.5 Three-omega method (3ω)
The 3ω method101 utilizes a thin metallic strip, often made of platinum or another metal, which simultaneously acts as a heater and a resistive temperature sensor (Fig. 1(a)(iii)). This strip is deposited on the material's surface, whose thermal conductivity will be measured. An alternating current (Iω) with angular frequency ω passes through the metallic strip, inducing Joule heating and creating a temperature oscillation in the material at 2ω with an amplitude of ΔT2ω. This oscillation changes the metallic strip's resistance according to its temperature coefficient of resistance (α) at 2ω. Due to the nonlinear relationship between temperature and resistance, a third harmonic (3ω) component is generated in the voltage across the strip, V3ω = ΔT2ωαIωR/2. Upon measuring V3ω, ΔT2ω can be calculated, which then allows for the estimation of the thermal conductance of the material beneath the metallic strip by establishing a linear relationship between ΔT2ω and the input power. Calibration measurements conducted without the polymer material allow for the estimation of the cross-plane thermal conductance of the polymer.The 3ω method circumvents the limitations inherent to direct current (DC) techniques, particularly the radiative heat loss from the sample, which often leads to imprecise or skewed measurements.105 A high-frequency operation intrinsic to the 3ω method effectively minimizes heat loss attributed to radiation. Operating in an alternating current (AC) regime significantly reduces shot noise and other instrumental noises compared to DC methods. This noise reduction enables the reliable measurement of materials with extremely low thermal conductivity, making the 3ω method especially valuable for accurately characterizing materials that are challenging to assess using DC techniques.
3.6 Steady-state infrared thermography
This method employs a setup incorporating a thin film placed over a hole in an opaque substrate. The role of the substrate is dual: it functions as a heat sink for thermal dissipation and, owing to its opacity, prevents light from reaching the peripheral edges of the thin film. Illumination is provided from below by visible light, which raises the temperature of the film (Fig. 1(c)(ii)). The heat generated in the film is conducted away through the substrate and the hole, thus establishing a steady-state temperature gradient across the film.102 The feature of this technique is the utilization of an infrared detector to capture the temperature distribution across the film. The recorded data is then fitted to a theoretical temperature distribution model specific to the hole's geometry. Through this fit, the in-plane thermal conductivity of the thin film is ascertained.3.7 Transient thermal grating (TTG)
TTG evaluates thermal conductivity utilizing the constructive interference of two crossed laser beams to generate a sinusoidal thermal grating on the sample's surface. Another probe laser beam is then incident on this thermal grating and undergoes diffraction. The diffracted light pattern is then analyzed to deduce the thermal conductivity of the material99 (Fig. 1(a)(ii)). One of the distinguishing attributes of TTG is its high sensitivity to in-plane thermal conductivity, negating the need for transducer deposition on the sample surface like TDTR. Moreover, the method offers insight into the material's phonon mean free paths (MFP). Specifically, when the heater's dimensions—the laser beam diameter, thermal penetration depth, or grating spacing—are on the same order of magnitude as the MFPs of the phonons. The measured thermal conductivity is observed to be reduced due to the enhanced phonon scattering that occurs even in the absence of physical boundaries. This property has been leveraged to derive the accumulative thermal conductivity over the mean free path spectrum. By doing so, TTG allows for the spectral probing of non-diffusive phonon transport phenomena, thereby facilitating the validation of first-principles and nanoscale simulations of thermal transport properties.1143.8 Scanning thermal microscopy (SThM)
SThM133 is a scanning probe-based technique for measuring the thermal conductance of materials with ultrahigh spatial resolution, down the level of single atoms and molecules. Central to the technique is a thermal probe fabricated using state-of-the-art nanofabrication methods (Fig. 1(d)). This thermal probe is integrated into a scanning tunneling microscope (STM)70,71 or AFM.134 The integration allows for a non-thermal signal feedback mechanism, enhancing the method's versatility and applicability. A scanning thermal probe can be nanofabricated using MEMS techniques and then be used to scan the surface of a material to obtain its temperature profile with nanometer scale features.135,136 Other thermophysical properties obtained using SThM include thermal conductivity, thermal expansion coefficient, thermal contact resistance, and heat capacity. In conjunction with electrical or even magnetic field measurements, SThM can create multi-modal scanning probe platforms to evaluate dissipation and energy conversion properties in various materials. Specifically for molecular chain measurement, an STM beak junction (STMBJ) technique is developed,137 creating a bonded molecular junction between the scanning probe tip and the sample. The probe is retracted until the junction breaks, and a thermal signal change before and after the junction's breaking indicates the individual molecule's thermal conductance. The STMBJ technique is particularly useful for studies focused on fundamental phonon and charge transport in molecular systems, and it offers the precision required to validate quantum-level thermal and thermoelectrical transport theories and simulations.4. Thermoelectricity in semiconducting polymers
Intrinsically synthesized polymers become electrically semi-conductive only when they possess conjugated chemical backbones and delocalized π-electrons.138 Further, most polymers have a wide bandgap, and their electrical transport properties must be tuned via doping, ionic polymerization, and chain alignment to create organic semiconductors (OSCs).139 These techniques also correspondingly affect the thermal transport in polymers, which for semiconducting polymers are attributed to more complicated charge and phonon transport effects than the thermal transport characteristics in phonon-dominated polymers. This section discusses creating OSCs through doping and then delves into optimizing doping concentration through de-doping methods. Synthesis methods like blending polymers, non-solution-based polymerization techniques, and chain alignment are discussed. The later part of the section discussed molecular engineering methods to modify the backbone, side chain, molecular weight, crystallinity, and morphology.4.1 Doping
Doping allows the electrons in the polymer's π-bonds to move around the polymer chain, increasing their transport mobility (μ). It also introduces geometric distortion,57 which creates non-neutral polarons, bipolarons, and solitons as charge carriers. Doping enhances coulombic interactions and the coupling of polarons in transition states. Such interactions can alter the material's local state and shift energy levels. Consequently, these changes can significantly enhance the thermoelectric properties of the material. Doping can be n-type (reduction) or p-type (oxidation).The selection of dopant is dependent on the HOMO (highest occupied molecular orbital) and LUMO (lowest unoccupied molecular orbital) energy levels of the conjugated polymer (Fig. 2(a)). A polymer with a high HOMO level will more readily give up electrons and become oxidized. Hence, p-dopants are used to accept electrons and form positive polarons. In n-doping, the polymers with lower LUMO levels are used as they can more readily accept electrons and form negative polarons.9Fig. 2(b) illustrates how polaron, bipolaron, and bipolaron bands develop relative to the doping level in various OSCs. Initially, at low doping levels, polarons with spin-1/2 are generated. As doping increases, these polarons combine to form spinless bipolarons.
Further doping causes these bipolaron levels to overlap, eventually leading to the formation of continuous bands.138,140 The band gap between the conduction and valence bands widens as states at the edges of these bands evolve to form the bipolaron bands/states. However, at very high doping levels in many OSCs, the upper and lower bipolaron bands converge with the conduction and valence bands, resulting in partially filled bands akin to those in metals. If the two charges comprising a bipolaron are loosely bound and can easily separate due to the degenerate state of the OSC. The energy between these two charges on either side of them is identical, causing them to behave like a solitary wave that propagates without distortion or energy loss.141 Precisely, in pristine trans-PAc, a soliton is termed neutral if an odd number of conjugated carbons leads to an unpaired electron. Adding another unpaired electron transforms it into a negatively charged soliton, while its removal results in a positive soliton. This process generates new localized states within the middle of the energy gap (Fig. 2(c)), which are half-filled in the case of a neutral soliton and either empty or fully filled for a positive or negative soliton, respectively. As doping levels rise, these charged solitons interact, forming a soliton band. This band can eventually merge with the edges of the valence/conduction band, leading to metallic conductivity.142
Doping can be achieved by two primary methods:143 acid–base doping, which is by introducing a cation or anion to the polymer backbone, and charge neutrality is preserved through the accompaniment of a counterion (Fig. 3). The other method is redox doping, which entails the transfer of electrons, forming a donor–acceptor charge-transfer complex or ion pair. The proton (H+) is added to the polymer backbone in acid doping, like polyaniline with camphor sulfonic acid (CSA)144 or with hydrochloric acid (HCl) and acetic acid,145 polythiophenes with ethylbenzene sulfonic acid (EBSA).146 The hydride (H−) is added to the polymer backbone in base doping, like napthalenedicarboximide-bithiophene copolymer P(NDIOD-T2)147 and benzodifurandione-based poly(p-phenylene vinylene) derivatives (BDPPV)148 with benzimidazole derivatives. Redox doping needs a slight offset in HOMO and LUMO levels, as discussed previously, to form polarons. The HOMO and LUMO levels are sensitive to the conditions of polymer synthesis, but the energy levels for dopants are constant. A widely studied p-type conjugated polymer is poly(3,4-ethylenedioxythiophene) (PEDOT)149 as it can allow readily solution processing. Further, p-type polymers are preferred to n-type polymers as they are more oxidation resistant and chemically stable.150
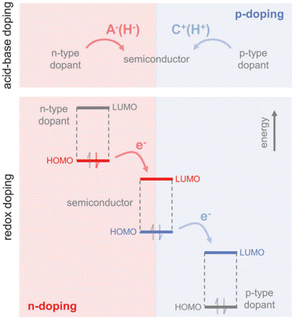 | ||
| Fig. 3 Mechanisms for n-type and p-type doping: the top panel is acid–base doping showing anion (H−) or cation (H+) addition to the polymer backbone. The bottom panel is redox doping, showing the transfer of electrons to the LUMO level or the transfer of electrons from the HOMO level of the polymer. Reproduced with permission.143 Copyright, 2017, Wiley – Advanced Materials. | ||
The homogeneity151 and concentration of the dopant152 are two critical factors influencing the thermoelectric properties of OSCs. An increase in dopant concentration increases the charge carrier's density, increasing electrical conductivity but decreasing the Seebeck coefficient (Fig. 4(a)). Glaudell et al.153 found an empirical relationship between the Seebeck Coefficient and electrical conductivity for different doping concentrations from several experimental studies of polythiophenes as  . Controlling doping concentration to get the highest power factor during doping has been proven difficult owing to the long chain length of the dopant.154 Several methods have been developed to optimize and get the maximum power factor at a desired dopant concentration (as described below). However, it should be noted that most of these studies measured electrical conductivity and not the Seebeck coefficient, and rarely, thermal conductivity gives an incomplete picture of ZT of thermoelectric material.
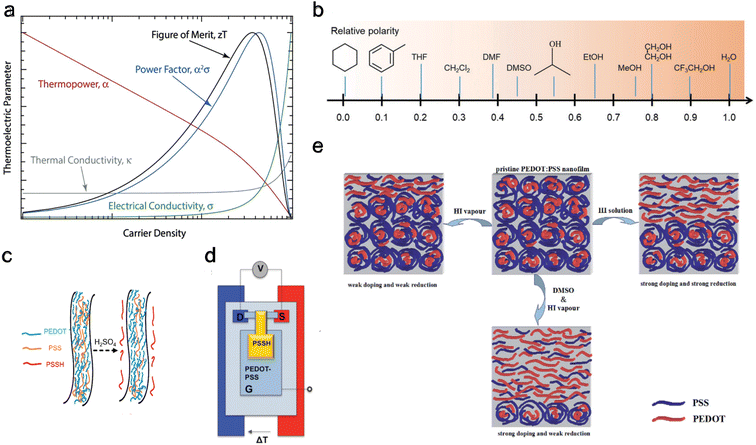 | ||
| Fig. 4 De-doping mechanisms (a) schematic showing carrier density dependence for different thermoelectric properties, including electrical conductivity and thermopower. Reproduced with permission.160 Copyright, 2018, Wiley – Advanced Materials. (b) Typical solvents used for solvent de-doping and their relative polarity to water. Reproduced with permission.161 Copyright, 2022, Royal Society Chemistry – CSR. (c) Schematic illustration showing the removal of PSS from PEDOT:PSS polymer using sulfuric acid to reduce the oxidation level. Reproduced with permission.162 Copyright, 2020, Nano Energy. (d) Schematic of the thermoelectric characterization electrochemical setup with PEDOT:PSS between source (S) and drain (D) in a three-terminal organic electrochemical transistor. Reproduced with permission.163 Copyright, 2012, American Chemical Society – JACS. (e) Schematic of PEDOT:PSS at the top center of the panel, undergoing only vapor chemical reduction de-doping to the left, undergoing only solvent de-doping to the right, and combined vapor chemical reduction de-doping with solvent de-doping at the bottom.164 Copyright, 2015, Royal Society of Chemistry – Advances. | ||
4.2 De-doping
A viable approach for controlling dopant concentration to reach a high power factor is initially doping the polymers and then proceeding with de-doping.155 Several techniques for de-doping are summarized below, including chemical reduction de-doping, solvent de-doping, electrochemical de-doping,156 and acid–base de-doping.| EDOT + Fe3+(ToS−)3 → EDOT˙+Tos− + Fe2+(Tos−)2 |
The oxidized polymer is then reduced with tetrakis(dimethylamino)ethylene (TDAE – an n-type dopant) to control the oxidation level. Bubnova et al.158 noted a consistent rise in electrical conductivity and a falling Seebeck coefficient with increased oxidation level, as illustrated in Fig. 5(a). At the optimized oxidation level of 22%, a ZT of 0.25 was measured at room temperature. Massonnet et al.159 oxidized PEDOT with poly(styrene sulphonate) (PSS) and reduced with several agents: sodium sulfite (Na2SO3), sodium borohydride (NaBH4), sodium thiosulfate (Na2S2O3), hydrazine monohydrate (NH2NH2·H2O), and TDAE. The researchers discovered that employing TDAE (tetrakis(dimethylamino)ethylene) and hydrazine monohydrate as reducing agents resulted in significantly higher Seebeck coefficients of 150 μV K−1, which is about three times higher than those achieved with other reducing agents. This increase in performance is attributed to the formation of neutral chains from di-cation chains observed in PEDOT:PSS, whereas the sulfates create radical cation chains from di-cation chains, showing their weak strength as a reducing agent. This finding highlights the importance of selecting appropriate reducing agents to enhance the thermoelectric properties of conducting conjugated polymers.
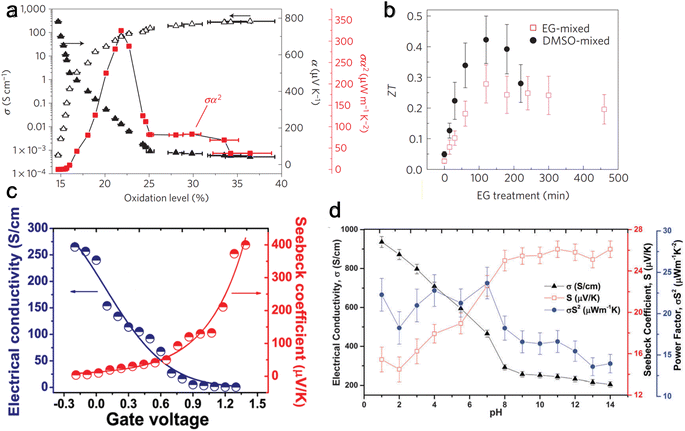 | ||
| Fig. 5 Effect on thermoelectric properties from different de-doping methods. (a) Chemical reduction de-doping, showing Seebeck coefficient (α), electrical conductivity (σ), and Power factor (α2σ) change with varying oxidation levels for PEDOT:Tos. Reproduced with permission.157 Copyright, 2011, Nature Materials. (b) Solvent de-doping, thermoelectric figure of merit (ZT) versus solvent (EG) treatment time for EG-mixed and DMSO-mixed PEDOT:PSS. Reproduced with permission.165 Copyright, 2013, Nature Materials. (c) Electrochemical de-doping, electrical conductivity, and Seebeck coefficient for varying gate voltage with a peak at 0.8 V. Reproduced with permission.163 Copyright, 2012, American Chemical Society – JACS. (d) Acid–base de-doping, showing Seebeck coefficient (S), electrical conductivity (σ), and Power factor (S2σ) for varying pH level for PEDOT:ToS films. Reproduced with permission.170 Copyright, 2015, Royal Society of Chemistry – JMCC. | ||
| PEDOT+PSS− + M+ + e− ⇄ PEDOT0 + M+PSS− |
Under a gate voltage of 0.8 V (corresponding to a 14.5% oxidation level), the maximum power factor is observed (Fig. 5(c)), with a ZT of 0.041. Controlling the oxidation level allows for dynamically altering the material's thermoelectric properties through gate voltage adjustments—similarly, Park et al.169 reported a significantly higher power factor (1270 μW m−1 K−2) using PP:PEDOT at a gate voltage of 0.1 V.
| PSS− + H2SO4 → PSSH + HSO4− |
Khan et al.170 used HCl and sodium hydroxide (NaOH) to tune the pH of PEDOT:ToS and found the highest power factor to be at a pH of 7 (Fig. 5(d)). Surface characterization methods showed that the Cl− and OH− anions replaced ToS ions. An exciting benefit of acid–base de-doping is that it can provide dynamic control of the thermoelectrical properties of the polymer by simply changing the pH of the environment.
4.3 Blending
Doping and de-doping discussed above showed that increasing dopant concentration decreases the Seebeck coefficient and electrical conductivity increases. Contrarily, to improve both the Seebeck coefficient and electrical conductivity with dopant concentration, the density of states (DOS) of the blended polymers needs to be matched, which was first achieved by Sun et al.171 is done by blending P3HT and poly(3-hexylthiothiophene) (P3HTT) and doping it with F4TCNQ. A blend of P3HT:P3HTT = 0.8![[thin space (1/6-em)]](https://www.rsc.org/images/entities/char_2009.gif) :
:![[thin space (1/6-em)]](https://www.rsc.org/images/entities/char_2009.gif) 0.2 can increase the Seebeck coefficient and electrical conductivity until 1% of F4TCNQ (wt%), as depicted in Fig. 6(a). Here, the HOMO level of P3HT is −5.2 eV, the HOMO level of P3HTT is −5.05 eV, and the LUMO level of F4TCNQ is −5.24 eV. The P3HTT energy level is slightly below the energy level of P3HT, so P3HTT defines the Fermi level, while the electrons predominantly traveled in the higher energy orbitals of P3HT. The equilibrated hole carriers in P3HTT chains need to be promoted into higher energy states of P3HT for efficient transport.
0.2 can increase the Seebeck coefficient and electrical conductivity until 1% of F4TCNQ (wt%), as depicted in Fig. 6(a). Here, the HOMO level of P3HT is −5.2 eV, the HOMO level of P3HTT is −5.05 eV, and the LUMO level of F4TCNQ is −5.24 eV. The P3HTT energy level is slightly below the energy level of P3HT, so P3HTT defines the Fermi level, while the electrons predominantly traveled in the higher energy orbitals of P3HT. The equilibrated hole carriers in P3HTT chains need to be promoted into higher energy states of P3HT for efficient transport.
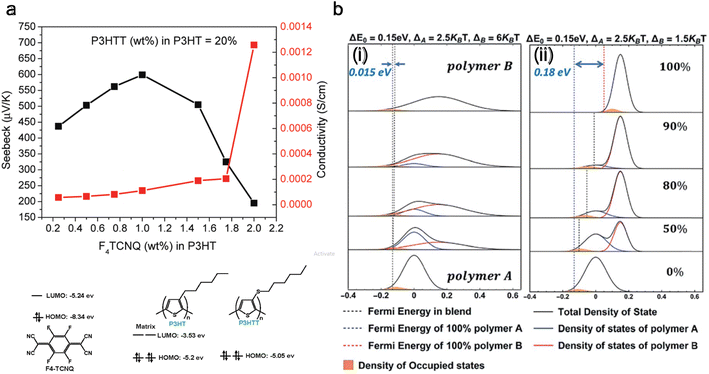 | ||
Fig. 6 Improving the thermoelectric performance of conjugated polymer by density of states (DOS) matching through blending. (a) Molecular structures and orbital energies of P3HT, P3HTT, and F4-TCNQ are shown. It also shows the Seebeck coefficient and electrical conductivity for a blend of P3HTT and P3HT (0.2![[thin space (1/6-em)]](https://www.rsc.org/images/entities/char_2009.gif) : :![[thin space (1/6-em)]](https://www.rsc.org/images/entities/char_2009.gif) 0.8 wt%). Reproduced with permission.171 Copyright, 2010, American Chemical Society – Macromolecules. (b) DOS of polymer blends with varying composition; (i) the polymer with its DOS centered at higher energies has a broader DOS than the polymer with its DOS centered at lower energies, (ii) the polymer with the higher energy DOS has a narrower DOS. Reproduced with permission.172 Copyright, 2019, Royal Society of Chemistry – JMCA. 0.8 wt%). Reproduced with permission.171 Copyright, 2010, American Chemical Society – Macromolecules. (b) DOS of polymer blends with varying composition; (i) the polymer with its DOS centered at higher energies has a broader DOS than the polymer with its DOS centered at lower energies, (ii) the polymer with the higher energy DOS has a narrower DOS. Reproduced with permission.172 Copyright, 2019, Royal Society of Chemistry – JMCA. | ||
The technique of DOS matching172 is depicted in Fig. 6(b), showing the variation in Fermi energy level as the composition of the polymer blend changes. The left panel is when the width of the DOS is broad (6kBT), and the right panel is when it is narrow (1.5kBT), against a consistent energy offset of 0.15 eV. It is observed that with a broad DOS for polymer B, the Fermi energy exhibits negligible alteration with an increasing concentration of polymer B. In contrast, with a narrow DOS for polymer B, there is a more substantial change (0.18 eV) in the Fermi level as the blend composition changes. Considering the relative position of the Fermi level to the DOS in these scenarios, a broad DOS results in a relatively even distribution of charge carriers between the two polymers.
Conversely, with a narrow DOS, most charge carriers will likely remain on polymer A, leading to its predominance in charge transport until polymer B is present in high concentrations. Intuitively, when charge transport is dominated by one polymer, it's improbable that the power factor in the blends will surpass that of the individual polymers. Therefore, it's anticipated that the most favorable scenario for an enhanced power factor in the blends would be where the Fermi energy shifts gradually and charge carriers are distributed across both polymers. Other studies172–175 also showed a factor of two enhancement in thermoelectric power factor with different blends.
4.4 Polymerization
When ions are added to monomers during synthesis, interlinked polymerization can occur, potentially increasing the electrical conductivity beyond the original conjugated polymer. Two primary methods for polymerization are electrochemical polymerization and oxidative polymerization. Following the former method, Hirashi et al.176 synthesized doped polythiophene films using nitrobenzene as a solvent and tetra-n-butylammonium perchlorate (TBAClO4) as an electrolyte. The polymerization of thiophene, induced by anodic oxidation on indium tin oxide (ITO) electrodes, was carried out in an electrolyte bath containing TBAClO4, thiophene, and nitrobenzene under a nitrogen atmosphere. They observed high Seebeck coefficients and electrical conductivity for 0.1 M thiophene and noted no significant change in these values with varying concentrations of TBAClO4, as depicted in Fig. 7(a).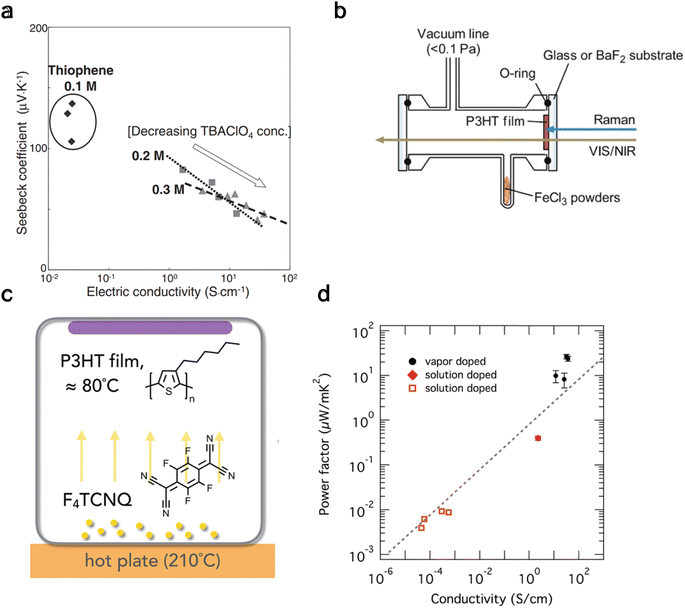 | ||
| Fig. 7 Thermoelectric properties from polymers made through electrochemical polymerization (a) and oxidative polymerization (b–d). (a) Seebeck coefficient vs. electrical conductivity of polythiophene thin films produced at 2 mA cm2 for changing concentrations of thiophene and tetra-n-butylammonium perchlorate (TBAClO4). Reproduced with permission.176 Copyright, 2009, Japanese Journal of Applied Physics. (b) Schematic of a cell for in situ absorption of FeCl3 onto a P3HT film. Reproduced with permission.178 Copyright, 2015, American Chemical Society – JPCB. (c) Schematic of a vapor doping method with organic dopant F4TCNQ onto a P3HT film, (d) power factor of P3HT film as a function of electrical conductivity for different doping methods; filled circles is vapor doped,179 filled rhombus is solution doped,146 and hollow square is solution doped.153 Reproduced with permission.179 Copyright, 2018, American Chemical Society – CM. | ||
Similarly, Culebras et al.177 studied PEDOT electro-polymerization with several counter-ions, ClO4, PF6, and bis(trifluoromethyl sulfonyl)imide (BTFMSI), and observed a relatively high ZT value of 0.23 for PEDOT:BTFMSI. This shows another viable approach to achieving high ZT values compared to de-doping.
In contrast to electrochemical polymerization, oxidative polymerization180 involves the oxidation of monomers, forming polymers with extended π-conjugation, crucial for their conducting properties. This process forms the polymer backbone and introduces positive charges (holes) along the chain, enhancing the material's conductivity. Common oxidants include iron(III) chloride (FeCl3) for pyrrole and persulfate for aniline.181 Yamamoto and Furukawa178 demonstrated vapor phase oxidation of P3HT thin films with FeCl3 (Fig. 7(b)). Upon creating a vacuum (<0.1 Pa), doping initiates, and through VIS/NIR absorption and Raman spectra, it was found that positive polarons form. These polarons convert to bipolarons upon further doping over approximately 10 hours. Lim et al.179 explored an alternative vapor doping method for P3HT film with F4TCNQ by placing the dopant on a hotplate parallel to the film (Fig. 7(c)). They discovered that this method, suitable for organic dopants, is much quicker (approximately 20 minutes) and results in a higher power factor by an order of magnitude compared to solution-based introduction techniques of F4TCNQ to P3HT, as depicted in Fig. 7(d).
4.5 Chain alignment and microstructure orientation
An increased chain alignment reduces phonon scattering and enhances thermal conductivity. It also diminishes charge carrier scattering, thereby boosting electrical conductivity without necessarily increasing the number of charge carriers. Hynynen et al.182 demonstrated that stretching P3HT doped with either the molybdenum tris(dithiolene) complex Mo(tfd-COCF3)3 or F4TCNQ leads to an increase in electrical conductivity while maintaining a constant Seebeck coefficient (Fig. 8(a)). Meanwhile, Hiroshige et al.183,184 demonstrated that butoxy-substituted phenylenevinylene polymer (P(BuOPV-co-PV)) has the Seebeck coefficient initially decreasing and then increasing, following an inverted parabolic shape with increasing draw ratio. The regular peak for electrical conductivity and the inverted peak for the Seebeck coefficient are observed at a stretching ratio of 7, as shown in Fig. 8(b). They noted that the initial rise in electrical conductivity is due to increased carrier concentration, and further stretching broke the chain ends due to increased strain, which decreases the carrier concentration. This suggests a trade-off between the Seebeck coefficient and electrical conductivity in highly oriented polymers.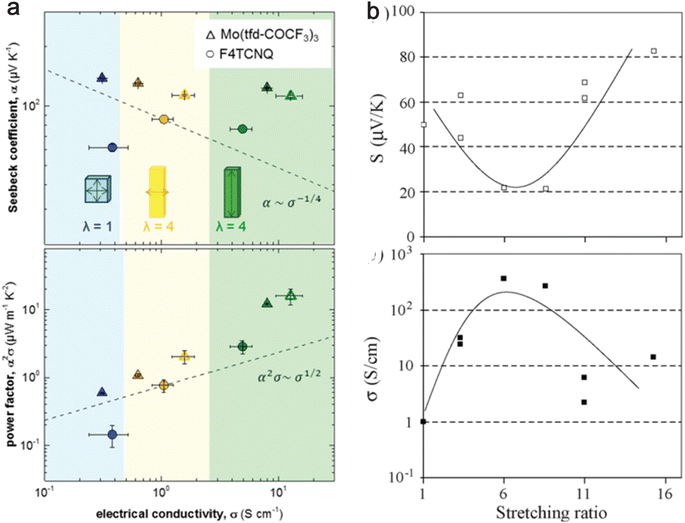 | ||
| Fig. 8 Effect of stretching ratio on thermoelectric properties of conducting polymers. (a) The top panel shows the electrical conductivity vs. Seebeck coefficient, and the bottom panel shows the power factor vs. electrical conductivity for P3HT doped with Mo(tfdCOCF3)3 (triangles) and F4TCNQ (circles); closed symbols indicate 48 h doping; open symbols indicate 72 h doping; dashed lines show the empirical trends α ∼ σ−1/4 and α2σ ∼ σ−1/2. λ is the stretching ratio, with the blue shaded region being unstretched, the yellow shaded region being stretched perpendicular to temperature difference, and the green shaded region indicating the stretched region in the direction of temperature difference. Reproduced with permission.182 Copyright, 2019, American Chemical Society – ML. (b) The top panel shows the Seebeck coefficient with the stretching ratio, and the bottom panel shows the electrical conductivity with the stretching ratio for P(BuOPV-co-PV) at 313 K. Reproduced with permission.184 Copyright, 2007, Synthetic Metals. | ||
Nevertheless, this improvement in power factor may be offset by a rise in thermal conductivity due to the alignment of the chains. Typically, a high draw ratio (greater than 10) is necessary to enhance thermal conductivity significantly. However, it is noted from Fig. 8(a) that a relatively lower draw ratio of 4 can amplify electrical conductivity by a factor of 40. This suggests the possibility of searching for an optimal draw ratio where electrical conductivity increases substantially without a corresponding significant increase in thermal conductivity and a decrease in the Seebeck coefficient. Future studies with measurements of all three critical properties (κ,σ,S) of thermoelectric materials with changes in draw ratio will be able to address the optimal draw ratio for maximal ZT of OSCs.
In the study of OSCs, various techniques are available for achieving chain alignment and creating oriented microstructures, such as mechanical stretching,185,186 friction transfer,187 secondary doping,188,189 mechanical rubbing,190 electric field,191 electrodeposited nanowires,192 printing using thermoelectric inks,161 and flow coating.193 However, previous research employing these methods lacks comprehensive data on the thermal conductivity and thus does not completely understand the material's thermoelectric performance, specifically its ZT. This article will not delve deeper into these alignment methods and direct readers to the review by Deng and Chen194 for a detailed review.
4.6 Modifications in backbone and side chain
The molecular design of conjugated polymers, encompassing both the backbone and sidechain, enables the engineering of HOMO and LUMO levels. Modifying the molecular structure tunes the band gap of the conjugated molecule and the absolute energy level compared to the dopant. Beyond adjusting energy levels, other aspects, such as charge carrier mobility and chain packing, are also influenced.198 Notably, the impact of molecular design on energy levels is more pronounced in small-molecule OSCs. Consequently, the studies discussed in this subsection focus on n-type polymers, as p-type polymers have longer chain lengths and more complex morphology. Molecular design methods (Fig. 9) include adding polar groups to the backbone,196 alteration of the backbone orientation, modification of the side-chain length, changes in the dopant, polymer tethering length, and incorporation of halogen atoms into the backbone.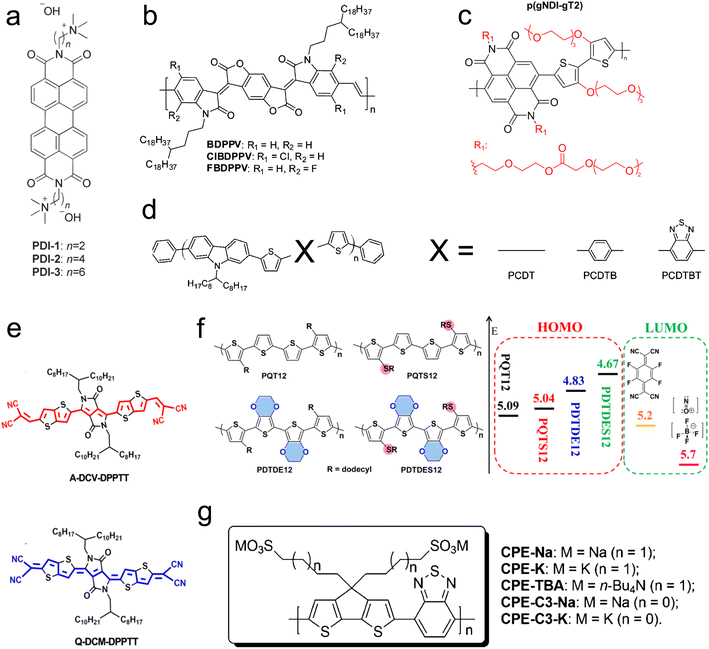 | ||
| Fig. 9 Chemical structures of conjugated polymers showing different strategies to modify the polymer backbone and side chain. (a) Changing the tethering alkyl chain length between the perylene diimides (PDI) polymer and charged dopant/side-group in the self-doped polymer. Reproduced with permission.195 Copyright, 2014, Wiley – Advanced Materials. (b) Introducing halogen atoms to benzodifurandione-based polyphenylene vinylene (BDPPV) polymer backbone. Reproduced with permission.148 Copyright, 2015, American Chemical Society – JACS. (c) Adding polar side chains to naphthalenediimide-based co-polymer. Reproduced with permission.196 Copyright, 2018, American Chemical Society – EL. (d) Changing a backbone with different groups for poly(2,7-carbazole) derivatives. Reproduced with permission.197 Copyright, 2009, American Chemical Society – CM. (e) Different molecular orientation of solution-processable dipyrrolo-[3,4-c] pyrrole-1,4-diylidene)bis(thieno[3,2-b]thiophene (DPPTT) derivatives. Reproduced with permission.198 Copyright, 2017, Materials Science and Engineering Reports. (f) Chemical structures and orbital energy levels for poly(bisdodecylquaterthiophene) derivatives. Reproduced with permission.199 Copyright, 2017, American Chemical Society – JACS. (g) Changing counterions and tethering alkyl chain lengths for self-doped conjugated polyelectrolyte cyclopenta-[2,1-b;3,4-b′]-dithiophene-alt-4,7-(2,1,3-benzothiadiazole). Reproduced with permission.200 Copyright, 2014, American Chemical Society – JACS. | ||
Russ et al.195 employed a self-doping method to investigate the thermoelectric properties of an n-type conjugated polymer, perylene diimides (PDI), with a charged doping group attached to the end, as illustrated in Fig. 9(a). They varied the alkyl chain length, tethering the conjugated backbone to the dopant (2, 4, and 6 methyl groups). Their findings revealed that increasing the alkyl chain length by two carbons increased the power factor by one order of magnitude—similarly, Mai et al.200 delved deeper into self-doping by varying the side-chain length and counter ions for a conjugated polyelectrolyte (cyclopenta-[2,1-b;3,4-b]-dithiophene-alt-4,7-(2,1,3-benzothiadiazole)) (Fig. 9(f)). They observed that shorter chain lengths increase power factors and improve molecular orientation. Additionally, they demonstrated that altering counter-ions from potassium to sodium can quadruple the power factor. Endrődi et al.201 also reported that shorter alkyl side chains between the polymer and counter-ion correlate with a higher power factor (Fig. 9(g)).
To examine the role of molecular orientation, Huang et al.198 utilized two n-type molecules: aromatic-dicyanovinyl-dipyrrolo[3,4-c] pyrrole-1,4-diylidene)-bis(thieno[3,2-b] thiophene (A-DCV-DPPTT) and quinoid-dicyano-methylene-dipyrrolo[3,4-c]pyrrole-1,4-diylidene)bis(thieno-[3,2-b]thiophene (Q-DCM-DPPTT), with a dopant of N-DMBI. A slight variation in the backbone and molecular orientation of A-DCV-DPPTT and Q-DCM-DPPTT is shown in Fig. 9(e). The LUMO level of A-DCV-DPPTT is −3.9 eV, compared to −4.5 eV for Q-DCM-DPPTT, while the HOMO level of N-DMBI is −4.4 eV. The energy level alignment between A-DCV-DPPTT and N-DMBI facilitates efficient charge transfer and results in an order of magnitude difference in the power factor between the two conjugated polymers. Furthermore, a high ZT of 0.23 at 373 K and 0.11 at room temperature was observed.
Backbones can also be modified by incorporating a halogen atom or adding a molecular group. Employing the former approach, Shi et al.148 studied an n-type polymer, benzodifurandione-based polyphenylene vinylene (BDPPV), doped with N-DMBI. They discovered that introducing a halogen atom, as shown in Fig. 9(b), significantly enhances charge carrier mobility and doping levels, with chlorine introduction increasing the power factor fivefold and fluorine introduction tenfold. Utilizing the latter approach, Aïch et al.197 changed the polymer backbone for poly(2,7-carbazole) derivatives by introducing different molecules, as shown in Fig. 9(d), resulting in a threefold improvement in the power factor.
4.7 Effect of molecular weight and chain length
The molecular weight, or chain length, critically affects the conjugated polymer's solubility and viscosity, influencing its processability from solution and melt.143 One notable challenge associated with high molecular weight polymers is their reduced processability, which can impede doping efficiency and complicate the fabrication of flexible thermoelectric devices. However, a significant effect of increased molecular weight in polymers like polythiophene is the narrowing of the bandgap between the HOMO and LUMO levels (Fig. 10(a)). This reduction in bandgap is associated with an increase in electrical conductivity, albeit at the cost of a decreased Seebeck coefficient.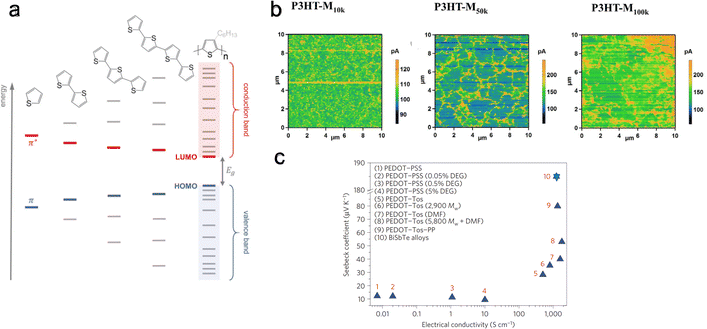 | ||
| Fig. 10 Effect of molecular weight or chain alignment on charge and thermoelectric transport. (a) Evolution of HOMO and LUMO levels with increasing thiophene units. Reproduced with permission.143 Copyright, 2017, Wiley – Advanced Materials. (b) Conductive AFM scans for a bias of 0.1 V for P3HT films with different molecular weights. Reproduced with permission.202 Copyright, 2018, Wiley – CAJ. (c) Seebeck coefficient and electrical conductivity of various PEDOT derivatives (including variation of dopants, solvent concentration, and molecular weight). Reproduced with permission.203 Copyright, 2012, Royal Society of Chemistry – EES. | ||
The molecular weight reflects the non-uniform chain lengths within the polymer. This non-uniformity can potentially hinder effective connectivity between chains. It has been shown by Qu et al.202 that increasing molecular weight increases connectivity. They investigated the thermoelectric performance of P3HT films with three different molecular weights of ∼10k, 50k, and 100k g mol−1. They found that P3HT-M50k has higher electrical conductivity than P3HT-M100k and P3HT-M10k. In contrast, the Seebeck coefficient remains the same for all three molecular weight polymers. Conductive-AFM analysis at 0.1 V bias revealed that longer molecular chains facilitate better connectivity (Fig. 10(b)). Here, regions with high conductivity (electrical current I > 200 pA) indicate domains with enhanced carrier delocalization, likely due to a more ordered structural arrangement. In contrast, regions with poor conductivity (I < 200 pA) can be seen as domains with reduced carrier delocalization, possibly arising from a disordered structural configuration. The P3HT-M10k film displays a scattered distribution of high-conductivity areas. In contrast, the P3HT-M50k and P3HT-M100k films demonstrate the presence of conductive zones forming network-like structures. Notably, the network structure in the P3HT-M100k film appears more aggregated compared to that in the P3HT-M50k film. Further, Bubnova et al.203 observed increased Seebeck coefficient and electrical conductivity with increasing molecular weight in PEDOT:Tos, a conjugated p-type polymer (Fig. 10(c)). This increase in charge carrier mobility, accompanied by a rise in the Seebeck coefficient, is attributed to improved molecular orbital energy level alignment at higher molecular weights.
4.8 Effect of crystallinity and morphology
Increasing crystallinity within conducting polymers enhances charge carrier mobility and chain packing204 while simultaneously reducing dopant miscibility. Crystallinity can be affected by synthesis protocol and post-synthesis methods. Deng et al.205 studied melt and solution processing protocols using P3HT as a model system. They showed that solution-processed films have higher TE performance due to their edge-on crystalline orientation and solid-state ordering. Meanwhile, melt processing leads to reduced conjugation length and TE performance. Several post-synthesis methods exist to alter the crystallinity, such as annealing, adjusting the pH level206 using an ionic liquid, modifying side-chain length, and employing solvent treatment.203,207Most OSCs cannot endure very high temperatures, rendering annealing processes less explored for pure polymers. Wolfe et al.208 conducted post-treatment thermal annealing on a blend of nickel ethenetetrathiolate (NiETT), an n-type organic thermoelectric material, and PVDF. They observed a steady increase in both electrical conductivity (from 6 ± 2 to 23 ± 3 S cm−1) and the Seebeck coefficient (from −28 ± 3 to −74 ± 4 μV K−1) with rising annealing temperatures (Fig. 11(a)). This enhancement was attributed to improved chain packing, as evidenced by thermogravimetric analysis-mass spectroscopy (TGA-MS) results. Huang et al.209 studied the effect of annealing on the most popular PEDOT:PSS systems and found an optimized annealing temperature of 220 °C, which increased the thermoelectric power factor by 162 times compared to pristine film. They showed that annealing leads to microstructural evolution, characterized by improved crystallinity, increased grain size, and a transformation in domain morphology from spherical granule to nanofibril. These changes facilitate more efficient carrier transport mechanisms, improving the materials' electrical conductivity and overall thermoelectric properties. In a different study,210 they explored solvent de-doping on 220 °C annealed PEDOT:PSS systems and found that a DMSO treatment increased the power factor by 216 times compared to pristine film.
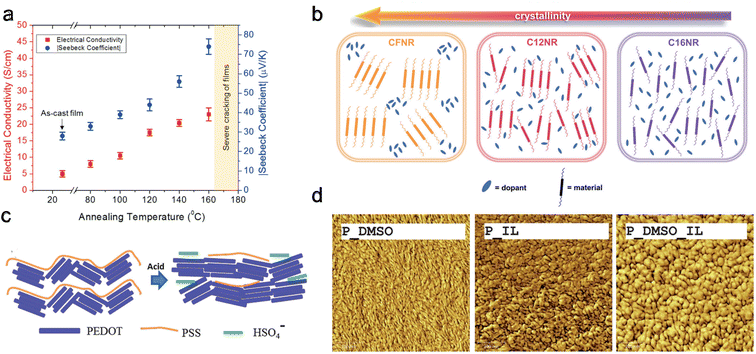 | ||
| Fig. 11 Modifying crystallinity and morphology through different methods. (a) Annealing, Seebeck coefficient, and electrical conductivity with increasing annealing temperature for nickel ethenetetrathiolate and PVDF blend. Reproduced with permission.208 Copyright, 2018, Wiley – AFM. (b) Doping uniformity and miscibility for polymers with different crystallinity and side chains. Reproduced with permission.211 Copyright, 2023, Wiley – Advanced Science. (c) Schematic of possible conformations changes upon exposure to sulfuric acid for PEDOT:PSS. Reproduced with permission.212 Copyright, 2016, Royal Society of Chemistry – JMCC. (d) AFM scanning (surface morphology) after different solvent treatments for PEDOT:PSS, scanning area (1 μm × 1 μm). Reproduced with permission.213 Copyright, 2013, Royal Society of Chemistry – JMCA. | ||
In a recent study by Duan et al.,211 three different polymers with varying side chains were examined: C12NR (C12H25), CFNR (C10H20–C6F13), and C16NR (C16H3). It was found that C16NR, possessing the longest alkyl chain, exhibited the weakest crystallinity. Conversely, CFNR, which has the shortest alkyl chain, displayed the highest crystallinity. Interestingly, the power factor for C12NR was two to four times higher than the other two polymers. This suggests that increasing crystallinity negatively impacts the uniformity and miscibility of doping, as shown in Fig. 11(b), leading to decreased electrical conductivity. The shorter alkyl chain in C12NR enhances molecular packing and morphology.
The influence of pH level on polymer properties also extends to conformational and packing changes and de-doping effects212 as shown in Fig. 11(c). Kong et al.214 discovered that the intrinsic pH of PEDOT:PSS is approximately 2.3. They noted increased grain size and power factor by reducing the pH using oxalic acid or HCl. The highest power factors were achieved at a pH of 0.2 with oxalic acid and 0.4 with HCl, indicating a synergistic effect of grain modification and oxidation level changes—furthermore, Luo et al.213 investigated the impact of various solvents on doped PEDOT:PSS. They found that PEDOT grains elongated by DMSO exposure resulted in a higher power factor compared to the circular grains formed following exposure to an ionic liquid, 1-ethyl-3-methylimidazolium tetrafluoroborate (EMIMBF4) or (IL) Fig. 11(d). This improvement is attributed to a more favorable orientation of the polymer backbone in elongated grains versus circular ones. Notably, the highest power factor was achieved when the polymer was treated with a combination of EMIMBF4 and DMSO. Chen et al.215,216 showed that ionic liquid acts as a de-doping agent and induces phase separation in PEDOT:PSS single-walled carbon nanotube (SWCNT) systems forming linear quinoid conformation. This showed an improvement in thermoelectric performance. In a different study, Chen et al.217 showed that ionic liquid also increases the mechanical strength and self-recoverability of PEDOT:PSS/PVA/SWCNT composites.
5. Molecular scale effects for thermal transport in polymers
This section discusses the complex relationship between polymer molecular-scale traits, phonon transport characteristics, and the resultant thermal conductivity. Typically, electrically insulating polymers have phonons as the dominant energy carrier. In contrast, for semiconducting polymers, both polarons and phonons can be dominant energy carriers depending on the polymer's electrical conductivity.A primary focus here is polymers with phonon as the dominant energy carrier; however, Section 5.8 discusses the effect of inter-related charge and phonon transport on thermal transport in OSCs. Notably, the contribution of charge transport to thermal transport can be engineered to create a low thermally conductive polymer. The discussion begins with the effect of molecular chain length. Then, it explores various molecular properties that deviate from ideal phonon transport observed in a single chain, such as backbone structure, conformation, and inter- and intra-molecular interactions. Further, the section covers nano- and molecular-engineering approaches to reduce phonon scattering by enhancing polymer crystallinity, aligning molecular chains, engineering intermolecular interactions, and reinforcing bond stiffness and long-range order offer ways to improve thermal conductivity in polymers.218 The molecular effects and engineering methods discussed in the sub-sections cover many polymers.
5.1 Molecular chain length
Single polymer chains are widely considered model systems for studying unusual thermal transport effects in one dimension (1-D). The pioneering work was performed by Fermi, Pasta, and Ulam (FPU)219 in the 1950s. FPU computationally studied a 1D non-linear dynamic system with quadratic, cubic, and broken-linear terms. A striking observation from their numerical simulation was that the thermal conductance of an atomic chain increases divergently with the chain length (Gth ∝ Lβ, β > 0), in conflict with the Fourier law, which states that thermal conductance is inversely proportional to the chain length (Gth ∝ L−1). Such a counterintuitive prediction has attracted increasing attention over the past decades and has been studied extensively from a theoretical perspective.220 In particular, simulations have been performed based on various methods such as molecular dynamics,184 Green–Kubo,218 and non-equilibrium Green function (NEGF),221 and some calculations have reported the value of β = 0.4 as a general characteristic of 1D chains. Addressing the FPU divergence question necessitates a non-perturbative approach rooted in many-body physics.105,222,223Beyond the idealized 1D atomic chain, polymer chains with well-defined molecular backbone and side chains have also been studied extensively due to their direct relevance to potential applications of the FPU problem. Simulations on single polyethylene chains and polymer chains of aromatic monomers have found that a single polymer chain could be 1000 times more conductive thermally than a typical bulk polymer. Specifically, Henry and Chen232 used MD simulations to calculate the thermal conductivity of 1D polyethylene (PE) chains and confirmed the divergent thermal transport behavior predicted by FPU (Fig. 12(a)). They have observed the highest thermal conductivity in carbon-based materials (>1000 W m−1 K−1) with phonon group velocities reaching 15![[thin space (1/6-em)]](https://www.rsc.org/images/entities/char_2009.gif) 000 m s−1. This divergence is primarily attributed to increased phonon relaxation time due to aligned monomer segments.224
000 m s−1. This divergence is primarily attributed to increased phonon relaxation time due to aligned monomer segments.224
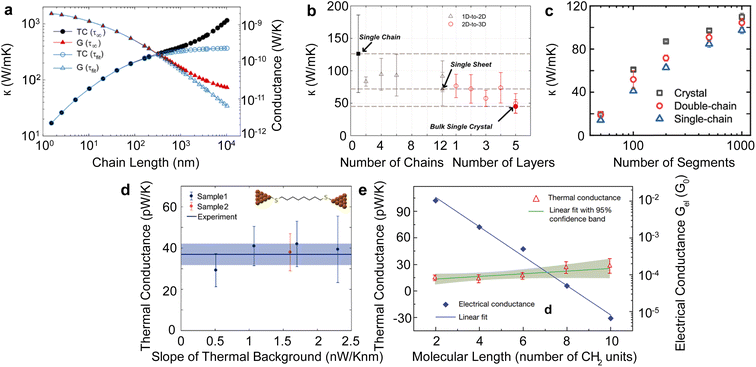 | ||
| Fig. 12 Thermal conductivity divergence studies. (a) The infinite diverging thermal conductivity and corresponding thermal conductance of polyethylene single chain. Reproduced with permission.232 Copyright, 2008, American Physical Society – PRL. (b) Thermal conductivity transition from 1D (single chain) – 2D (single sheet) – 3D (single crystal) for polyethylene. Reproduced with permission.218 Copyright, 2010, American Physical Society – PRB. (c) Thermal conductivity for single-chain, double-chain, and crystal as a function of a number of segments of poly(p-phenylene). Reproduced with permission.233 Copyright, 2023, American Chemical Society – JPCB. (d) Experimental measurement of thermal conductance for octane-dithiol. Reproduced with permission.234 Copyright, 2019, American Chemical Society – NL. (e) Thermal conductance and electrical conductance of single-molecule (alkanedithiols) with increasing length. Reproduced with permission27 Copyright, 2019, Nature. | ||
Shorter molecular junctions (MJs) are another essential model system for understanding the length-dependent thermal transport in polymers. Segal et al.220 calculated the thermal conductance of short alkane MJs using the Langevin equation and found that thermal conductance increases for MJs with less than five carbon atoms and is constant for MJs with more than ten carbon atoms. In contrast, ab initio simulations225,226 suggested that phononic conductance in alkane MJs is nearly independent of the molecular length—further, recent work by Leitner et al.227,228 found that ballistic phonon transport is valid for short MJs with slow thermalization. Phonon transport in longer molecules with quick thermalization is predicted to break the ballistic picture, leading to inelastic phonon scattering in MJs. These results suggested significant contradictions in different models, which could be resolved by experimentally quantifying the length-dependent thermal conductance of single MJs.
For a realistic polymer system, the extended chain length introduces mechanical constraints like bending, torsion, nonbonding, and convection.229 Jiang et al.221 studied a PE chain of 100 nm in length and calculated a definitive upper limit for thermal conductivity (κ = 310 W m−1 K−1) and Young's modulus (E = 374.5 GPa). Further computational studies on materials other than PE have found diverging thermal conductivity in single-chain forms. For instance, crystalline polythiophene230 (PT) was found to have κ = 198 W m−1 K−1 at 100 nm in length. Nonetheless, not all polymers exhibit FPU divergence since some mechanical constraints are more pronounced in specific systems. For example, the unsaturated hydrocarbons, such as carbyne and cumulene chains, exhibit finite thermal conductivities231 as the angular bending potential shown in these chains effectively curbs the extensive fluctuations within the chain.
Beyond the 1D polymer structures, a higher-dimensional configuration with one dimension constituted of long single chains has thermal conductivity decreasing with increasing dimensionality due to augmented inter-chain interactions218 (κ1D > κ2D > κ3D) (Fig. 12(b)). Conversely, the relation between thermal conductivity and dimensionality can be inverted if the chains are bonded and aligned in the perpendicular plane to the chain length, as demonstrated by Yang et al.233 in their study of aromatic poly(p-phenylene). They showed that the 3-D crystalline form exhibits greater thermal conductivity compared to both double-chain (2-D) and single-chain (1-D) configurations, as depicted in Fig. 12(c). This is because of π–π stacking, a non-covalent interaction between aromatic rings, which leads to the parallel alignment of the rings. This alignment curbs the free rotation of polymer chains and enhances thermal transport along the chain. Notably, this impact appears limited to the interchain thermal conductance between phenyl rings. The above work suggested that a 3-D polymer crystal, engineered through π–π stacking, can serve as a model system to investigate the FPU problem experimentally at the bulk level.
Quantifying the thermal conductance of a single chain and gaining insights into the FPU phenomenon poses significant experimental challenges as it requires the simultaneous control of an atom-sized system and measurement of ultrasmall thermal signal. Two methods are typically employed for experiments involving single-molecule chains. The first method involves placing a self-assembled monolayer between two temperature-differing thermal reservoirs.235 In this setup, the signal comes from an ensemble of more than 100 molecules, assumed to be thermally parallel. The second technique, single molecule break junction (SMBJ), requires a covalently bonded individual molecule or chain between the thermal reservoirs.27 The difference in measurement signal before and after breaking the junction accurately determines the molecule's thermal conductance. It is worth noting that this approach yields valuable insights into the FPU problem, as it allows for a direct examination of the length-dependent single-chain thermal transport.
Wang et al.235 conducted a study on the thermal conductance of an alkane monolayer system employing the ultrafast flash technique, encompassing chains with 24 carbon atoms. Their results unveiled a constant thermal conductance across varying chain lengths. However, the extent of chain lengths examined in this study was less than 3 nm and fell short of addressing the divergence described by the FPU problem. The first direct measurement on a single molecule chain was performed by Cui et al.,27 in which they employed SMBJ in conjunction with a time-averaging measurement scheme to quantify the thermal conductance of various lengths of alkane dithiols with carbon atoms from 2 to 10. This approach allowed them to achieve an ultra-high resolution of 80 picoWatt (pW) at room temperature, facilitating the quantification of thermal conductance for single molecules. Their findings revealed that the measured thermal conductance (approximately 25 pW K−1) exhibited a nearly constant value irrespective of chain length (Fig. 12(e)). This result underscores the remarkable consistency of thermal conductance across varying chain lengths for a smaller number of segments. Using a similar technique, Mosso et al.234 investigated the thermal conductance of octane-dithiol, which was found to be 35 pW K−1, as illustrated in Fig. 12(d).
In bulk polymers, the chain length effect on thermal transport is commonly referred to as the molecular weight of the polymer.237 To study the impact of molecular weight on thermal conductivity, Zhang et al.117 utilized the electrospinning technique to create various types of vinyl nanofibers. Their observations suggested a clear trend that thermal conductivity is strongly correlated with molecular weight, as shown in Fig. 13(a). However, such observations do not provide a definitive insight into the FPU divergency because nanofibers consist of many polymer chains rather than a single chain. This results in more complex inter-chain interactions and chain alignment scattering, potentially overshadowing the increase in thermal conductivity due to divergent phonon transport.
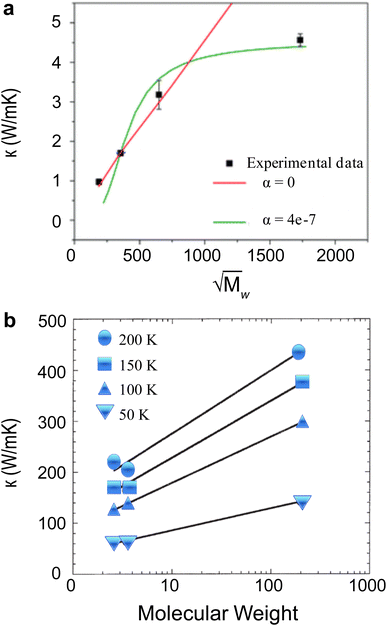 | ||
| Fig. 13 Experimental engineering methods for varying molecular weight. (a) Measured thermal conductivity of polyethylene nanofibers at 200 K as a function of the square root of the molecular weight. Reproduced with permission.117 Copyright, 2018, Royal Society of Chemistry – SM. (b) Thermal conductivity as a function of molecular weight for gamma rays irradiated polyethylene fibers. Reproduced with permission.236 Copyright, 2006, Wiley – JAPC. | ||
Furthermore, using a post-synthesis method to alter the molecular weight, Yamanaka et al.236,238 irradiated ultra-high molecular weight PE fibers with γ-rays. This study demonstrated that γ-ray exposure effectively broke down the polymer chains, reducing molecular weight and concurrently decreasing thermal conductivity (Fig. 13(b)). It should be noted here that this approach could be practical in introducing defects into conducting conjugated polymers to reduce thermal conductivity without significantly affecting the power factor of the thermoelectric material.
5.2 Molecular orientation and chain alignment
A widely studied approach to controlling the thermal transport in polymers involves the manipulation of molecular orientation and chain alignment. Molecular orientation is defined as the specific alignment of molecules within the polymer along a particular axis. This orientation can be induced through various factors,239 including mechanical stretching, drawing, rolling, extrusion, and exposure to external magnetic and electric fields. Additionally, modification of pH level, bottom-up templating techniques,130 and fluidic conditions during processing can induce preferable molecular orientation. These techniques often lead to an increased thermal conductivity along the direction of alignment, coupled with decreased thermal conductivity in the perpendicular direction. This section will summarize research efforts in both mechanical strain and non-strain-based nanoengineering methods to improve molecular orientation and chain alignment in polymers.One of the non-mechanical methods to induce better chain conformation is changing the pH level during solution-based polymer synthesis. By adjusting the pH of polyacrylic acid (PAA), Shanker et al.127 ionized the carboxyl acid groups into carboxylates, facilitating the stretching of the molecular chain. This leads to a stiffer chain conformation with compact chain packing and reduced inter-chain interactions. The increased pH level also changed the inter-chain interactions to include stronger ionic bonding rather than van der Waal's and H-bonding forces. The thermal effect due to different bonding interactions is discussed in Section 4.5. These changes manifested as a notable increase in thermal conductivity, ranging from 0.34 W m−1 K−1 at a pH of 1 to 1.17 W m−1 K−1 at a pH of 12, as shown in (Fig. 14(e)).
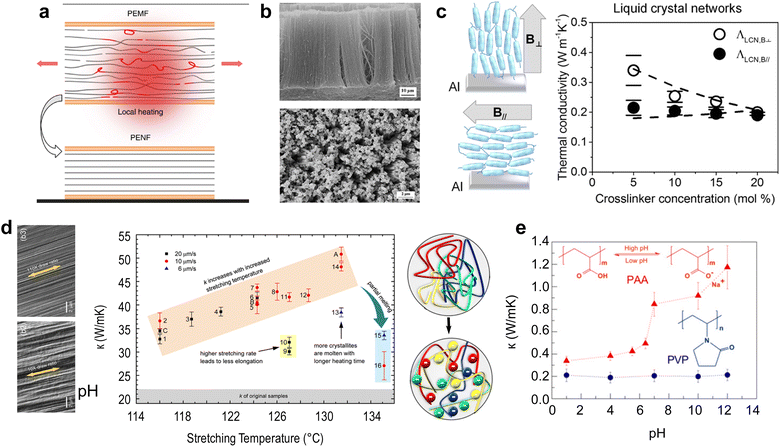 | ||
| Fig. 14 Different methods to align polymer chains. (a) Schematic of polymer chain stretching with localized heating and under strain to make polyethylene-nanofibers (PENF) from polyethylene-microfibers (PEMF). Reproduced with permission.94 Copyright, 2018, Nature Communications. (b) Scanning Electron Microscopy (SEM) images of high-density polyethylene nanowire array top (side view), bottom (top view). Reproduced with permission.100 Copyright, 2011, Polymer. (c) (Left) Chain alignment with change in magnetic field direction and (Right) thermal conductivity of Liquid Crystal Network (LCN) with varying thiol crosslinker concentration. The two curves show the direction of the applied magnetic field during synthesis. Reproduced with permission.240 Copyright, 2016, American Chemical Society – ML. (d) (Left) SEM images of polyethylene with drawing ratio and (Right) thermal conductivity as a function of stretching temperature and stretching speed.241 Copyright, 2017, American Chemical Society – Omega. (e) (Left) Change in polymer chain packing and (Right) thermal conductivity of polyacrylic acid (PAA) and poly(N-vinyl pyrrolidone) (PVP) with different pH. Reproduced with permission.127 Copyright, 2017, Science – SA. | ||
Shin et al.240 showed that liquid crystal networks (LCN) synthesized under a directional magnetic field (B⊥ or B∥) can exhibit preferential molecular orientation. They found an increase in thermal conductivity up to two orders of magnitude for LCN synthesized with a perpendicular magnetic field compared to a parallel magnetic field, as illustrated in (Fig. 14(c)). In the context of the template synthesis method, Cao et al.100 made nanowire arrays (Fig. 14(b)) using a nano-porous template wetting technique and found thermal conductivity to be two orders of magnitude higher than the bulk counterpart.
Besides non-mechanical methods, the most direct method to achieve a higher degree of molecular orientation in semi-crystalline polymers involves increasing strain242 by stretching243 polymers under temperature (Fig. 14(a)). Stretching temperature and stretching rate play a vital role in improving thermal conductivity. Even minor alterations in stretching temperature can significantly impact thermal conductivity. When the rate is slow, the crystallites are molten; when the rate is higher, it leads to the elongation of chains (Fig. 14(d)). Therefore, an ideal stretching rate and temperature can give the desired thermal conductivity for different polymers.79 Although diverse strategies have been employed to induce strain in polymers, one of the most common techniques involves reducing the fiber diameter or film thickness. The following sub-section provides insight into the methodologies used for synthesizing nanofibers with aligned molecular structures.
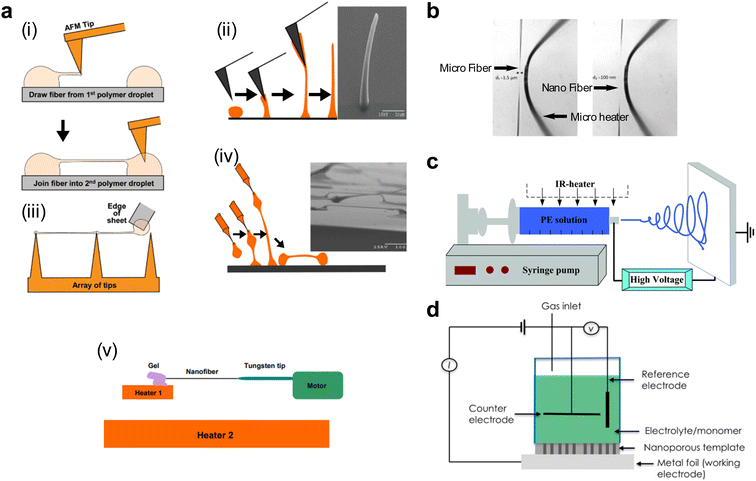 | ||
| Fig. 15 Different methods to make nanofiber. (a) Sharp tip drawing. (i) Atomic force microscopy (AFM) tip joining two PMMA droplets to make nanofiber. Reproduced with permission.246 Copyright, 2004, American Chemical Society – NL. (ii) Vertical drawing of PMMA with AFM tip. Reproduced with permission.247 Copyright, 2006, Institute of Electrical and Electronics Engineers. (iii) Joining two sharp tips with the edge of a sheet. Reproduced with permission.246 Copyright, 2004, American Chemical Society – NL. (iv) Micro-pipette probe-based drawing technique. Reproduced with permission.247 Copyright, 2006, Institute of Electrical and Electronics Engineers. (v) Polyethylene drawing using a sharp tungsten tip on a heating stage. Reproduced with permission.98 Copyright, 2010, Nature Nanotechnology. (b) Transient heat stretching (left) before heating and microfiber, (right) after heating and nanofiber. Reproduced with permission.138 Copyright, 2018, Nature Communications. (c) Schematic of electrospinning setup with an embedded IR heater. Reproduced with permission.113 Copyright, 2015, Royal Society of Chemistry – Nanoscale. (d) Schematic of nanoscale templating technique. Reproduced with permission.109 Copyright, 2014, Nature Nanotechnology. | ||
To facilitate the understanding and comparison of the methods described above, we have provided Table 2 with the measured thermal conductivity using different stretching methods for various polymers.
5.3 Backbone and side-chain effect
The atomic composition, types of bonding interactions, and molecular conformation of a polymer's backbone differ markedly among various polymers, influencing their thermal conductivity. This effect is observed when comparing the thermal conductivities of polymers with identical segment counts but different compositions. For instance, a single PE chain comprising 1000 segments224 exhibits a thermal conductivity of 50 W m−1 K−1, and a single polydimethylsiloxane (PDMS)250 chain, also with 1000 segments, has a much lower thermal conductivity of 5 W m−1 K−1. Despite the same number of segments or chain lengths, this one-order-of-magnitude difference in thermal conductivity can be attributed to the complex influences of the molecular backbone and side chains. The backbone of a polymer refers to the central chain formed by connecting the monomer segments. The backbone, the central chain formed by monomer segments, is crucial as it facilitates approximately 80% of phonon transport in polymers with aligned single chains.4 Therefore, manipulating the polymer backbone's structure, stiffness, and length is crucial for modifying thermal conductivity.A key feature determining the backbone effect on thermal transport is the type of chemical bonds between the organic chains. Carbon atoms form planar rings through conjugated π-bonds and sp2 hybridization in polymers with an aromatic backbone, rendering the structure significantly stiffer than those with aliphatic backbones. This stiffness is due to the restricted rotation and bending of the chains. Liu and Yang224 calculated that polymers with aromatic backbones exhibited thermal conductivity that is 2.6 times higher than their aliphatic counterparts, as illustrated in Fig. 16(a). When a polymer chain is extended, it may experience increased torsion, leading to a loss of straightness through bending and kinking, which introduces additional phonon scattering.251 Duan et al.252 found that increasing the number of kinks in PE chains leads to more phonon scattering centers, leading to reduced thermal conductivity, as shown in Fig. 16(b). Remarkably, even a single kink can induce diffusive-like scattering for more than half of the phonons, significantly diminishing the thermal conductivity by half in a 141 nm long polymer.
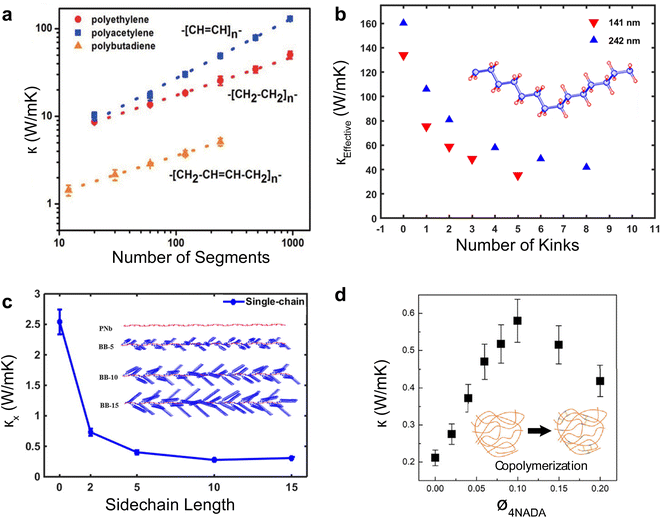 | ||
| Fig. 16 Backbone and side-chain effects. (a) Thermal conductivity of aliphatic (polyethylene) and aromatic (polyacetylene and polybutadiene) single-chain polymer with increasing chain segments. Reproduced with permission.224 Copyright, 2012, American Physical Society – PRB. (b) Thermal conductivity of polyethylene chain with increasing kinks in the backbone for two different chain lengths (141 nm and 242 nm). Reproduced with permission.252 Copyright, 2019, American Institute of Physics – JAP. (c) Thermal conductivity of a single-chain polymer with increasing side chain length, inset showing polymer chain with increasing length of sidechain. Reproduced with permission.253 Copyright, 2017, American Institute of Physics – APL. (d) Thermal conductivity of co-polymerized polyimide with changing mole fraction of 2,4,5,7-tetraamino-1,8-dihydroxyanthracene-9,10-dione (4NADA), inset showing a schematic of polymer before and after copolymerization. Reproduced with permission.254 Copyright, 2022, Cellpress – iScience. | ||
In polymers with side chains, additional thermal pathways are introduced beyond transport through the backbone. Generally, incorporating heavier and longer side chains results in lower thermal conductivity than lighter and shorter side chains.255 Furthermore, asymmetric side chains or reducing the distance between neighboring side chains further diminishes thermal conductivity.117 Ma et al.253 found that the high sensitivity of thermal conductivity to side-chain length diminishes when the length surpasses ten monomer segments (Fig. 16(c)). This is due to phonons decaying and scattering before reaching the end of long side chains, rendering their length inconsequential beyond a certain point. It should be noted that while the absence of side chains is typically preferred for high thermal conductivity in polymers, incorporating longer side chains can be strategically employed to design polymers with extremely low thermal conductivity that favors thermoelectric applications.
Experimentally, a polymer's backbone and side chain can be altered by modifying the monomer segments during chemical synthesis. Adding molecules to the backbone or side chains post-polymerization does not yield a covalently bonded and uniformly distributed alteration throughout the polymer structure. Liu et al.254 copolymerized or doped 2,4,5,7-tetraamino-1,8-dihydroxyanthracene-9,10-dione (4NADA) into the backbone of polyimide (PI) and observed a threefold increase in thermal conductivity at a 10% loading of 4NADA as shown in Fig. 16(d). This enhancement was attributed to the improved intermolecular interactions and heightened structural order facilitated by integrating 4NADA into the polymer backbone. The exploration of doping or polymerization techniques to modulate thermal conductivity, whether to increase or decrease it, has yet to be extensively studied. However, identifying an appropriate combination of these techniques could yield materials with optimized thermoelectric properties or as thermally conductive thermal interface materials.
5.4 Molecular conformation
Molecular conformation refers to the specific spatial shape adopted by a molecule due to the arrangement of its constituent atoms and bonds. In the context of thermal transport along a polymer chain or within the bulk material, the collective molecular conformation of monomer segments can have a significant effect, as molecular conformation is not static and is susceptible to change from factors beyond the monomer level. For example, the lack of long-range order in amorphous regions of polymers leads to complex and irregular molecular conformations.258Three key factors influencing molecular confirmation are chain rotation, dihedral energy, and the nature of chemical bonds and atoms. Chain rotation involves the twisting or turning of monomer segments around their connecting bonds that link them to the rest of the chain. An elevation in the chain rotation factor corresponds to a direct decrease in thermal conductivity, as shown in Fig. 17(a). This decrease stems from a reduction in phonon group velocity, resulting from diminished stiffness from an elevated chain rotation factor.256 Dihedral energy is the potential energy associated with the rotation of two interconnected chemical groups around a single bond axis. Increased dihedral energy leads to improved lattice order and higher strain, increasing thermal conductivity257 (Fig. 17(b)).
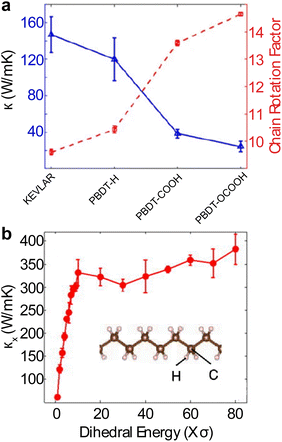 | ||
| Fig. 17 Molecular confirmation effects on thermal conductivity. (a) Thermal conductivity of stretched single chain as a function of chain rotation factor for Kevlar (polyparaphenylene terephthalamide) and PBDT (poly(2,2′-disulfonyl-4,4′-benzidine terephthalamide)) derivatives. Reproduced with permission.256 Copyright, 2019, Journal of Materials Research. (b) Thermal conductivity of single polyethylene chain with varying dihedral energy. Reproduced with permission.257 Copyright, 2012, American Institute of Physics – JAP. | ||
Furthermore, certain atoms or molecules within the polymer chain can introduce more significant disorders than others. Liu et al.224 found that poly(methylene oxide) exhibits a lower thermal conductivity than PE due to the oxygen atom's introduction of mass disorder in the poly(methylene oxide) chain—a notable finding by Zhang et al.5 pertains to pi-conjugated polymers, where the overlap of p-orbitals suppresses chain rotation, thereby reducing phonon scattering. Their research underscores that from a molecular conformation perspective, the pi-conjugated polymers are optimal for generating highly thermally conductive nanofibers due to their organized backbones, strong bonds, and robust dihedral angles.
5.5 Inter- and intra-molecular interactions
Intermolecular interactions refer to the forces of attraction or repulsion between molecules in a polymer. These interactions are classified into van der Waals forces (London dispersion, Keesom, and Debye interactions), hydrogen bonding (H-bond), electrostatic, and ion–dipole interactions. The strength and nature of these interactions significantly influence phonon transport between chains. For instance, in crystalline polymers, interchain H-bonds can act as “soft grips”, limiting the twisting motion of polymer chains and enhancing thermal conductivity259 (Fig. 18(a)). In contrast, intramolecular interactions are the forces that bind the atoms within a molecule together, dictating the molecule's structure and stability. These interactions encompass covalent, ionic, and metallic bonds. The strength or energy associated with these interactions profoundly impacts the polymer's thermal conductivity.79 The energy tied to bond stretching and angular bending potential affects the rigidity of the molecular structure. When these interactions intensify, they limit the mobility of the polymer chains, which minimizes phonon scattering and boosts thermal conductivity, as illustrated in Fig. 18(b).260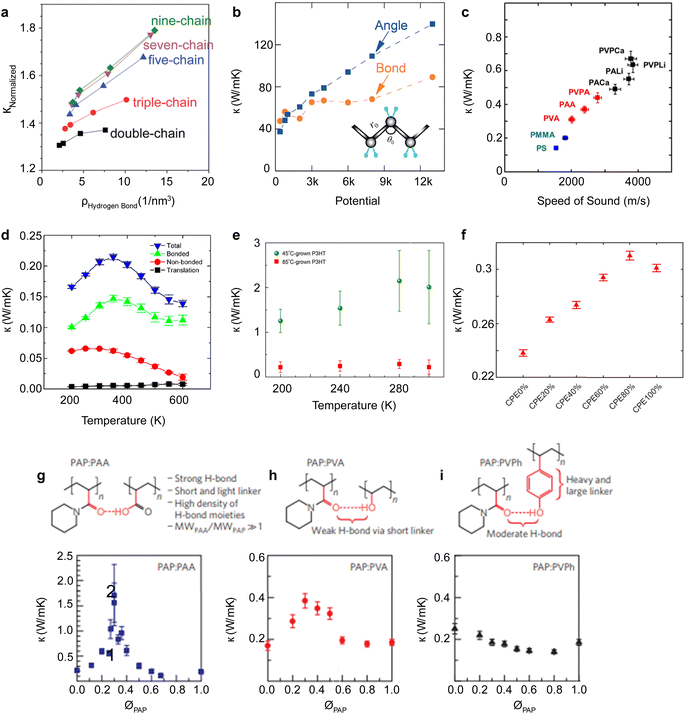 | ||
| Fig. 18 Effect of inter- and intra-molecular interactions. (a) Normalized thermal conductivity of 20 nylon nanosheets versus different density of hydrogen bonds for different number of chains (the thermal conductivity of each nanosheet is normalized by that of a nylon single chain (m = 1) that has the same type). Reproduced with permission.259 Copyright, 2015, Royal Society of Chemistry – Advances. (b) Thermal conductivity as a function of bond stretching and angular bending potential. Reproduced with permission.260 Copyright, 2019, American Institute of Physics – JAP. (c) Speed of sound and thermal conductivity of different polymers with same backbone, PS and PMMA (blue symbols) dominated by van der Waals interactions, PVA, PAA, and PVPA (red symbols) dominated by hydrogen-bond interaction, and PALi, PACa, PVPLi, and PVPCa (black symbols) are polymer salts with ionic interchain bonds. Reproduced with permission.261 Copyright, 2017, American Physical Society – PRB. (d) Bonded, non-bonded, and covalent contributions to total thermal conductivity for amorphous polyethylene tangled chains with varying temperatures. Reproduced with permission.262 Copyright, 2016, American Chemical Society – JPCB. (e) Thermal conductivity for poly(3-hexylthiophene) (P3HT) films grown using oxidative chemical vapor deposition at two different temperatures. Reproduced with permission.128 Copyright, 2018, Science – SA. (f) Thermal conductivity of liquid crystal polyester with a change of the ratio of hydrogen bond donor. Reproduced with permission.263 Copyright, 2023, Wiley – JAPS. (g) Thermal conductivity of PAP:PVA at various mole fractions of PAP, (h) thermal conductivity of PAP:PVPh at various mole fractions of PAP, (i) Thermal conductivity of PAP:PVPh at various mole fractions of PAP. Reproduced with permission.264 Copyright, 2014, Nature Materials. | ||
The energy associated with different types of interactions varies significantly: van der Waals forces have an energy of (ε) ∼ 0.01 eV, H-bond has an energy (ε) ∼ 0.1 eV, and intermolecular bonding has an energy of (ε) ∼ 1–10 eV. Xie et al.261 calculated the speed of sound for different bulk polymers, which is related to thermal conductivity from eqn (9). Their findings suggested that polymers characterized by weak van der Waals interactions exhibit the lowest speed of sound, followed by those with hydrogen bonds and ion bonds. This shows that phonon velocity (the speed of sound) increases with the strength of molecular interactions, as shown in Fig. 18(c).
Molecular interactions are subject to external physical effects such as temperature, pressure, pH level, and humidity. As the temperature increases, the contribution of van der Waals interactions to the total thermal conductivity diminishes262 (Fig. 18(d)). This decrease can be attributed to diminished material weight density and increased molecular spacing at elevated temperatures. Moreover, the vibrational energy of molecules rises with temperature, often surpassing the energy of van der Waals forces at room temperature (vibrational energy at room temperature is ∼kBT = 26 meV). Concurrently, the contribution of translational (diffusivity) movements to thermal conductivity intensifies at higher temperatures. Different polymerization techniques and control of external conditions make it possible to engineer molecular interactions to tailor the thermal conductivity of polymers to desired specifications. The discussion on the effect of external control on thermal transport and thermoelectricity in polymers is detailed below in Section 7.
Experimentally, bottom-up synthesis methods, involving either modification of the synthesis procedure or adding foreign molecules, are commonly used for engineering molecular interactions and are summarized below.
Xu et al.128 grew thin films of poly(3-hexylthiophene) (P3HT) using the oxidative chemical vapor deposition (oCVD) method, which showed stronger conjugated carbon–carbon double bonds along the extended polymer chains and stronger π–π stacking interactions between chains when compared to chemically synthesized P3HT film. Notably, the thermal conductivity of P3HT films grown at a relatively lower temperature of 45 °C is higher than films grown at 85 °C, as depicted in Fig. 18(e). The enhancement observed in lower temperature growth is attributed to better bond formation and chain alignment.
Wu et al.263 made a liquid crystal co-polyester (CPE) with varying ratios of H-bond donor molecules. Their findings revealed that at an H-bond donor ratio of 80%, the intermolecular forces reached their strongest, resulting in a 25% enhancement in thermal conductivity and a 21-fold increase in strength compared to the CPE without an H-bond donor (Fig. 18(f)).
Kim et al.264 delved into diverse H-bonding strategies employing poly(N-acryloyl piperidine) (PAP) as the receptor and introducing polyacrylic acid (PAA), poly(vinyl alcohol) (PVA), and poly(4-vinyl phenol) (PVPh) as donors. Their study revealed a range of interactions, with PAP and PAA forming the strongest hydrogen bond, PAP and PVPh generating a moderate H-bond, and PAP and PVA establishing a weaker H-bond. As depicted in Fig. 18(g), at a PAP mole fraction of 0.3, a peak in thermal conductivity at 1.5 W m−1 K−1 was observed, about 7.5 times higher than the individual components. This increase is due to the homogeneous distribution of strong H-bonds at a concentration that exceeded the percolation threshold.
Understanding how these molecular interactions affect phonon behavior and thermal transport, coupled with the precision engineering of polymer structures, is crucial in designing polymers with tailored thermal properties. Such advancements pave the way for next-generation materials in various applications, from efficient thermoelectric devices to effective thermal interface materials, demonstrating the impact of molecular-level modifications on macroscopic thermal behavior.
5.6 Covalent cross-linking
Covalent cross-linking refers to forming strong chemical bonds between polymer chains or molecules, creating a 3D network. Introducing cross-linkers to a polymer provides additional thermal transport pathways and restricts chain rotation, bending, and torsion, thereby increasing stiffness. This process introduces a competing effect between introducing additional thermal pathways and increasing stiffness.265,266 The influence of increased cross-linker density on thermal transport varies with the polymer type. For instance, augmenting cross-linking creates new phonon transport channels in inherently stiff crystalline PE. Here, the incremental stiffness change and its effect on thermal transport are relatively minor. However, the additional channels can interfere with the original ballistic channels, creating phonon scattering centers and thus reducing thermal conductivity.Conversely, adding new phonon transport channels through cross-linking in an amorphous system does not necessarily reduce thermal conductivity due to the complex and intertwined channel morphology. Specifically for PE,267 new channels from cross-linking enhance bonded interactions, thus increasing overall thermal conductivity. However, for polystyrene (PS), new phonon transport channels from cross-linking negligibly affect thermal conductivity, a behavior attributed to the strong structural heterogeneity of amorphous PS, which already includes a dense network of phonon transport channels.
Rashidi et al.268 showed that for two cross-linked poly (methyl methacrylate) (PMMA) chains, thermal transport along covalent cross-linkers is insignificant when compared to transport along the backbone. Consequently, the addition of cross-linkers increased thermal conductivity. Intriguingly, the study demonstrated that when the cross-linker is of shorter length, it brings the polymer chains closer, fostering strong non-bonding interactions that, in turn, enhance heat transfer. Fig. 19(a) further illustrates that the contribution of cross-linking interactions to thermal conductivity is 3–10 times higher than that of other covalent interactions, highlighting the significant role of cross-linking in modulating thermal transport in polymers.
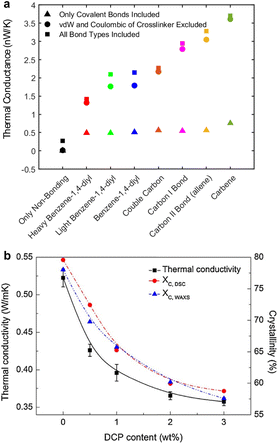 | ||
| Fig. 19 Effect of cross-linking on thermal conductivity. (a) Thermal conductance of polymer chains with different cross-linking species under different conditions of nonbonding interactions. Reproduced with permission.268 Copyright, 2017, American Chemical Society – JPCB. (b) Thermal conductivities and crystallinities of pristine and crosslinked HDPE with varying cross-linker (DCP) content. Reproduced with permission.269 Copyright, 2014, Thermochimica Acta. | ||
Experimentally, Yu et al.269 studied the effect of dicumyl peroxide (DCP) as a cross-linking agent in high-density polyethylene (HDPE). Their findings revealed that as the weight percentage of DCP increases, the polymer's thermal conductivity and crystallinity decreases (Fig. 19(b)). This trend is likely due to DCP's inhibitory influence on the crystallization process of HDPE, which results in reduced crystalline domain size and overall bulk density, thereby affecting the thermal transport properties of the polymer. These findings underscore the importance of carefully selecting the right combination of crosslinker and polymer to manage the undesirable effects of crosslinking.
5.7 Crystallinity, strain, and stiffness
Generally, increased polymer crystallinity (χ) leads to a monotonous rise in thermal conductivity271,272 due to the increased phonon transmissivity. However, variations in thermal conductivity across different crystalline structures are attributed to differences in phonon group velocities273 and relaxation times of different phonon modes.274,275 Many polymers exhibit a semi-crystalline nature, characterized by a mixture of crystalline and amorphous regions.276,277 The interface between these regions, known as the interlamellar region, introduces additional phonon scattering due to complex molecular bridges, loops, folds, and tails,278 as visualized in Fig. 20(a).279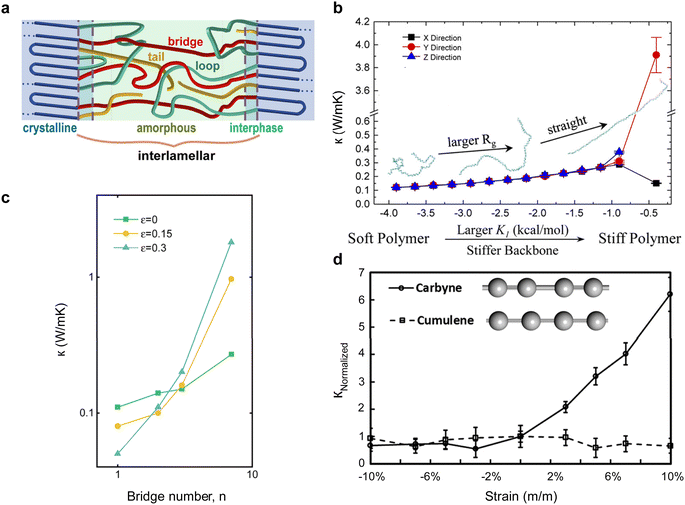 | ||
| Fig. 20 Effect of stiffness and strain on a polymer. (a) Schematic of interlamellar region showing tail, bridge, and loop. Reproduced with permission.270 Copyright, 2021, American Institute of Physics – JAP. (b) Change in thermal conductivity for different directions with an increase in energy constant of dihedral angle energy (stiffness of backbone). Reproduced with permission.262 Copyright, 2016, American Chemical Society – JPCB. (c) Change in thermal conductivity with increasing bridge number in the interlamellar region of the polymer, under different strain rates. Reproduced with permission.270 Copyright, 2021, American Institute of Physics – JAP. (d) Normalized thermal conductivity as a function of tensile strain for carbyne and cumulene. Reproduced with permission.231 Copyright, 2015, Nature. | ||
Strain in semi-crystalline polymer exists within the interlamellar region, influenced by molecular bridges and loops. An increase in strain typically increases thermal conductivity257,280,281 as it straightens the loops and folds in the region. However, such an increase might be confined to the strain direction, potentially decreasing the thermal transport in other directions.282 The impact of strain on thermal conductivity depends on the presence of loops and bridges that can be straightened; therefore, polymers with few bridges will show a minimal effect from strain,270 as shown in Fig. 20(c). In polymers with low crystallinity and high loop numbers, the increased strain may result in tails and broken chains, reducing molecular weight and thermal conductivity. In contrast, highly crystalline polymers with small interlamellar regions allow for the straightening of loops and bridges without breakage, thus preserving the polymer structure.
For single-chain polymers, strain only pertains to the stretching of bonds in the backbone, which can weaken the bond energies. This weakening leads to increased phonon lifetime and decreased phonon group velocity, both of which influence thermal conductivity in a competing fashion. In unsaturated single-chain hydrocarbons, the effect of strain varies; for example, strain rate does not affect the thermal conductivity of cumulene but increases that of carbyne,231 as shown in Fig. 20(d). It can be surmised that in cumulene, the improvement in thermal conductivity due to increased phonon relaxation time is counterbalanced by a deterioration in thermal conductivity by decreased phonon group velocity.
Crystallinity and stiffness in polymers are two interconnected physical effects. Typically, a polymer with high crystallinity also demonstrates a high Young's modulus.111 Crystallinity can only increase the thermal conductivity to the limit of inhibiting molecular interactions. For instance, the carbon–carbon bond with the high covalent bond stiffness would be expected to possess exceptional thermal conductivity. However, the presence of H-bonding283 and permanent dipoles in polymers with carbon backbones introduces intermolecular interactions that hinder them from achieving phonon transmission efficiency akin to that of crystalline diamonds. A key factor determining the thermal transport in semi-crystalline polymers is persistence length—an intrinsic property characterizing polymer chain stiffness. A larger persistence length facilitates the adoption of an extended chain morphology, leading to significantly increased thermal conductivity. This effect arises from the ability of an extended chain structure to support longer thermal transport channels along the covalently bonded backbone (Fig. 20(b)).
Many experimental studies have investigated the influence of crystallinity,115,118,241,275,284,285 crystalline size,114,118,241,284 and stiffness111,115,286–288 on the thermal conductivity of polymers. Notably, Zhu et al.241 observed that crystallinity reduced with drawing of PE films but still led to increased thermal conductivity. This counterintuitive behavior is attributed to the fact that the decrease in thermal conductivity caused by the reduction of crystallinity is outweighed by the increase in thermal conductivity due to chain alignment caused by the increase in strain. This finding highlights the complex relationship between crystallinity and strain affecting thermal transport properties in polymers. Exceptionally high thermal conductivities of up to 100 W m−1 K−1 were observed when PE nanofibers were subjected to increased strain through stretching or drawing.94 As the draw ratio increases, crystallinity228 and Young's modulus increase significantly. Notably, Choy et al.229 measured that a draw ratio 200 for PE tape resulted in a shift of crystallinity from 81.8% to 92.6%, accompanied by a significant increase in thermal conductivity from 1 W m−1 K−1 to 30 W m−1 K−1.
Other than post-synthesis approaches like drawing, annealing, and external pressure to change the crystallinity of polymers, bottom-up synthesis approaches can also alter crystallinity and are often more effective than post-synthesis techniques, which typically increase crystallinity by a few percentage points. Petran et al.289 conducted a notable study involving the synthesis of poly(benzofuran-co-arylacteic acid) and poly(tartronic-co-glycolic acid) under enzymatic conditions-Novozym-435. This research revealed a remarkable increase in thermal conductivity up to 265%. The enhancement was attributed to the augmentation of crystallinity achieved through enzymatic synthesis conditions.
Furthermore, Lv et al.290 investigated ethylene vitrimer, a unique material with dynamic covalent (B–O) bonds capable of slow exchange reactions at room temperature without needing a catalyst. This exceptional property facilitated gradual crystallization over seven days, resulting in a notable increase in thermal conductivity from 0.1 W m−1 K−1 to 1 W m−1 K−1. This enhancement occurred without any extrinsic influences. These findings exemplify how controlled crystallinity manipulation can offer practical strategies for engineering thermal conductivity in polymer materials.
5.8 Interrelated thermal and charge transport in OSCs: validity of Wiedemann–Franz law
Another topic that has fundamental and practical interest and is worth highlighting here is the study of the Wiedemann–Franz (WF) law in semiconducting polymers. Strong violation of WF law provides insight into the unexplored charge and thermal transport mechanisms in inorganic materials. Furthermore, the definition of Lorentz number in WF law is part of ZT (∼S2/L), when charge carrier contribution of thermal conductivity is much higher than phonon contribution (κphonon ≪ κel).291 In a free electron gas model, the Lorenz number is given by the Sommerfeld value (L0 = 2.45 × 10⁻⁸ W Ω K−2), and has been consistently observed in inorganic thermoelectric materials.292 However, organic thermoelectric materials often exhibit a Lorenz number that can deviate significantly from the Sommerfeld value, indicating that the WF law does not strictly apply to organic semiconductors (OSCs).293
For charge carrier contribution to thermal conductivity to be observable, electrical conductivity should be greater than 100 S cm−1 so that κel ∼ κphonon, since total thermal conductivity is the sum of both (κ = κel + κphonon). Experimentally, it is challenging to separately identify κphonon and κel contributions to the total thermal conductivity.296 With this in mind, experimental measurements with σ > 100 S cm−1 and dimensionless Lorenz number  less than one are tabulated in Table 3. This indicates a WF law violation, even if the phonon contribution is assumed to be zero (κphonon = 0). Consistent L* values between 0.3 and 0.8 for untreated PEDOT:PSS across different studies suggest a systematic violation of the WF law rather than an experimental error.
| Polymer | σ (S m−1) | κ (W m−1 K−1) | T (K) | κL 0 σ −1 T −1 | Ref. |
|---|---|---|---|---|---|
| PEDOT:ClO4 | 7.75 × 10⁴ | 0.35 ± 0.02 | 300 | 0.62 | 177 |
| PEDOT:PF6 | 10 × 104 | 0.22 ± 0.02 | 300 | 0.3 | 177 |
| PEDOT:BTFMSI | 20.75 × 10⁴ | 0.19 ± 0.02 | 300 | 0.13 | 177 |
| PEDOT:PSS | 9 × 10⁴ | 0.52 ± 0.11 | 297 | 0.8 | 165 |
| PEDOT:PSS | 9.6 × 10⁴ | 0.31 ± 0.05 | 295 | 0.44 | 298 |
| P(EtOPV-co-PV) | 3.5 × 10⁴ | 0.25 | 313 | 0.94 | 184 |
| PANI:CSA | 2.5 × 10⁴ | 0.02 | 300 | 0.11 | 55 |
| PEDOT (gate) | 7.5 × 10⁴ | 0.35 ± 0.02 | 300 | 0.64 | 168 |
| PEDOT:PSS (MAI treated) | 18.7 × 10⁴ | 0.29 ± 0.02 | 300 | 0.2 | 166 |
| PEDOT:PSS | 7.5 × 10⁴ | 0.37 ± 0.02 | 300 | 0.68 | 158 |
| PEDOT:PSS | 12 × 104 | 0.26 ± 0.03 | 300 | 0.3 | 44 |
To further demonstrate the violation of the WF law when L* > 1, the contribution of phonon thermal conductivity in a polymer is assumed to be between (0.1 ≤ κphonon ≤ 0.6 W m−1 K−1) for all experimental studies that showed L* > 1 with κphonon = 0. Under this assumption, a modified Lorenz number is calculated, and a ratio between the Lorenz number and the Sommerfeld value  is plotted in Fig. 21(a). The results show that the modified Lorenz number can be up to four times greater than the Sommerfeld value, providing further evidence of the WF law's violation in both directions relative to the Sommerfeld value. When κ ∼ 1 W m−1 K−1, a thermal conductivity change is observed with changing dopant level or electrical conductivity, as shown in Fig. 21(b), with a constant Lorenz number. This is likely because κel > κphonon. However, when thermal conductivity is small, no change was observed with changing oxidation level (or electrical conductivity).
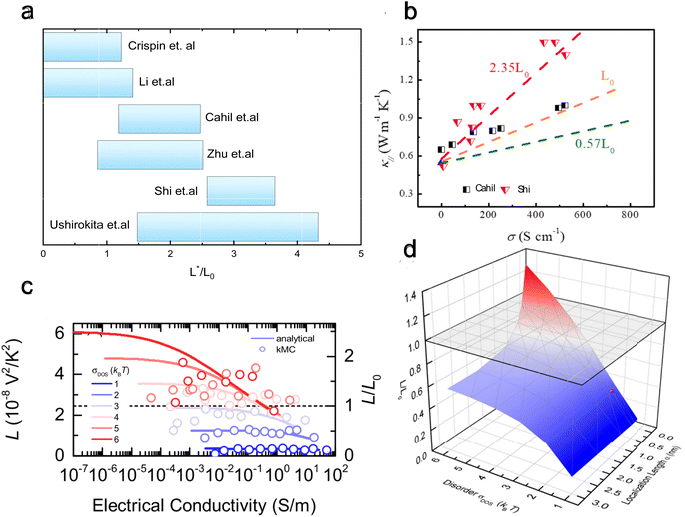 | ||
| Fig. 21 Wiedemann Franz law in polymeric thermoelectric materials. (a) Range of dimensionless Lorenz number for different experimental studies54,157,199,294–296 (σmin > 100 S cm−1) with respect to the Sommerfield value for a phonon thermal conductivity range of 0.1–0.6 W m−1 K−1. (b) Thermal conductivity with varying electrical conductivity for two different studies.54,296 Reproduced with permission.291 Copyright, 2022, Applied Materials Today. (c) Lorenz number and dimensionless Lorenz number from the analytical model (solid lines) and kinetic Monte Carlo simulations (symbols) for different energetic disorder values; the dashed line is when Lorenz number is same as Sommerfield value, (d) Dimensionless Lorenz number for varying energetic disorder and localization length for a carrier concentration of 0.1. Reproduced with permission.297 Copyright, 2020, American Physical Society – PRB. | ||
Scheunemann and Kemerink297 conducted theoretical and computational studies to investigate the validity of WF law in organic semiconductors (OSCs) using analytical models and kinetic Monte Carlo (kMC) simulations based on hopping transport mechanisms. Their study varied parameters such as energetic disorder (σDOS ∼ kBT) and charge carrier localization length (α) to understand how these factors influence the Lorenz number. As previously discussed, adding a dopant introduces defects (altering localization lengths) and changes the density of states (DOS), thus modifying the energetic disorder.
Their findings revealed that the Lorenz number in OSCs can deviate from the Sommerfeld value in both directions, being either greater or lower, depending on the charge carrier localization length, energetic disorder, and charge carrier concentration (Fig. 21(d)). A notable observation from their study is that to achieve high electrical conductivity or charge carrier concentration, the σDOS needs to be very narrow (Fig. 21(c)). Under such conditions, they suggested that a figure of merit (ZT) greater than three could be achievable using OSCs with large localization lengths (greater than 3 nm), σDOS = kBT, and high electrical conductivity (σ = 1 × 10⁵ S m−1). However, as electrical conductivity increases, the phonon contribution to thermal conductivity might not remain negligible and could become dominant, mirroring challenges faced in inorganic thermoelectric materials.
The WF law is violated in OSCs. Different polymers have different Lorenz numbers, often determined by their unique amorphous nature and dependent on the synthesis procedure. This indicates that understanding and manipulating these molecular and material characteristics for thermoelectric applications using OSCs is crucial for optimizing performance.
6. External control of thermal transport and thermoelectricity in polymers
Besides the intrinsic effects that affect polymers' transport and thermoelectric properties, recent years have seen an increasing amount of research studying the extrinsic effects and potential dynamic control of thermal transport and thermoelectricity in polymer materials. For thermal transport, environmental effects such as temperature and pressure play a critical role, as they can induce phase transitions that change the molecular conformation and orientation of the backbone. For organic thermoelectricity, the doped state of the conjugated polymer exhibits high sensitivity to external factors, including exposure to air, light, and varying temperatures. We will summarize recent results on the above topics and highlight how these external control capabilities can significantly tune polymer materials' thermal and energy conversion performance.6.1 Glass transition temperature (Tg)
The glass transition temperature (Tg) is the temperature point at which an amorphous or semi-crystalline polymer transition from a glassy, rigid state to a more rubbery or flexible state (Fig. 22(a)). Below Tg the polymer has low molecular mobility and is an anharmonic lattice, and above Tg it is more mobile and is in a higher disordered state. The change in phonon group velocities during this transition can significantly impact the thermal conductivity of the polymer.302 Understanding the range of phase transition temperatures is crucial, as it can influence the applicability of highly conductive polymers over a wide temperature range.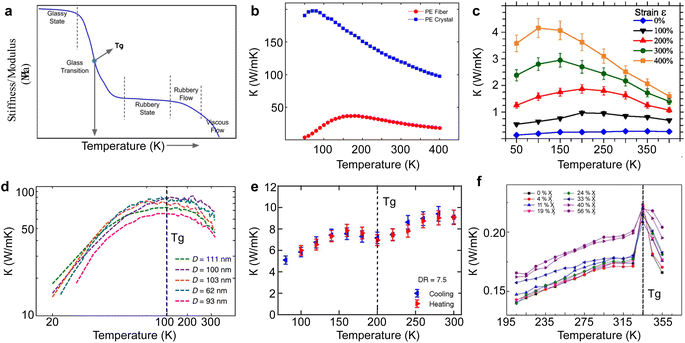 | ||
| Fig. 22 Effect of glass transition temperature on thermal conductivity. (a) Qualitative plot showing stiffness transition through glass transition temperature; (b) theoretical work: a comparison between PE crystal and PE fiber showing different behavior with changing temperature. Reproduced with permission.299 Copyright, 2019, American Chemical Society – CM. (c) Theoretical work: amorphous PE thermal conductivity with change in temperature for different strain rates. Reproduced with permission.300 Copyright, 2018, American Institute of Physics – JAP. (d) Experimental work: thermal conductivity with varying temperatures for ultra-high molecular weight polyethylene nanofibers. Reproduced with permission.94 Copyright, 2018, Nature Communications. (e) Experimental work: thermal conductivity of semi-crystalline polyethylene films showing a dip at glass transition temperature. Reproduced with permission.284 Copyright, 2019, Proceedings of the National Academy of Sciences. (f) Experimental work: effect of crystallinity on thermal conductivity change around glass transition temperature. Reproduced with permission.301 Copyright, 2018, Journal of Materials Science. | ||
Morikawa et al.303 have theoretically studied and shown that bulk polymers exhibit varying thermal conductivity with temperature before reaching Tg. However, the thermal conductivity becomes asymptotic beyond Tg and shows less sensitivity to temperature changes as there are competing effects between phonon group velocity and relaxation time. Utimula et al.299 conducted an in-depth study using ab initio methods to analyze the temperature dependence of thermal conductivity in different polymer crystals and fibers. Their findings revealed distinct trends for these two forms of polymers. In polymer crystals, the thermal conductivity tends to increase as the temperature decreases. In contrast, the thermal conductivity for polymer fibers demonstrates a parabolic trend with temperature, often peaking at Tg, as illustrated in Fig. 22(b).
Muthaiah et al.300 conducted a study investigating the impact of temperature on amorphous polyethylene, considering various strain rates. The results demonstrated that the peak thermal conductivity occurs at Tg, and this temperature decreases with increased strain rate (Fig. 22(c)). They explained that increasing strain decreases disorder, allowing anharmonic scattering to dominate at lower temperatures as there will be a crossover from disorder to anharmonicity at Tg.
High-density PE nanofiber has a glass transition temperature close to 100 K, and Shrestha et al.94 have conducted experimental measurements and showed a distinct thermal conductivity peak at this temperature for nanofibers, as illustrated in Fig. 22(d). Contrarily, Robbins et al.284 conducted a study involving bulk PE films and identified a dip in thermal conductivity precisely at Tg, as shown in Fig. 22(e). This observation contradicts the findings from other nanofiber experiments, yet it still suggests a significant structural order alteration occurring at—similarly, Bai et al.301 investigated the thermal conductivity of poly-L-lactide (PLLA) with varying crystallinity. Their results indicated that the peak in thermal conductivity observed at Tg undergoes a less abrupt change for higher crystalline PLLA, as depicted in Fig. 22(f). This observation agrees with the previously discussed theoretical predictions from Utimula et al.,299 showing crystalline materials do not affect Tg.
6.2 External temperature and pressure
External pressure can modify chain packing and increase the crystallinity of a material, while external temperature can alter molecular conformations. However, the direction of change in thermal conductivity with temperature is polymer-dependent due to the various competing factors. Utilizing MD simulations, Zhou et al.43 probed the thermal behavior of two organic compounds, namely N,N-dicarbazolyl-3,5-benzene (mCP) and N,N′-diphenyl-N,N′-di(3-methylphenyl)-(1,1′-biphenyl)-4,4′-diamine (TPD). Their investigation revealed an inverse relationship between thermal conductance and temperature. Conversely, thermal conductance directly correlated with pressure, with elevated pressure enhancing thermal conductivity and thermal diffusivity, attributed to increased phonon group velocity. Concurrently, a decline in specific heat was observed, highlighting the complex interplay of thermal properties under varying environmental conditions.304In an extreme thermal environment, Zhong et al.129 conducted a detailed study on nylon-11 nanofibers subjected to annealing at 500 K. The resultant fibers exhibited substantially lower thermal conductivity than their pre-annealed counterparts. Notably, the unmodified fiber displayed a pronounced peak in thermal conductivity at its glass transition temperature of 330 K, but the peak was absent in annealed fiber. This absence is attributed to the breaking of polymer chains during the annealing process, resulting in shorter chains forming. These shorter chains introduce additional phonon scattering centers, thereby reducing the overall thermal conductivity of the material.
6.3 Dynamic thermal transport in intrinsic polymers
The ability to control thermal pathways can be used to create dynamic and regulatory thermal devices in analogy to electrical devices such as diode,305 gate, regulator, switch,306 rectifier,307,308 memristor, and transistor.309 One common way to achieve thermal regulation is through molecular structural changes caused by phase transition,310 which can be achieved from temperature control, light-triggered transitions, and strain. Further, thermal rectification, i.e., thermal diode, can be achieved by having a polymer with two distinct phases, with one phase at the cold end and the other phase at the hot end,311 leading to directional heat flow similar to that in a semiconductor diode.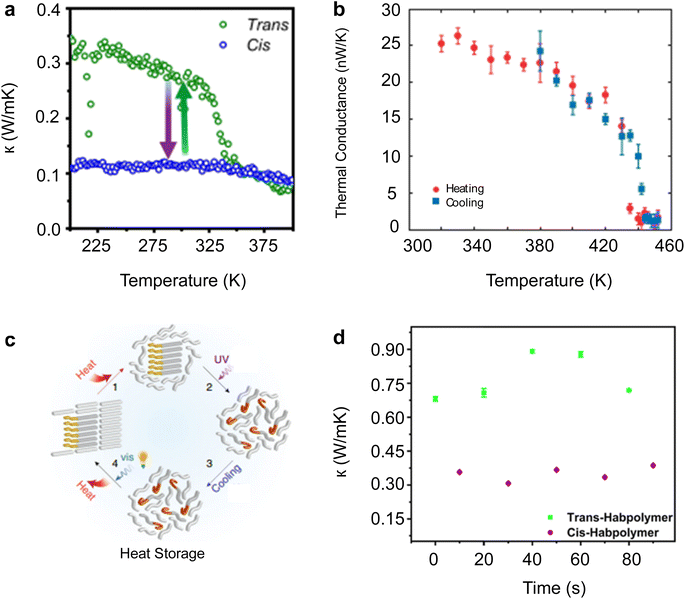 | ||
| Fig. 23 Dynamic thermal control in polymers. (a) Thermal switching achieved from light-triggered azobenzene. Reproduced with permission.42 Copyright, 2019, Proceedings of National Academy of Sciences. (b) Thermal switching was achieved from the phase transition of polyethylene at 440 K. Reproduced with permission.312 Copyright, 2019, Science – SA. (c) Thermal storage mechanism using azobenzene. Reproduced with permission.315 Copyright, 2017, Nature Communications. (d) Thermal conductivity switching cycle using light-triggered Habpolymer. Reproduced with permission.316 Copyright, 2023, American Chemical Society – APM. | ||
6.4 Tuning polymer thermoelectricity via external temperature
The energy conversion efficiency of a thermoelectric material is directly related to the temperature gradient between its hot and cold sides. In the context of using thermoelectric generators (TEGs) to convert human body heat into electricity, the maximum Carnot efficiency noted is about 6%.319 Additionally, for a thermoelectric material with ZT of 1, only about 1% efficiency can be achieved, as illustrated in Fig. 24(a). Consequently, TEGs using body heat are suitable for low-power-demand applications like biosensing.320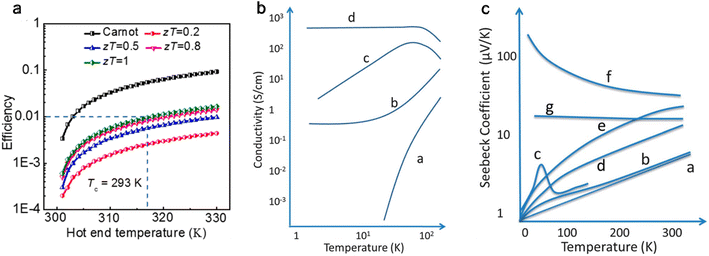 | ||
| Fig. 24 External temperature effects on thermoelectric polymers. (a) Carnot efficiency and power generation efficiency for materials with different ZT with ambient temperature as cold side temperature. Reproduced with permission.319 Copyright, 2021, Progress in Material Science. (b) Different cases for the effect of temperature on electrical conductivity, (c) for the effect of temperature on the Seebeck coefficient. Reproduced with permission.140 Copyright, 2012, Royal Society of Chemistry – EES. | ||
The temperature dependence of electrical conductivity varies significantly with the degree of disorder and doping in the polymers. In general, conductivity increases with temperature for disordered samples due to thermally activated hopping processes. For samples with a certain degree of structural order, there might be transitions from insulating to metallic behavior as temperature decreases.140 Here, the temperature dependence on electrical conductivity is broadly classified into four cases depending on the charge transport mechanisms and their activation energy, as shown in Fig. 24(b). Case-(a) represents electrically insulating disordered polymers (because of high activation energy), dominated by thermal hopping transport.295,321,322 Case-(b) some polymers undergo metal-to-insulator transition as the temperature decreases. This transition is attributed to improved electronic coupling between polymer chains or an increase in the inter-chain localization length of the carriers. Case-(c) here, the polymer is transitioning from insulator to metal as temperature increases.323,324 The precise mechanism for this transition is not fully understood. However, some models consider the role of three-dimensional metallic regions electronically coupled via one-dimensional chains that undergo a decrease in the localization length of the carriers as the temperature decreases. Case-(d) highly doped and ordered conducting polymers that behave like a metal.
Like electrical conductivity, the Seebeck coefficient's dependence on temperature can be classified into seven cases, as shown in Fig. 24(c). Case-(a) conducting polymers with highly p-doped, narrow metallic bands,325 similar to case-(d) from the electrical conductivity. Case-(b) polymer dominated by electron–phonon interaction,326 which does not involve the phonon drag effect. Case-(c) characterized by a hump that disappears at higher temperatures, indicative of phonon drag effects in the material.327–329 Case-(d and e) represents Mott's variable range hopping transport between localized states. This decrease is often characterized by a T1/2 dependence. Case-(f) conducting polymers on the insulating side of the metal-insulator transition.330 This behavior is attributed to the nearest-neighbor hopping thermopower with the Fermi energy within localized states. Case-(g) represents low doping level samples,331 with low charge carrier density. The cases presented above for Seebeck coefficient and electrical conductivity are generalized, and polymers could be more complex, representing a combination of multiple scenarios with temperature. However, one can conclude that organic thermoelectric properties can increase or decrease with temperature.
6.5 Tuning polymer thermoelectricity via humidity effect
Water saturation content varies with humidity levels in the doped conjugated polymer. As water is a high-polar molecule, it can act as a solvent for de-doping and affect thermoelectric properties significantly.332 Additional water can reduce the coulombic interaction between the PEDOT and PSS chains, facilitating better carrier mobility.333 Kim et al.44 studied the effect of humidity on the thermoelectric properties of PEDOT:PSS. For films with PSS content (more hydrophilic), the electrical conductivity was observed to decrease with increasing humidity. A higher PSS content leads to greater water absorption, swelling the film and likely increasing the tunneling distance between PEDOT molecules, which reduces electrical conductivity.On the other hand, PEDOT:PSS EG-treated films have less PSS and hence less water absorption; the electrical conductivity increases with increasing humidity. The increase is attributed to a reduction in the binding energy of mobile holes on PEDOT and possibly due to the re-alignment of PEDOT chains by solvent vapor annealing effects. These factors lead to increased mobility of charge carriers, outweighing the adverse effects of increased tunneling distance due to swelling. However, the Seebeck coefficient increases with humidity, regardless of the PSS content for both pristine and EG-treated PEDOT:PSS films. This increase indicates a reduction in carrier concentration and, potentially, scattering while carrier mobility increases. The overall impact increases the power factor with humidity, as shown in Fig. 25. Varying the humidity of the environment is a promising technique for dynamically controlling the thermoelectric performance of the OSCs.
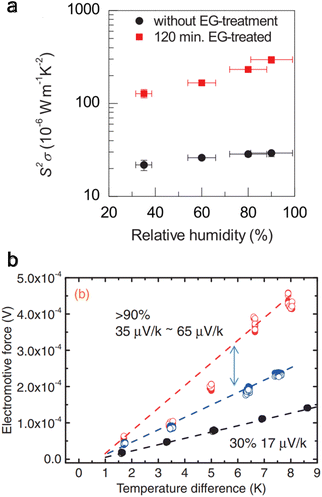 | ||
| Fig. 25 Effect of relative humidity on thermoelectric properties. (a) The power factor for pristine and 120 min EG-treated PEDOT:PSS films at varying humidity. Reproduced with permission44 Copyright, 2016 American Physical Society – APL. (b) Thermoelectric voltage for varying temperatures and different humidity variations. Reproduced with permissions.333 Copyright, 2014, The Japan Society of Applied Physics – APE. | ||
7. Conclusions and outlook
This review presents our theoretical understanding of experimental progress on thermal transport and thermoelectricity in polymer materials based on molecular and nanoscale perspectives. In contrast to the vast amount of literature on charge transport in organic semiconductors and thermal transport and thermoelectric studies in inorganic materials, obtaining the fundamental structure–property-function relationship between molecular-scale constituents and their thermal functions remains an open question. We conclude this review by discussing some open challenges in the field.7.1 Isotropically high thermal transport in polymers
Amorphous bulk polymers typically exhibit low isotropic thermal conductivity335 below 0.5 W m−1 K−1. In many applications, a high isotropic thermal conductivity is desirable to reject or absorb heat dissipated by the operating devices uniformly. However, commonly used techniques to enhance the thermal conductivity of polymers, such as stretching for chain alignment, modifying backbone, and engineering molecular conformation, tend to result in anisotropic thermal conductivity, with the conductivity along the non-backbone directions maintaining nearly bulk values125 (Fig. 26(a)). Exacerbating the problem, a study from Choy et al.336 showed that thermal conductivity in a perpendicular direction to stretching decreased below bulk values. In addition, the thickness of the material can also affect thermal transport for thin film polymers. Anharmonic interactions between surface and bulk phonons can reduce the overall in-plane thermal conductivity,337 suggesting the challenges of designing polymers with high and isotropic thermal conductivity. Recent work by Wang et al.334 explored the thermal conductivity of polyvinylidene (PVDF) films by inducing amorphous nanophases via cross-planar arrangements among the in-plane extended chain crystal lamellae. It was achieved by applying pressures up to 100 MPa in the direction opposite to stretching. This resulted in elevated thermal conductivity in both cross-plane (∼1.99 W m−1 K−1) and in-plane (∼4.35 W m−1 K−1) orientations, effectively rendering the material near thermally isotropic, as shown in Fig. 26(b). In the future, exploring strategies and design methods that could yield moderate-to-high thermal conductivity across all directions in a polymer is of great interest.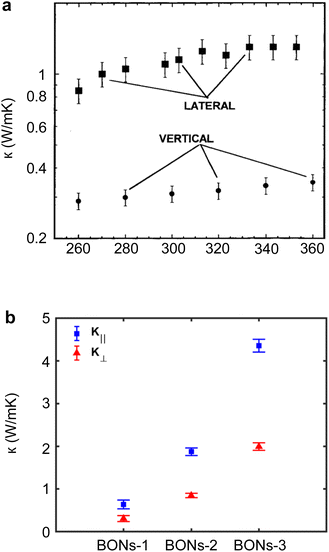 | ||
| Fig. 26 Homogeneity effects of thermal conductivity. (a) Temperature dependence of thermal conductivity anisotropy of a polymer film with a thickness of 2.25 μm. Reproduced with permission.125 Copyright, 1999, Journal of Microelectromechanical Systems. (b) Thermal conductivity of polyvinylidene (PVDF) film showing near isotropic behavior by engineering the lamellae. BON-1 is 10 MPa, BON-2 is 50 MPa, and BON-3 is 100 Mpa. Reproduced with permission.334 Copyright, 2023, Polymers. | ||
7.2 Nanoscale and single-molecule level study of thermal transport and thermoelectricity in polymers
Determining the ultimate thermal transport and thermoelectric properties of both electrically insulating and semiconducting molecules and polymers is challenging due to the strong heterogeneity in both the structural and energetic distribution. A polymer structure's inherently existing crystalline, amorphous, and crossover regimes naturally possess distinct thermal transport properties. Further, widely studied thermoelectric polymers such as PEDOT:PSS are non-homogeneous material systems with PEDOT-rich and PSS-rich domains. While controlling polymer morphology is challenging, it is essential to perform nanoscale studies to understand polymer structures' spatial heterogeneity and respective transport properties. This can provide insights into the optimal thermal transport and thermoelectricity in polymers. Specifically, the current strategies to improve polymers' ZT have focused on understanding electrical conductivity and Seebeck coefficients to maximize the power factor. One can also focus on the molecular design to achieve low thermal conductivity in semiconducting polymers. Reducing thermal conductivity below 0.1 W m−1 K−1 typically necessitates substantial defects or air gaps within the amorphous polymer structure, akin to those in aerogels. This presents significant challenges in molecular engineering, as it involves balancing between maintaining electrical conductivity while significantly hindering thermal transport, which has yet to be fully explored in OSCs. Molecular design and structuring338 to optimize ZT for inorganic materials have paved the way for materials with ZT to be nearly 3.339,340 Similar strategies are expected to be conducted in organic systems.7.3 Machine learning (ML) guided material discovery of high-performance thermal and thermoelectric polymers
The morphologically heterogeneous nature of polymers and the complicated interactions within the molecular network make the theoretical prediction of physical properties challenging. In recent years, ML methods have emerged as valuable tools in discovering new polymer materials and enhancing the property prediction of existing materials.341 Precisely, leveraging existing databases combined with ML algorithms, researchers can predict new polymer materials and structures with desired thermal and mechanical properties. While material discovery via computational means without human intervention presents challenges, they can be navigated effectively through techniques such as active learning and autonomous experimentation.342 This method accelerates experimental cycles with iterative design, synthesis, and testing, all guided by ML. Along this line, thermal conductivity prediction in polymers is approached using methods like random forest (RF) models and Bayesian neural networks (BNNs). RF models, for instance, predict thermal conductivity from descriptors derived from polymer chemistry trained on comprehensive databases like PoLyInfo.343 Ma et al.344 used an RF model and identified 121 polymers with MD-calculated thermal conductivity above 0.3 W m−1 K−1. Alternatively, BNNs are employed to predict thermal conductivity with an understanding of uncertainty, providing a range of possible values rather than a single-point prediction. Wu et al.345 achieved a mean absolute error of 0.0204 W m−1 K−1 in predicting thermal conductivity using a transferred model from a pre-trained neural network, a 40% improvement compared to a baseline model.While ML has demonstrated considerable potential in transforming the discovery and prediction of polymer physical properties, the precision and dependability of these forecasts are contingent upon procuring extensive, high-quality datasets.346 There is a notable need for such data, particularly concerning newly synthesized or underexplored polymers.347 Advancements in the field require continuous improvement in high-performance computation and high-throughput data acquisition. As these components progressively align, we anticipate an escalation in the influence of ML on polymer thermal science and thermoelectric renewable technologies in the upcoming years.
Author contributions
SY: writing – original draft, conceptualization, and visualization; CM: visualization; LC: writing – review and editing, supervision, and conceptualization.Conflicts of interest
The authors declare no conflict of interest.Acknowledgements
We acknowledge support from the National Science Foundation through a grant from the Thermal Transport Processes Program under NSF CAREER Award No. 2239004.References
- L. Cui, R. Miao, C. Jiang, E. Meyhofer and P. Reddy, J. Chem. Phys., 2017, 146, 092201 CrossRef.
- N. Mehra, L. Mu, T. Ji, X. Yang, J. Kong, J. Gu and J. Zhu, Appl. Mater. Today, 2018, 12, 92–130 CrossRef.
- D. R. Anderson, Chem. Rev., 1966, 66, 677–690 CrossRef CAS.
- A. Henry, Annu. Rev. Heat Transfer, 2014, 17, 485–520 CrossRef.
- T. Zhang, X. Wu and T. Luo, J. Phys. Chem. C, 2014, 118, 21148–21159 CrossRef CAS.
- F. DeAngelis, M. G. Muraleedharan, J. Moon, H. R. Seyf, A. J. Minnich, A. J. H. McGaughey and A. Henry, Nanoscale Microscale Thermophys. Eng., 2019, 23, 81–116 CrossRef CAS.
- A. Fraleoni-Morgera and M. Chhikara, Adv. Eng. Mater., 2019, 21, 1801162 CrossRef.
- S. Liu, J. Duvigneau and G. J. Vancso, Eur. Polym. J., 2015, 65, 33–45 CrossRef CAS.
- M. Goel and M. Thelakkat, Macromolecules, 2020, 53, 3632–3642 CrossRef CAS.
- B. Russ, A. Glaudell, J. J. Urban, M. L. Chabinyc and R. A. Segalman, Nat. Rev. Mater., 2016, 1, 1–14 Search PubMed.
- N. Lu, L. Li and M. Liu, Phys. Chem. Chem. Phys., 2016, 18, 19503–19525 RSC.
- C.-P. Feng, F. Wei, K.-Y. Sun, Y. Wang, H.-B. Lan, H.-J. Shang, F.-Z. Ding, L. Bai, J. Yang and W. Yang, Nano-Micro Lett., 2022, 14, 127 CrossRef CAS PubMed.
- R. Hu, Y. Liu, S. Shin, S. Huang, X. Ren, W. Shu, J. Cheng, G. Tao, W. Xu, R. Chen and X. Luo, Adv. Energy Mater., 2020, 10, 1903921 CrossRef CAS.
- Y. Fang, G. Chen, M. Bick and J. Chen, Chem. Soc. Rev., 2021, 50, 9357–9374 RSC.
- L. Lei, S. Shi, D. Wang, S. Meng, J.-G. Dai, S. Fu and J. Hu, ACS Nano, 2023, 17, 1803–1830 CrossRef CAS PubMed.
- U. Zschieschang, F. Ante, T. Yamamoto, K. Takimiya, H. Kuwabara, M. Ikeda, T. Sekitani, T. Someya, K. Kern and H. Klauk, Adv. Mater., 2010, 22, 982–985 CrossRef CAS PubMed.
- T. Someya, Z. Bao and G. G. Malliaras, Nature, 2016, 540, 379–385 CrossRef CAS PubMed.
- L. Wang, C. Yang, X. Wang, J. Shen, W. Sun, J. Wang, G. Yang, Y. Cheng and Z. Wang, Composites, Part A, 2023, 164, 107320 CrossRef CAS.
- Z. He, C. Zhong, S. Su, M. Xu, H. Wu and Y. Cao, Nat. Photonics, 2012, 6, 591–595 CrossRef.
- L. Shao, A. Raghavan, G.-H. Kim, L. Emurian, J. Rosen, M. C. Papaefthymiou, T. F. Wenisch, M. M. K. Martin and K. P. Pipe, Int. J. Heat Mass Transfer, 2016, 101, 764–771 CrossRef.
- Q. Zhou, H. Li, C. Du, Z. Ye, L. Liang and G. Chen, Nano Energy, 2023, 118, 109007 CrossRef CAS.
- Z. Liu and G. Chen, Adv. Mater. Technol., 2020, 5, 2000049 CrossRef CAS.
- X.-L. Shi, W.-Y. Chen, T. Zhang, J. Zou and Z.-G. Chen, Energy Environ. Sci., 2021, 14, 729–764 RSC.
- W. Ren, Y. Sun, D. Zhao, A. Aili, S. Zhang, C. Shi, J. Zhang, H. Geng, J. Zhang, L. Zhang, J. Xiao and R. Yang, Sci. Adv., 2021, 7, eabe0586 CrossRef CAS PubMed.
- Y. Liu, X. Wang, S. Hou, Z. Wu, J. Wang, J. Mao, Q. Zhang, Z. Liu and F. Cao, Nat. Commun., 2023, 14, 3058 CrossRef CAS PubMed.
- Y. Hao, X. He, L. Wang, X. Qin, G. Chen and J. Yu, Adv. Funct. Mater., 2022, 32, 2109790 CrossRef CAS.
- L. Cui, S. Hur, Z. A. Akbar, J. C. Klöckner, W. Jeong, F. Pauly, S.-Y. Jang, P. Reddy and E. Meyhofer, Nature, 2019, 572, 628–633 CrossRef CAS PubMed.
- P. Reddy, S.-Y. Jang, R. A. Segalman and A. Majumdar, Science, 2007, 315, 1568–1571 CrossRef CAS PubMed.
- M. D. Bartlett, N. Kazem, M. J. Powell-Palm, X. Huang, W. Sun, J. A. Malen and C. Majidi, Proc. Natl. Acad. Sci. U. S. A., 2017, 114, 2143–2148 CrossRef CAS PubMed.
- J. Chen, X. Huang, B. Sun and P. Jiang, ACS Nano, 2019, 13, 337–345 CrossRef CAS PubMed.
- X. Yu, M. R. Bhatti, X. Ren, P. Steiner, F. Di Sacco, M. Dong, H. Zhang, D. Papageorgiou, G. Portale, C. Kocabas, C. W. M. Bastiaansen, M. Reece, H. Yan and E. Bilotti, Compos. Sci. Technol., 2022, 229, 109695 CrossRef CAS.
- Z.-H. Ge, Y. Chang, F. Li, J. Luo and P. Fan, Chem. Commun., 2018, 54, 2429–2431 RSC.
- C. Huang, X. Qian and R. Yang, Mater. Sci. Eng., R, 2018, 132, 1–22 CrossRef.
- X. Xu, J. Chen, J. Zhou and B. Li, Adv. Mater., 2018, 30, 1705544 CrossRef PubMed.
- H. Chen, V. V. Ginzburg, J. Yang, Y. Yang, W. Liu, Y. Huang, L. Du and B. Chen, Prog. Polym. Sci., 2016, 59, 41–85 CrossRef CAS.
- X. Yang, C. Liang, T. Ma, Y. Guo, J. Kong, J. Gu, M. Chen and J. Zhu, Adv. Compos. Hybrid Mater., 2018, 1, 207–230 CrossRef.
- F. Zhang, Y. Feng and W. Feng, Mater. Sci. Eng., R, 2020, 142, 100580 CrossRef.
- T. R. Vijaybabu, T. Ramesh, S. Pandipati, S. Mishra, G. Sridevi, C. P. Raja, R. A. Mensah, O. Das, M. Misra, A. Mohanty and K. B. Nb, Macromol. Mater. Eng., 2023, 308, 2300001 CrossRef CAS.
- G. Chen, W. Xu and D. Zhu, J. Mater. Chem. C, 2017, 5, 4350–4360 RSC.
- Y. Zhang, W. Wang, F. Zhang, K. Dai, C. Li, Y. Fan, G. Chen and Q. Zheng, Small, 2022, 18, 2104922 CrossRef CAS PubMed.
- V. Raja, Z. Hu and G. Chen, Compos. Commun., 2021, 27, 100886 CrossRef.
- J. Shin, J. Sung, M. Kang, X. Xie, B. Lee, K. M. Lee, T. J. White, C. Leal, N. R. Sottos, P. V. Braun and D. G. Cahill, Proc. Natl. Acad. Sci. U. S. A., 2019, 116, 5973–5978 CrossRef CAS PubMed.
- T. Zhou, Z. Li, Y. Cheng, Y. Ni, S. Volz, D. Donadio, S. Xiong, W. Zhang and X. Zhang, Phys. Chem. Chem. Phys., 2020, 22, 3058–3065 RSC.
- G.-H. Kim, J. Kim and K. P. Pipe, Appl. Phys. Lett., 2016, 108, 093301 CrossRef.
- R. Landauer, IBM J. Res. Dev., 1957, 1, 223–231 Search PubMed.
- R. Landauer, Philos. Mag., 1970, 21, 863–867 CrossRef CAS.
- P. N. Butcher, J. Phys.: Condens.Matter, 1990, 2, 4869 CrossRef.
- M. Paulsson and S. Datta, Phys. Rev. B: Condens. Matter Mater. Phys., 2003, 67, 241403 CrossRef.
- M. H. Garner, H. Li, Y. Chen, T. A. Su, Z. Shangguan, D. W. Paley, T. Liu, F. Ng, H. Li, S. Xiao, C. Nuckolls, L. Venkataraman and G. C. Solomon, Nature, 2018, 558, 415–419 CrossRef CAS PubMed.
- O. Karlström, H. Linke, G. Karlström and A. Wacker, Phys. Rev. B: Condens. Matter Mater. Phys., 2011, 84, 113415 CrossRef.
- T. Cao, X.-L. Shi, J. Zou and Z.-G. Chen, Microstructures, 2021, 1, 1–33 Search PubMed.
- Y. Yang, H. Deng and Q. Fu, Mater. Chem. Front., 2020, 4, 3130–3152 RSC.
- Y. Chen, Y. Zhao and Z. Liang, Energy Environ. Sci., 2015, 8, 401–422 RSC.
- A. Weathers, Z. U. Khan, R. Brooke, D. Evans, M. T. Pettes, J. W. Andreasen, X. Crispin and L. Shi, Adv. Mater., 2015, 27, 2101–2106 CrossRef CAS PubMed.
- H. Yan, N. Sada and N. Toshima, J. Therm. Anal. Calorim., 2002, 69, 881–887 CrossRef CAS.
- K. K. Lee, A. S. Alexandrov and W. Y. Liang, Phys. Rev. Lett., 2003, 90, 217001 CrossRef CAS PubMed.
- J. L. Bredas and G. B. Street, Acc. Chem. Res., 1985, 18, 309–315 CrossRef CAS.
- X. Zhang and L.-D. Zhao, J. Materiomics, 2015, 1, 92–105 CrossRef.
- K. Wang, E. Meyhofer and P. Reddy, Adv. Funct. Mater., 2020, 30, 1904534 CrossRef CAS.
- Q. Zhang, Y. Sun, W. Xu and D. Zhu, Adv. Mater., 2014, 26, 6829–6851 CrossRef CAS PubMed.
- N. W. Ashcroft, N. D. Mermin and S. Rodriguez, Am. J. Phys., 1978, 46, 116–117 CrossRef.
- F. De Vita, G. Dematteis, R. Mazzilli, D. Proment, Y. V. Lvov and M. Onorato, Phys. Rev. E, 2022, 106, 034110 CrossRef CAS PubMed.
- R. Landauer, J. Phys.: Condens.Matter, 1989, 1, 8099 CrossRef.
- T. S. Fisher, Thermal Energy at the Nanoscale, World Scientific Publishing Company, 2013 Search PubMed.
- J. C. Cuevas and E. Scheer, Molecular Electronics: an Introduction to Theory and Experiment, World Scientific, 2nd edn, 2017 Search PubMed.
- B. Gotsmann, A. Gemma and D. Segal, Appl. Phys. Lett., 2022, 120, 160503 CrossRef CAS.
- R. Maynard and E. Akkermans, Phys. Rev. B: Condens. Matter Mater. Phys., 1985, 32, 5440–5442 CrossRef CAS PubMed.
- K. Schwab, E. A. Henriksen, J. M. Worlock and M. L. Roukes, Nature, 2000, 404, 974–977 CrossRef CAS PubMed.
- S. Jezouin, F. D. Parmentier, A. Anthore, U. Gennser, A. Cavanna, Y. Jin and F. Pierre, Science, 2013, 342, 601–604 CrossRef CAS PubMed.
- L. Cui, W. Jeong, S. Hur, M. Matt, J. C. Klöckner, F. Pauly, P. Nielaba, J. C. Cuevas, E. Meyhofer and P. Reddy, Science, 2017, 355, 1192–1195 CrossRef CAS PubMed.
- N. Mosso, U. Drechsler, F. Menges, P. Nirmalraj, S. Karg, H. Riel and B. Gotsmann, Nat. Nanotechnol., 2017, 12, 430–433 CrossRef CAS PubMed.
- C. Hua, L. Lindsay, X. Chen and A. J. Minnich, Phys. Rev. B, 2019, 100, 085203 CrossRef CAS.
- G. Chen, Nat. Rev. Phys., 2021, 3, 555–569 CrossRef CAS.
- G. Chen, Nanoscale Energy Transport and Conversion: A Parallel Treatment of Electrons, Molecules, Phonons, and Photons, Oxford University Press, Oxford, New York, 2005 Search PubMed.
- J. M. Ziman, in Electrons and Phonons: The Theory of Transport Phenomena in Solids, ed. J. M. Ziman, Oxford University Press, 2001 Search PubMed.
- I. Pomeranchuk, Phys. Rev., 1941, 60, 820–821 CrossRef CAS.
- Collected Papers of L.D. Landau, ed. D. Ter haar, Pergamon, 1965, pp. 187–192 Search PubMed.
- P. G. Klemens and F. E. Simon, Proc. R. Soc. London, Ser. A, 1997, 208, 108–133 Search PubMed.
- H. Ma, Y. Ma and Z. Tian, ACS Appl. Polym. Mater., 2019, 1, 2566–2570 CrossRef CAS.
- S. Datta, Quantum Transport: Atom to Transistor, Cambridge University Press, Cambridge, 2005 Search PubMed.
- W. Kohn and L. J. Sham, Phys. Rev., 1965, 140, A1133–A1138 CrossRef.
- P. Giannozzi, S. de Gironcoli, P. Pavone and S. Baroni, Phys. Rev. B: Condens. Matter Mater. Phys., 1991, 43, 7231–7242 CrossRef CAS PubMed.
- A. Debernardi, S. Baroni and E. Molinari, Phys. Rev. Lett., 1995, 75, 1819–1822 CrossRef CAS PubMed.
- W. Li, J. Carrete, N. A. Katcho and N. Mingo, Comput. Phys. Commun., 2014, 185, 1747–1758 CrossRef CAS.
- D. A. Broido, M. Malorny, G. Birner, N. Mingo and D. A. Stewart, Appl. Phys. Lett., 2007, 91, 231922 CrossRef.
- J. Zhang, F. Xu, Y. Hong, Q. Xiong and J. Pan, RSC Adv., 2015, 5, 89415–89426 RSC.
- F. Müller-Plathe, J. Chem. Phys., 1997, 106, 6082–6085 CrossRef.
- T. Terao, E. Lussetti and F. Müller-Plathe, Phys. Rev. E, 2007, 75, 057701 CrossRef PubMed.
- Y. Sheng, Y. Hu, Z. Fan and H. Bao, Phys. Rev. B, 2022, 105, 075301 CrossRef CAS.
- W. Zhang, T. S. Fisher and N. Mingo, Numer. Heat Transfer, Part B, 2007, 51, 333–349 CrossRef CAS.
- Y. Meir and N. S. Wingreen, Phys. Rev. Lett., 1992, 68, 2512–2515 CrossRef PubMed.
- N. Mingo and L. Yang, Phys. Rev. B: Condens. Matter Mater. Phys., 2003, 68, 245406 CrossRef.
- X. Wei, Z. Wang, Z. Tian and T. Luo, J. Heat Transfer, 2021, 143, 072101 CrossRef CAS.
- R. Shrestha, P. Li, B. Chatterjee, T. Zheng, X. Wu, Z. Liu, T. Luo, S. Choi, K. Hippalgaonkar, M. P. de Boer and S. Shen, Nat. Commun., 2018, 9, 1664 CrossRef PubMed.
- H. Wang, W. Chu and G. Chen, Adv. Electron. Mater., 2019, 5, 1900167 CrossRef CAS.
- J. Ding, Z. Li, F. Zhang, Y. Zou and C. Di, in Organic Thermoelectrics, John Wiley & Sons, Ltd, 2022, pp. 319–366 Search PubMed.
- M. M. Sadeghi, M. T. Pettes and L. Shi, Solid State Commun., 2012, 152, 1321–1330 CrossRef CAS.
- S. Shen, A. Henry, J. Tong, R. Zheng and G. Chen, Nat. Nanotechnol., 2010, 5, 251–255 CrossRef CAS PubMed.
- J. A. Johnson, A. A. Maznev, J. Cuffe, J. K. Eliason, A. J. Minnich, T. Kehoe, C. M. S. Torres, G. Chen and K. A. Nelson, Phys. Rev. Lett., 2013, 110, 025901 CrossRef PubMed.
- B.-Y. Cao, Y.-W. Li, J. Kong, H. Chen, Y. Xu, K.-L. Yung and A. Cai, Polymer, 2011, 52, 1711–1715 CrossRef CAS.
- A. Jain and K. E. Goodson, J. Heat Transfer, 2008, 130(10), 102402 CrossRef.
- A. Greppmair, B. Stoib, N. Saxena, C. Gerstberger, P. Müller-Buschbaum, M. Stutzmann and M. S. Brandt, Rev. Sci. Instrum., 2017, 88, 044903 CrossRef PubMed.
- A. Narayanaswamy and N. Gu, J. Heat Transfer, 2011, 133(4), 042401 CrossRef.
- C. Canetta and A. Narayanaswamy, Appl. Phys. Lett., 2013, 102, 103112 CrossRef.
- X. Qian, J. Zhou and G. Chen, Nat. Mater., 2021, 20, 1188–1202 CrossRef CAS PubMed.
- R. Shrestha, Y. Luan, S. Shin, T. Zhang, X. Luo, J. S. Lundh, W. Gong, M. R. Bockstaller, S. Choi, T. Luo, R. Chen, K. Hippalgaonkar and S. Shen, Sci. Adv., 2019, 5, eaax3777 CrossRef CAS PubMed.
- P. Jiang, X. Qian and R. Yang, J. Appl. Phys., 2018, 124, 161103 CrossRef.
- S. Lee and D. Kim, Thermochim. Acta, 2017, 653, 126–132 CrossRef CAS.
- V. Singh, T. L. Bougher, A. Weathers, Y. Cai, K. Bi, M. T. Pettes, S. A. McMenamin, W. Lv, D. P. Resler, T. R. Gattuso, D. H. Altman, K. H. Sandhage, L. Shi, A. Henry and B. A. Cola, Nat. Nanotechnol., 2014, 9, 384–390 CrossRef CAS PubMed.
- H. Fujishiro, M. Ikebe, T. Kashima and A. Yamanaka, Jpn. J. Appl. Phys., 1997, 36, 5633 CrossRef CAS.
- X. Wang, V. Ho, R. A. Segalman and D. G. Cahill, Macromolecules, 2013, 46, 4937–4943 CrossRef CAS.
- Y. Liu, W. Zou, M. Yang, H. Luo, S. Yang, J. Xu and N. Zhao, Adv. Funct. Mater., 2023, 33, 2303561 CrossRef CAS.
- J. Ma, Q. Zhang, A. Mayo, Z. Ni, H. Yi, Y. Chen, R. Mu, L. M. Bellan and D. Li, Nanoscale, 2015, 7, 16899–16908 RSC.
- T. Kim, S. X. Drakopoulos, S. Ronca and A. J. Minnich, Nat. Commun., 2022, 13, 2452 CrossRef CAS PubMed.
- C. L. Choy, Y. W. Wong, G. W. Yang and T. Kanamoto, J. Polym. Sci., Part B: Polym. Phys., 1999, 37, 3359–3367 CrossRef CAS.
- S. Ronca, T. Igarashi, G. Forte and S. Rastogi, Polymer, 2017, 123, 203–210 CrossRef CAS.
- Y. Zhang, X. Zhang, L. Yang, Q. Zhang, M. L. Fitzgerald, A. Ueda, Y. Chen, R. Mu, D. Li and L. M. Bellan, Soft Matter, 2018, 14, 9534–9541 RSC.
- Y. Xu, D. Kraemer, B. Song, Z. Jiang, J. Zhou, J. Loomis, J. Wang, M. Li, H. Ghasemi, X. Huang, X. Li and G. Chen, Nat. Commun., 2019, 10, 1771 CrossRef PubMed.
- C. L. Choy, Y. Fei and T. G. Xi, J. Polym. Sci., Part B: Polym. Phys., 1993, 31, 365–370 CrossRef CAS.
- Z. Li, L. An, S. Khuje, J. Tan, Y. Hu, Y. Huang, D. Petit, D. Faghihi, J. Yu and S. Ren, Sci. Adv., 2021, 7, eabi7410 CrossRef CAS PubMed.
- M. K. Smith, T. L. Bougher, K. Kalaitzidou and B. A. Cola, MRS Adv., 2017, 2, 3619–3626 CrossRef CAS.
- P. Li, S. Yang, T. Zhang, R. Shrestha, K. Hippalgaonkar, T. Luo, X. Zhang and S. Shen, Sci. Rep., 2016, 6, 21452 CrossRef PubMed.
- L. Dong, Q. Xi, D. Chen, J. Guo, T. Nakayama, Y. Li, Z. Liang, J. Zhou, X. Xu and B. Li, Natl. Sci. Rev., 2018, 5, 500–506 CrossRef CAS.
- L. Xiang, Y. Fang, K. Xu, Z. Zheng, J. Dong and Y. Xie, Int. J. Heat Mass Transfer, 2022, 193, 122959 CrossRef CAS.
- K. Kurabayashi, M. Asheghi, M. Touzelbaev and K. E. Goodson, J. Microelectromech. Syst., 1999, 8, 180–191 CrossRef CAS.
- D. Yoon, H. Lee, T. Kim, Y. Song, T. Lee, J. Lee and J. Hun Seol, Eur. Polym. J., 2023, 184, 111775 CrossRef CAS.
- A. Shanker, C. Li, G.-H. Kim, D. Gidley, K. P. Pipe and J. Kim, Sci. Adv., 2017, 3, e1700342 CrossRef PubMed.
- Y. Xu, X. Wang, J. Zhou, B. Song, Z. Jiang, E. M. Y. Lee, S. Huberman, K. K. Gleason and G. Chen, Sci. Adv., 2018, 4, eaar3031 CrossRef PubMed.
- Z. Zhong, M. C. Wingert, J. Strzalka, H.-H. Wang, T. Sun, J. Wang, R. Chen and Z. Jiang, Nanoscale, 2014, 6, 8283–8291 RSC.
- A. Roy, T. L. Bougher, R. Geng, Y. Ke, J. Locklin and B. A. Cola, ACS Appl. Mater. Interfaces, 2016, 8, 25578–25585 CrossRef CAS PubMed.
- C. Canetta, S. Guo and A. Narayanaswamy, Rev. Sci. Instrum., 2014, 85, 104901 CrossRef PubMed.
- G. Wang, M. Kudo, K. Daicho, S. Harish, B. Xu, C. Shao, Y. Lee, Y. Liao, N. Matsushima, T. Kodama, F. Lundell, L. D. Söderberg, T. Saito and J. Shiomi, Nano Lett., 2022, 22, 8406–8412 CrossRef CAS PubMed.
- A. Majumdar, Annu. Rev. Mater. Sci., 1999, 29, 505–585 CrossRef CAS.
- L. Cui, R. Miao, K. Wang, D. Thompson, L. A. Zotti, J. C. Cuevas, E. Meyhofer and P. Reddy, Nat. Nanotechnol., 2018, 13, 122–127 CrossRef CAS PubMed.
- K. Kim, B. Song, V. Fernández-Hurtado, W. Lee, W. Jeong, L. Cui, D. Thompson, J. Feist, M. T. H. Reid, F. J. García-Vidal, J. C. Cuevas, E. Meyhofer and P. Reddy, Nature, 2015, 528, 387–391 CrossRef CAS PubMed.
- L. Cui, W. Jeong, V. Fernández-Hurtado, J. Feist, F. J. García-Vidal, J. C. Cuevas, E. Meyhofer and P. Reddy, Nat. Commun., 2017, 8, 14479 CrossRef CAS PubMed.
- B. Xu and N. J. Tao, Science, 2003, 301, 1221–1223 CrossRef CAS PubMed.
- M. Bharti, A. Singh, S. Samanta and D. K. Aswal, Prog. Mater. Sci., 2018, 93, 270–310 CrossRef CAS.
- H. Shirakawa, E. J. Louis, A. G. MacDiarmid, C. K. Chiang and A. J. Heeger, J. Chem. Soc. Chem. Commun., 1977, 578–580 RSC.
- O. Bubnova and X. Crispin, Energy Environ. Sci., 2012, 5, 9345–9362 RSC.
- Y. W. Park, C. O. Yoon, B. C. Na, H. Shirakawa and K. Akagi, Synth. Met., 1991, 41, 27–32 CrossRef CAS.
- C. K. Chiang, C. R. Fincher, Y. W. Park, A. J. Heeger, H. Shirakawa, E. J. Louis, S. C. Gau and A. G. MacDiarmid, Phys. Rev. Lett., 1977, 39, 1098–1101 CrossRef CAS.
- R. Kroon, D. Alemu Mengistie, D. Kiefer, J. Hynynen, J. D. Ryan, L. Yu and C. Müller, Chem. Soc. Rev., 2016, 45, 6147–6164 RSC.
- Y. Cao, P. Smith and A. J. Heeger, Synth. Met., 1992, 48, 91–97 CrossRef CAS.
- J. Wu, Y. Sun, W. Xu and Q. Zhang, Synth. Met., 2014, 189, 177–182 CrossRef CAS.
- S. N. Patel, A. M. Glaudell, D. Kiefer and M. L. Chabinyc, ACS Macro Lett., 2016, 5, 268–272 CrossRef CAS PubMed.
- R. A. Schlitz, F. G. Brunetti, A. M. Glaudell, P. L. Miller, M. A. Brady, C. J. Takacs, C. J. Hawker and M. L. Chabinyc, Adv. Mater., 2014, 26, 2825–2830 CrossRef CAS PubMed.
- K. Shi, F. Zhang, C.-A. Di, T.-W. Yan, Y. Zou, X. Zhou, D. Zhu, J.-Y. Wang and J. Pei, J. Am. Chem. Soc., 2015, 137, 6979–6982 CrossRef CAS PubMed.
- Z. Fan and J. Ouyang, Adv. Electron. Mater., 2019, 5, 1800769 CrossRef CAS.
- D. M. de Leeuw, M. M. J. Simenon, A. R. Brown and R. E. F. Einerhand, Synth. Met., 1997, 87, 53–59 CrossRef CAS.
- C. J. Boyle, M. Upadhyaya, P. Wang, L. A. Renna, M. Lu-Díaz, S. Pyo Jeong, N. Hight-Huf, L. Korugic-Karasz, M. D. Barnes, Z. Aksamija and D. Venkataraman, Nat. Commun., 2019, 10, 2827 CrossRef PubMed.
- Q. Zhang, Y. Sun, W. Xu and D. Zhu, Macromolecules, 2014, 47, 609–615 CrossRef CAS.
- A. M. Glaudell, J. E. Cochran, S. N. Patel and M. L. Chabinyc, Adv. Energy Mater., 2015, 5, 1401072 CrossRef.
- U. Lang, E. Müller, N. Naujoks and J. Dual, Adv. Funct. Mater., 2009, 19, 1215–1220 CrossRef CAS.
- I. E. Jacobs and A. J. Moulé, Adv. Mater., 2017, 29, 1703063 CrossRef PubMed.
- K. P. Pernstich, B. Rössner and B. Batlogg, Nat. Mater., 2008, 7, 321–325 CrossRef CAS PubMed.
- O. Bubnova, Z. U. Khan, A. Malti, S. Braun, M. Fahlman, M. Berggren and X. Crispin, Nat. Mater., 2011, 10, 429–433 CrossRef CAS PubMed.
- H. Park, S. Hwan Lee, F. Sunjoo Kim, H. Hee Choi, I. Woo Cheong and J. Hyun Kim, J. Mater. Chem. A, 2014, 2, 6532–6539 RSC.
- N. Massonnet, A. Carella, O. Jaudouin, P. Rannou, G. Laval, C. Celle and J.-P. Simonato, J. Mater. Chem. C, 2014, 2, 1278–1283 RSC.
- J. L. Blackburn, A. J. Ferguson, C. Cho and J. C. Grunlan, Adv. Mater., 2018, 30, 1704386 CrossRef PubMed.
- M. Zeng, D. Zavanelli, J. Chen, M. Saeidi-Javash, Y. Du, S. LeBlanc, G. Jeffrey Snyder and Y. Zhang, Chem. Soc. Rev., 2022, 51, 485–512 RSC.
- N. Wen, Z. Fan, S. Yang, Y. Zhao, T. Cong, S. Xu, H. Zhang, J. Wang, H. Huang, C. Li and L. Pan, Nano Energy, 2020, 78, 105361 CrossRef CAS.
- O. Bubnova, M. Berggren and X. Crispin, J. Am. Chem. Soc., 2012, 134, 16456–16459 CrossRef CAS PubMed.
- L. Zhang, H. Deng, S. Liu, Q. Zhang, F. Chen and Q. Fu, RSC Adv., 2015, 5, 105592–105599 RSC.
- G.-H. Kim, L. Shao, K. Zhang and K. P. Pipe, Nat. Mater., 2013, 12, 719–723 CrossRef CAS PubMed.
- S. Zhang, Z. Fan, X. Wang, Z. Zhang and J. Ouyang, J. Mater. Chem. A, 2018, 6, 7080–7087 RSC.
- A. J. Heeger, Angew. Chem., Int. Ed., 2001, 40, 2591–2611 CrossRef CAS PubMed.
- M. Culebras, B. Uriol, C. M. Gómez and A. Cantarero, Phys. Chem. Chem. Phys., 2015, 17, 15140–15145 RSC.
- T. Park, C. Park, B. Kim, H. Shin and E. Kim, Energy Environ. Sci., 2013, 6, 788–792 RSC.
- Z. U. Khan, O. Bubnova, M. J. Jafari, R. Brooke, X. Liu, R. Gabrielsson, T. Ederth, D. R. Evans, J. W. Andreasen, M. Fahlman and X. Crispin, J. Mater. Chem. C, 2015, 3, 10616–10623 RSC.
- J. Sun, M.-L. Yeh, B. J. Jung, B. Zhang, J. Feser, A. Majumdar and H. E. Katz, Macromolecules, 2010, 43, 2897–2903 CrossRef CAS.
- A. Abtahi, S. Johnson, S. M. Park, X. Luo, Z. Liang, J. Mei and K. R. Graham, J. Mater. Chem. A, 2019, 7, 19774–19785 RSC.
- G. Zuo, X. Liu, M. Fahlman and M. Kemerink, Adv. Funct. Mater., 2018, 28, 1703280 CrossRef.
- G. Zuo, X. Liu, M. Fahlman and M. Kemerink, ACS Appl. Mater. Interfaces, 2018, 10, 9638–9644 CrossRef CAS PubMed.
- H. Li, E. Plunkett, Z. Cai, B. Qiu, T. Wei, H. Chen, S. M. Thon, D. H. Reich, L. Chen and H. E. Katz, Adv. Electron. Mater., 2019, 5, 1800618 CrossRef.
- K. Hiraishi, A. Masuhara, H. Nakanishi, H. Oikawa and Y. Shinohara, Jpn. J. Appl. Phys., 2009, 48, 071501 CrossRef.
- M. Culebras, C. M. Gómez and A. Cantarero, J. Mater. Chem. A, 2014, 2, 10109–10115 RSC.
- J. Yamamoto and Y. Furukawa, J. Phys. Chem. B, 2015, 119, 4788–4794 CrossRef CAS PubMed.
- E. Lim, K. A. Peterson, G. M. Su and M. L. Chabinyc, Chem. Mater., 2018, 30, 998–1010 CrossRef CAS.
- K. Zuber, M. Fabretto, C. Hall and P. Murphy, Macromol. Rapid Commun., 2008, 29, 1503–1508 CrossRef CAS.
- W. Shi, Q. Yao, S. Qu, H. Chen, T. Zhang and L. Chen, NPG Asia Mater., 2017, 9, e405 CrossRef CAS.
- J. Hynynen, E. Järsvall, R. Kroon, Y. Zhang, S. Barlow, S. R. Marder, M. Kemerink, A. Lund and C. Müller, ACS Macro Lett., 2019, 8, 70–76 CrossRef CAS PubMed.
- Y. Hiroshige, M. Ookawa and N. Toshima, Synth. Met., 2006, 156, 1341–1347 CrossRef CAS.
- Y. Hiroshige, M. Ookawa and N. Toshima, Synth. Met., 2007, 157, 467–474 CrossRef CAS.
- B. T. O'Connor, O. G. Reid, X. Zhang, R. J. Kline, L. J. Richter, D. J. Gundlach, D. M. DeLongchamp, M. F. Toney, N. Kopidakis and G. Rumbles, Adv. Funct. Mater., 2014, 24, 3422–3431 CrossRef.
- B. O'Connor, R. J. Kline, B. R. Conrad, L. J. Richter, D. Gundlach, M. F. Toney and D. M. DeLongchamp, Adv. Funct. Mater., 2011, 21, 3697–3705 CrossRef.
- S. Nagamatsu, W. Takashima, K. Kaneto, Y. Yoshida, N. Tanigaki, K. Yase and K. Omote, Macromolecules, 2003, 36, 5252–5257 CrossRef CAS.
- N. Kim, S. Kee, S. H. Lee, B. H. Lee, Y. H. Kahng, Y.-R. Jo, B.-J. Kim and K. Lee, Adv. Mater., 2014, 26, 2268–2272 CrossRef CAS PubMed.
- X. Crispin, F. L. E. Jakobsson, A. Crispin, P. C. M. Grim, P. Andersson, A. Volodin, C. van Haesendonck, M. Van der Auweraer, W. R. Salaneck and M. Berggren, Chem. Mater., 2006, 18, 4354–4360 CrossRef CAS.
- A. Hamidi-Sakr, L. Biniek, S. Fall and M. Brinkmann, Adv. Funct. Mater., 2016, 26, 408–420 CrossRef CAS.
- Z. Ye, X. Yang, H. Cui and F. Qiu, J. Mater. Chem. C, 2014, 2, 6773–6780 RSC.
- D. K. Taggart, Y. Yang, S.-C. Kung, T. M. McIntire and R. M. Penner, Nano Lett., 2011, 11, 125–131 CrossRef CAS PubMed.
- D. M. DeLongchamp, R. J. Kline, Y. Jung, D. S. Germack, E. K. Lin, A. J. Moad, L. J. Richter, M. F. Toney, M. Heeney and I. McCulloch, ACS Nano, 2009, 3, 780–787 CrossRef CAS PubMed.
- L. Deng and G. Chen, Nano Energy, 2021, 80, 105448 CrossRef CAS.
- B. Russ, M. J. Robb, F. G. Brunetti, P. L. Miller, E. E. Perry, S. N. Patel, V. Ho, W. B. Chang, J. J. Urban, M. L. Chabinyc, C. J. Hawker and R. A. Segalman, Adv. Mater., 2014, 26, 3473–3477 CrossRef CAS PubMed.
- D. Kiefer, A. Giovannitti, H. Sun, T. Biskup, A. Hofmann, M. Koopmans, C. Cendra, S. Weber, L. J. Anton Koster, E. Olsson, J. Rivnay, S. Fabiano, I. McCulloch and C. Müller, ACS Energy Lett., 2018, 3, 278–285 CrossRef CAS PubMed.
- R. B. Aïch, N. Blouin, A. Bouchard and M. Leclerc, Chem. Mater., 2009, 21, 751–757 CrossRef.
- D. Huang, H. Yao, Y. Cui, Y. Zou, F. Zhang, C. Wang, H. Shen, W. Jin, J. Zhu, Y. Diao, W. Xu, C. Di and D. Zhu, J. Am. Chem. Soc., 2017, 139, 13013–13023 CrossRef CAS PubMed.
- H. Li, M. E. DeCoster, R. M. Ireland, J. Song, P. E. Hopkins and H. E. Katz, J. Am. Chem. Soc., 2017, 139, 11149–11157 CrossRef CAS PubMed.
- C.-K. Mai, R. A. Schlitz, G. M. Su, D. Spitzer, X. Wang, S. L. Fronk, D. G. Cahill, M. L. Chabinyc and G. C. Bazan, J. Am. Chem. Soc., 2014, 136, 13478–13481 CrossRef CAS PubMed.
- B. Endrődi, J. Mellár, Z. Gingl, C. Visy and C. Janáky, J. Phys. Chem. C, 2015, 119, 8472–8479 CrossRef.
- S. Qu, Q. Yao, B. Yu, K. Zeng, W. Shi, Y. Chen and L. Chen, Chem.–Asian J., 2018, 13, 3246–3253 CrossRef CAS PubMed.
- O. Bubnova, Z. U. Khan, H. Wang, S. Braun, D. R. Evans, M. Fabretto, P. Hojati-Talemi, D. Dagnelund, J.-B. Arlin, Y. H. Geerts, S. Desbief, D. W. Breiby, J. W. Andreasen, R. Lazzaroni, W. M. Chen, I. Zozoulenko, M. Fahlman, P. J. Murphy, M. Berggren and X. Crispin, Nat. Mater., 2014, 13, 190–194 CrossRef CAS PubMed.
- W. Ma, K. Shi, Y. Wu, Z.-Y. Lu, H.-Y. Liu, J.-Y. Wang and J. Pei, ACS Appl. Mater. Interfaces, 2016, 8, 24737–24743 CrossRef CAS PubMed.
- L. Deng, X. Huang, H. Lv, Y. Zhang and G. Chen, Appl. Mater. Today, 2021, 22, 100959 CrossRef.
- F. F. Kong, C. C. Liu, J. K. Xu, F. X. Jiang, B. Y. Lu, R. R. Yue, G. D. Liu and J. M. Wang, Chin. Phys. Lett., 2011, 28(3), 037201 CrossRef.
- I. Petsagkourakis, E. Pavlopoulou, G. Portale, B. A. Kuropatwa, S. Dilhaire, G. Fleury and G. Hadziioannou, Sci. Rep., 2016, 6, 30501 CrossRef PubMed.
- R. M. W. Wolfe, A. K. Menon, T. R. Fletcher, S. R. Marder, J. R. Reynolds and S. K. Yee, Adv. Funct. Mater., 2018, 28, 1803275 CrossRef.
- X. Huang, L. Deng, F. Liu, Q. Zhang and G. Chen, Energy Mater. Adv., 2021, 2021, 1572537 Search PubMed.
- X. Huang, L. Deng, F. Liu, Z. Liu and G. Chen, Chem. Eng. J., 2021, 417, 129230 CrossRef CAS.
- J. Duan, J. Ding, D. Wang, X. Zhu, J. Chen, G. Zhu, C. Chen, Y. Yu, H. Liao, Z. Li, C. Di and W. Yue, Adv. Sci., 2023, 10, 2204872 CrossRef CAS PubMed.
- S. R. Sarath Kumar, N. Kurra and H. N. Alshareef, J. Mater. Chem. C, 2016, 4, 215–221 RSC.
- J. Luo, D. Billep, T. Waechtler, T. Otto, M. Toader, O. Gordan, E. Sheremet, J. Martin, M. Hietschold, D. R. T. Zahn and T. Gessner, J. Mater. Chem. A, 2013, 1, 7576–7583 RSC.
- F. Kong, C. Liu, H. Song, J. Xu, Y. Huang, H. Zhu and J. Wang, Synth. Met., 2013, 185–186, 31–37 CrossRef CAS.
- W. Deng, L. Deng, Z. Li, Y. Zhang and G. Chen, ACS Appl. Mater. Interfaces, 2021, 13, 12131–12140 CrossRef CAS PubMed.
- W. Deng, D. Liang, H. Yue, Z. Yichuan and C. Guangming, Soft Sci., 2021, 1, 1–14 Search PubMed.
- Z. Li, L. Deng, H. Lv, L. Liang, W. Deng, Y. Zhang and G. Chen, Adv. Funct. Mater., 2021, 31, 2104836 CrossRef CAS.
- A. Henry, G. Chen, S. J. Plimpton and A. Thompson, Phys. Rev. B: Condens. Matter Mater. Phys., 2010, 82, 144308 CrossRef.
- E. Fermi, P. Pasta, S. Ulam and M. Tsingou, Studies Of The Nonlinear Problems, Los Alamos National Lab. (LANL), Los Alamos, NM (United States), 1955 Search PubMed.
- D. Segal, A. Nitzan and P. Hänggi, J. Chem. Phys., 2003, 119, 6840–6855 CrossRef CAS.
- J.-W. Jiang, J. Zhao, K. Zhou and T. Rabczuk, J. Appl. Phys., 2012, 111, 124304 CrossRef.
- M. Simoncelli, N. Marzari and F. Mauri, Nat. Phys., 2019, 15, 809–813 Search PubMed.
- L. Isaeva, G. Barbalinardo, D. Donadio and S. Baroni, Nat. Commun., 2019, 10, 3853 Search PubMed.
- J. Liu and R. Yang, Phys. Rev. B: Condens. Matter Mater. Phys., 2012, 86, 104307 CrossRef.
- J. C. Klöckner, M. Bürkle, J. C. Cuevas and F. Pauly, Phys. Rev. B: Condens. Matter Mater. Phys., 2016, 94, 205425 CrossRef.
- J. C. Klöckner, J. C. Cuevas and F. Pauly, Phys. Rev. B, 2018, 97, 155432 CrossRef.
- H. D. Pandey and D. M. Leitner, J. Chem. Phys., 2017, 147, 084701 CrossRef PubMed.
- D. M. Leitner, in Handbook of Materials Modeling: Applications: Current and Emerging Materials, ed. W. Andreoni and S. Yip, Springer International Publishing, Cham, 2020, pp. 865–885 Search PubMed.
- X. Wei and T. Luo, Phys. Chem. Chem. Phys., 2019, 21, 15523–15530 RSC.
- P. Cheng, N. Shulumba and A. J. Minnich, Phys. Rev. B, 2019, 100, 094306 CrossRef CAS.
- M. Wang and S. Lin, Sci. Rep., 2015, 5, 18122 CrossRef CAS PubMed.
- A. Henry and G. Chen, Phys. Rev. Lett., 2008, 101, 235502 CrossRef PubMed.
- C. Yang, S. Raza, X. Li and J. Liu, J. Phys. Chem. B, 2023, 127, 6804–6813 CrossRef CAS PubMed.
- N. Mosso, H. Sadeghi, A. Gemma, S. Sangtarash, U. Drechsler, C. Lambert and B. Gotsmann, Nano Lett., 2019, 19, 7614–7622 CrossRef CAS PubMed.
- Z. Wang, J. A. Carter, A. Lagutchev, Y. K. Koh, N.-H. Seong, D. G. Cahill and D. D. Dlott, Science, 2007, 317, 787–790 CrossRef CAS PubMed.
- A. Yamanaka, Y. Izumi, T. Kitagawa, T. Terada, H. Sugihara, H. Hirahata, K. Ema, H. Fujishiro and S. Nishijima, J. Appl. Polym. Sci., 2006, 101, 2619–2626 CrossRef CAS.
- D. Hands, K. Lane and R. P. Sheldon, J. Polym. Sci., Polym. Symp., 1973, 42, 717–726 CrossRef.
- A. Yamanaka and T. Takao, Int. Scholarly Res. Not., 2011, 2011, e718761 Search PubMed.
- B. Xie, W. Zhao, X. Luo and R. Hu, Mater. Sci. Eng., R, 2023, 154, 100738 CrossRef.
- J. Shin, M. Kang, T. Tsai, C. Leal, P. V. Braun and D. G. Cahill, ACS Macro Lett., 2016, 5, 955–960 CrossRef CAS PubMed.
- B. Zhu, J. Liu, T. Wang, M. Han, S. Valloppilly, S. Xu and X. Wang, ACS Omega, 2017, 2, 3931–3944 CrossRef CAS PubMed.
- J. Liu and R. Yang, Phys. Rev. B: Condens. Matter Mater. Phys., 2010, 81, 174122 CrossRef.
- A. Shi, Y. Li, W. Liu, J. Lei and Z.-M. Li, J. Appl. Phys., 2019, 125, 245110 CrossRef.
- A. Peterlin, Kolloid Z. Z. Polym., 1969, 233, 857–862 CrossRef CAS.
- K. Tao, G. Sun, C. Feng, G. Liu, Y. Li, R. Chen, J. Wang and S. Han, Macromol. Rapid Commun., 2023, 44, 2300060 CrossRef CAS PubMed.
- S. A. Harfenist, S. D. Cambron, E. W. Nelson, S. M. Berry, A. W. Isham, M. M. Crain, K. M. Walsh, R. S. Keynton and R. W. Cohn, Nano Lett., 2004, 4, 1931–1937 CrossRef CAS.
- A. S. Nain, C. Amon and M. Sitti, IEEE Trans. Nanotechnol., 2006, 5, 499–510 Search PubMed.
- R. Shrestha, S. Shen and M. P. de Boer, Actuators, 2018, 7, 71 CrossRef.
- L. Jing, R. Cheng, M. Tasoglu, Z. Wang, Q. Wang, H. Zhai, S. Shen, T. Cohen-Karni, R. Garg and I. Lee, Small, 2023, 19, 2207015 CrossRef CAS PubMed.
- T. Luo, K. Esfarjani, J. Shiomi, A. Henry and G. Chen, J. Appl. Phys., 2011, 109, 074321 CrossRef.
- K. Sasikumar and P. Keblinski, J. Appl. Phys., 2011, 109, 114307 CrossRef.
- X. Duan, Z. Li, J. Liu, G. Chen and X. Li, J. Appl. Phys., 2019, 125, 164303 CrossRef.
- H. Ma and Z. Tian, Appl. Phys. Lett., 2017, 110, 091903 CrossRef.
- B. Liu, Y. Zhou, L. Dong, Q. Lu and X. Xu, iScience, 2022, 25, 105451 CrossRef CAS PubMed.
- D. Luo, C. Huang and Z. Huang, J. Heat Transfer, 2018, 140(3), 031302 CrossRef.
- H. Ma and Z. Tian, J. Mater. Res., 2019, 34, 126–133 CrossRef CAS.
- T. Zhang and T. Luo, J. Appl. Phys., 2012, 112, 094304 CrossRef.
- X. Wei, T. Zhang and T. Luo, Phys. Chem. Chem. Phys., 2016, 18, 32146–32154 RSC.
- L. Zhang, M. Ruesch, X. Zhang, Z. Bai and L. Liu, RSC Adv., 2015, 5, 87981–87986 RSC.
- H. Subramanyan, W. Zhang, J. He, K. Kim, X. Li and J. Liu, J. Appl. Phys., 2019, 125, 095104 CrossRef.
- X. Xie, K. Yang, D. Li, T.-H. Tsai, J. Shin, P. V. Braun and D. G. Cahill, Phys. Rev. B, 2017, 95, 035406 CrossRef.
- T. Zhang and T. Luo, J. Phys. Chem. B, 2016, 120, 803–812 CrossRef CAS PubMed.
- Y. Wu, K. Wu, F. Xiao, E. Jiao, J. Shi and M. Lu, J. Appl. Polym. Sci., 2023, 140, e53951 CrossRef CAS.
- G.-H. Kim, D. Lee, A. Shanker, L. Shao, M. S. Kwon, D. Gidley, J. Kim and K. P. Pipe, Nat. Mater., 2015, 14, 295–300 CrossRef CAS PubMed.
- X. Xiong, M. Yang, C. Liu, X. Li and D. Tang, J. Appl. Phys., 2017, 122, 035104 CrossRef.
- J. N. Tomlinson, D. E. Kline and J. A. Sauer, Polym. Eng. Sci., 1965, 5, 44–48 CrossRef CAS.
- G. Kikugawa, T. G. Desai, P. Keblinski and T. Ohara, J. Appl. Phys., 2013, 114, 034302 CrossRef.
- V. Rashidi, E. J. Coyle, K. Sebeck, J. Kieffer and K. P. Pipe, J. Phys. Chem. B, 2017, 121, 4600–4609 CrossRef CAS PubMed.
- S. Yu, C. Park, S. M. Hong and C. M. Koo, Thermochim. Acta, 2014, 583, 67–71 CrossRef CAS.
- J. He and J. Liu, J. Appl. Phys., 2021, 130, 225101 CrossRef CAS.
- C. L. Choy, Polymer, 1977, 18, 984–1004 CrossRef CAS.
- N. Shulumba, O. Hellman and A. J. Minnich, Phys. Rev. Lett., 2017, 119, 185901 CrossRef PubMed.
- R. C. Zeller and R. O. Pohl, Phys. Rev. B: Solid State, 1971, 4, 2029–2041 CrossRef.
- L. H. Sperling, Introduction to Physical Polymer Science, John Wiley & Sons, Ltd, 2005, pp. 1–28 Search PubMed.
- M. Hattori, Kolloid Z. Z. Polym., 1962, 185, 27–31 CrossRef CAS.
- S. Kommandur and S. K. Yee, J. Polym. Sci., Part B: Polym. Phys., 2017, 55, 1160–1170 CrossRef CAS.
- C. L. Choy, F. C. Chen and W. H. Luk, J. Polym. Sci., Polym. Phys. Ed., 1980, 18, 1187–1207 CrossRef CAS.
- S. Das and M. Muthukumar, Macromolecules, 2023, 56, 393–403 CrossRef CAS.
- T. Lu, K. Kim, X. Li, J. Zhou, G. Chen and J. Liu, J. Appl. Phys., 2018, 123, 015107 CrossRef.
- T. Ito, H. Matsubara, D. Surblys and T. Ohara, AIP Adv., 2022, 12, 105223 CrossRef CAS.
- X. Liu, X. Yu, Z. Yang, X. Zhuang, H. Guo, X. Luo, J. Chen, Y. Liang and Y. Chen, J. Electron. Mater., 2023, 52, 2831–2842 CrossRef CAS.
- J. He, K. Kim, Y. Wang and J. Liu, Appl. Phys. Lett., 2018, 112, 051907 CrossRef.
- A. Henry and G. Chen, Nanoscale Microscale Thermophys. Eng., 2009, 13, 99–108 CrossRef CAS.
- A. B. Robbins, S. X. Drakopoulos, I. Martin-Fabiani, S. Ronca and A. J. Minnich, Proc. Natl. Acad. Sci. U. S. A., 2019, 116, 17163–17168 CrossRef CAS PubMed.
- K. Eiermann, Kolloid Z. Z. Polym., 1965, 201, 3–15 CrossRef CAS.
- C. L. Choy, W. H. Luk and F. C. Chen, Polymer, 1978, 19, 155–162 CrossRef CAS.
- D. B. Mergenthaler, M. Pietralla, S. Roy and H. G. Kilian, Macromolecules, 1992, 25, 3500–3502 CrossRef CAS.
- Y. Guo, Y. Zhou and Y. Xu, Polymer, 2021, 233, 124168 CrossRef CAS.
- A. Petran, T. Radu, M. Dan and A. Nan, Int. J. Mol. Sci., 2023, 24, 7606 CrossRef CAS PubMed.
- G. Lv, X. Li, E. Jensen, B. Soman, Y.-H. Tsao, C. M. Evans and D. G. Cahill, Macromolecules, 2023, 56, 1554–1561 CrossRef CAS.
- L. Liu, L. Liang, L. Deng, H. Wang and G. Chen, Appl. Mater. Today, 2022, 27, 101496 CrossRef.
- N. Lu, L. Li, N. Gao and M. Liu, J. Appl. Phys., 2016, 120, 195108 CrossRef.
- X. Xu, J. Zhou and J. Chen, Adv. Funct. Mater., 2020, 30, 1904704 CrossRef CAS.
- H. Ushirokita and H. Tada, Chem. Lett., 2016, 45, 735–737 CrossRef CAS.
- Y. Sun, L. Qiu, L. Tang, H. Geng, H. Wang, F. Zhang, D. Huang, W. Xu, P. Yue, Y. Guan, F. Jiao, Y. Sun, D. Tang, C. Di, Y. Yi and D. Zhu, Adv. Mater., 2016, 28, 3351–3358 CrossRef CAS PubMed.
- J. Liu, X. Wang, D. Li, N. E. Coates, R. A. Segalman and D. G. Cahill, Macromolecules, 2015, 48, 585–591 CrossRef CAS.
- D. Scheunemann and M. Kemerink, Phys. Rev. B, 2020, 101, 075206 CrossRef CAS.
- M. Scholdt, H. Do, J. Lang, A. Gall, A. Colsmann, U. Lemmer, J. D. Koenig, M. Winkler and H. Boettner, J. Electron. Mater., 2010, 39, 1589–1592 CrossRef CAS.
- K. Utimula, T. Ichibha, R. Maezono and K. Hongo, Chem. Mater., 2019, 31, 4649–4656 CrossRef CAS.
- R. Muthaiah and J. Garg, J. Appl. Phys., 2018, 124, 105102 CrossRef.
- L. Bai, X. Zhao, R.-Y. Bao, Z.-Y. Liu, M.-B. Yang and W. Yang, J. Mater. Sci., 2018, 53, 10543–10553 CrossRef CAS.
- K. Eiermann and K.-xH. Hellwege, J. Polym. Sci., 1962, 57, 99–106 CrossRef.
- J. Morikawa, J. Tan and T. Hashimoto, Polymer, 1995, 36, 4439–4443 CrossRef CAS.
- P. Andersson and B. Sundqvist, J. Polym. Sci., Polym. Phys. Ed., 1975, 13, 243–251 CrossRef CAS.
- G. Wehmeyer, T. Yabuki, C. Monachon, J. Wu and C. Dames, Appl. Phys. Rev., 2017, 4, 041304 Search PubMed.
- J. A. Tomko, A. Pena-Francesch, H. Jung, M. Tyagi, B. D. Allen, M. C. Demirel and P. E. Hopkins, Nat. Nanotechnol., 2018, 13, 959–964 CrossRef CAS PubMed.
- A. L. Cottrill, S. Wang, A. T. Liu, W.-J. Wang and M. S. Strano, Adv. Energy Mater., 2018, 8, 1702692 CrossRef.
- H. Ma and Z. Tian, Nano Lett., 2018, 18, 43–48 CrossRef CAS PubMed.
- N. Li, J. Ren, L. Wang, G. Zhang, P. Hänggi and B. Li, Rev. Mod. Phys., 2012, 84, 1045–1066 CrossRef.
- T. Zhang and T. Luo, ACS Nano, 2013, 7, 7592–7600 CrossRef CAS PubMed.
- T. Zhang and T. Luo, Small, 2015, 11, 4657–4665 CrossRef CAS PubMed.
- R. Shrestha, Y. Luan, S. Shin, T. Zhang, X. Luo, J. S. Lundh, W. Gong, M. R. Bockstaller, S. Choi, T. Luo, R. Chen, K. Hippalgaonkar and S. Shen, Sci. Adv., 2019, 5, eaax3777 CrossRef CAS PubMed.
- C. Li, Y. Ma and Z. Tian, ACS Macro Lett., 2018, 7, 53–58 CrossRef CAS PubMed.
- H. Feng, N. Tang, M. An, R. Guo, D. Ma, X. Yu, J. Zang and N. Yang, J. Phys. Chem. C, 2019, 123, 31003–31010 CrossRef CAS.
- G. G. D. Han, H. Li and J. C. Grossman, Nat. Commun., 2017, 8, 1446 CrossRef PubMed.
- L. Wan, X. Min, W. Yue, F. Lin, J. Feng, X. Liu, D. She, C. Wang, Z. Huang and L. Wang, ACS Appl. Polym. Mater., 2023, 5, 6540–6548 CrossRef CAS.
- L. Wan, F. Lin, W. Yue, J. Feng, X. Liu, X. Min, C. Wang and Z. Huang, J. Mater. Sci., 2023, 58, 5072–5085 CrossRef CAS.
- R. Shrestha, Y. Luan, X. Luo, S. Shin, T. Zhang, P. Smith, W. Gong, M. Bockstaller, T. Luo, R. Chen, K. Hippalgaonkar and S. Shen, Nat. Commun., 2020, 11, 4346 CrossRef CAS PubMed.
- S. Xu, X.-L. Shi, M. Dargusch, C. Di, J. Zou and Z.-G. Chen, Prog. Mater. Sci., 2021, 121, 100840 CrossRef CAS.
- G. Schwartz, B. C.-K. Tee, J. Mei, A. L. Appleton, D. H. Kim, H. Wang and Z. Bao, Nat. Commun., 2013, 4, 1859 CrossRef PubMed.
- C. Liu, B. Lu, J. Yan, J. Xu, R. Yue, Z. Zhu, S. Zhou, X. Hu, Z. Zhang and P. Chen, Synth. Met., 2010, 160, 2481–2485 CrossRef CAS.
- Y. Sun, P. Sheng, C. Di, F. Jiao, W. Xu, D. Qiu and D. Zhu, Adv. Mater., 2012, 24, 932–937 CrossRef CAS PubMed.
- S. Qu, Q. Yao, L. Wang, Z. Chen, K. Xu, H. Zeng, W. Shi, T. Zhang, C. Uher and L. Chen, NPG Asia Mater., 2016, 8, e292 CrossRef CAS.
- K. Lee, S. Cho, S. Heum Park, A. J. Heeger, C.-W. Lee and S.-H. Lee, Nature, 2006, 441, 65–68 CrossRef CAS PubMed.
- C. O. Yoon, M. Reghu, D. Moses and A. J. Heeger, Phys. Rev. B: Condens. Matter Mater. Phys., 1994, 49, 10851–10863 CrossRef CAS PubMed.
- A. B. Kaiser, Phys. Rev. B: Condens. Matter Mater. Phys., 1987, 35, 4677–4681 CrossRef CAS PubMed.
- T. H. Gilani and T. Ishiguro, Synth. Met., 1997, 84, 845–846 CrossRef CAS.
- C. Nath, A. Kumar, Y.-K. Kuo and G. S. Okram, Appl. Phys. Lett., 2014, 105, 133108 CrossRef.
- Z. Fan, D. Du, Z. Yu, P. Li, Y. Xia and J. Ouyang, ACS Appl. Mater. Interfaces, 2016, 8, 23204–23211 CrossRef CAS PubMed.
- O. E. Parfenov and F. A. Shklyaruk, Semiconductors, 2007, 41, 1021–1026 CrossRef CAS.
- T. E. Whall, J. Phys. C: Solid State Phys., 1981, 14, L887 CrossRef CAS.
- Q. Zhang, Y. Sun, W. Xu and D. Zhu, Energy Environ. Sci., 2012, 5, 9639–9644 RSC.
- Q. Wei, M. Mukaida, K. Kirihara, Y. Naitoh and T. Ishida, Appl. Phys. Express, 2014, 7, 031601 CrossRef CAS.
- Q. Wang, S. Liu, H. Guo, B. Hu, Y. Li, J. Wang and B. Li, Polymers, 2023, 15, 2331 CrossRef CAS PubMed.
- Y. Lu, J. Liu, X. Xie and D. G. Cahill, ACS Macro Lett., 2016, 5, 646–650 CrossRef CAS PubMed.
- C. L. Choy, E. L. Ong and F. C. Chen, J. Appl. Polym. Sci., 1981, 26, 2325–2335 CrossRef CAS.
- M. Morita and T. Shiga, Phys. Rev. B, 2021, 103, 195418 CrossRef CAS.
- M. S. Dresselhaus, G. Chen, M. Y. Tang, R. G. Yang, H. Lee, D. Z. Wang, Z. F. Ren, J.-P. Fleurial and P. Gogna, Adv. Mater., 2007, 19, 1043–1053 CrossRef CAS.
- J. Wei, L. Yang, Z. Ma, P. Song, M. Zhang, J. Ma, F. Yang and X. Wang, J. Mater. Sci., 2020, 55, 12642–12704 CrossRef CAS.
- J. He and T. M. Tritt, Science, 2017, 357, eaak9997 CrossRef PubMed.
- T. B. Martin and D. J. Audus, ACS Polym. Au, 2023, 3, 239–258 CrossRef CAS PubMed.
- X. Qian and R. Yang, Mater. Sci. Eng., R, 2021, 146, 100642 CrossRef.
- S. Otsuka, I. Kuwajima, J. Hosoya, Y. Xu and M. Yamazaki, in 2011 International Conference on Emerging Intelligent Data and Web Technologies, 2011, pp. 22–29 Search PubMed.
- R. Ma, H. Zhang and T. Luo, ACS Appl. Mater. Interfaces, 2022, 14, 15587–15598 CrossRef CAS PubMed.
- S. Wu, Y. Kondo, M. Kakimoto, B. Yang, H. Yamada, I. Kuwajima, G. Lambard, K. Hongo, Y. Xu, J. Shiomi, C. Schick, J. Morikawa and R. Yoshida, npj Comput. Mater., 2019, 5, 1–11 CrossRef CAS.
- M. Li, L. Dai and Y. Hu, ACS Energy Lett., 2022, 7, 3204–3226 CrossRef CAS PubMed.
- C. Yan and G. Li, Adv. Intell. Syst., 2023, 5, 2200243 CrossRef.
| This journal is © The Royal Society of Chemistry 2024 |


