 Open Access Article
Creative Commons Attribution 3.0 Unported Licence
SERS hotspot engineering using external field assembly of a plasmonic magnetic nanocomposite with high sensitivity and uniformity†
Zhenli
Sun
 a,
Ning
Wang
a,
Yiyan
Zhang
a,
Xunlong
Ji
a,
Zijin
Hong
a,
Dan
Xie
a,
Wentao
Zhang
a,
Wenjing
Liu
a,
Ning
Wang
a,
Yiyan
Zhang
a,
Xunlong
Ji
a,
Zijin
Hong
a,
Dan
Xie
a,
Wentao
Zhang
a,
Wenjing
Liu
 b and
Jingjing
Du
 *cd
*cd
aMOE Key Laboratory of Resources and Environmental System Optimization, College of Environmental Science and Engineering, North China Electric Power University, Beijing 102206, China
bKey Laboratory for Environmental Factors Control of Agro-product Quality Safety, Ministry of Agriculture and Rural Affairs, Agro-Environmental Protection Institute, Tianjin 300191, China
cState Key Laboratory of Environmental Chemistry and Ecotoxicology, Research Center for Eco-Environmental Sciences, Chinese Academy of Sciences, Beijing 100085, China. E-mail: jjdu@rcees.ac.cn
dUniversity of Chinese Academy of Sciences, Beijing, China
First published on 12th June 2024
Abstract
Surface-enhanced Raman scattering (SERS) is a pivotal analytical technique in sensing, yet it grapples with challenges such as reproducibility, substrate stability, and hotspot uniformity. The use of highly effective external field nanocomposites facilitates the dynamic manipulation of “hotspots”—the nanoscale gaps between metal nanoparticles—which is critical for SERS enhancement. The gap between 4-mercaptopyridine-modified (4-MPY) Fe3O4@SiO2@Au nanocomposites (FA) can be precisely reduced by applying an external magnetic field, resulting in up to a 30-fold increase in SERS signal intensity and an 8–39 times increase in the enhancement factor (EF). This approach markedly enhances SERS signal uniformity, demonstrated by the relative standard deviation of the EF dropping from 59.15–9.44% to 28.70–1.14%. By systematically studying the correlations between the SERS EF and the external-magnetic-field strength, hotspot density, and probe molecular density, sensitive magnetic, SERS platforms are established. The optimal hotspots occur in the magnetic field of 80 to 120 mT among the FA-4MPY nanocomposites, as validated by COMSOL finite-element analysis simulations. These findings offer a nuanced understanding of magnetic SERS hotspot tuning, paving the way for precise and improved molecular sensing.
Introduction
Surface-enhanced Raman scattering (SERS) has proven to be an indispensable tool in molecular detection, offering exceptional sensitivity and precision within the expansive fields of chemistry, materials science, and life sciences.1 This technique, known for its exquisite sensitivity and specificity, allows for the detection of analytes at ultra-trace levels. Central to the SERS mechanism is the excitation of localized surface plasmons upon the irradiation of noble-metal nanoparticles, including gold (Au), silver (Ag), or copper (Cu) nanoparticles.2 Recent advances in nanofabrication and a deepened understanding of plasmonic phenomena have spurred a drive toward fusing SERS-active noble-metal nanoparticles with multifunctional materials, particularly magnetic nanocomposites enhancing both the practicality and functionality of SERS-based assays.3Magnetic nanocomposites adeptly fuse the superb plasmonic qualities of noble-metal nanoparticles with magnetic capabilities, consequently facilitating not only straightforward molecular separation but also amplified spectroscopic detection. The inherent magnetism of these materials refines the process of isolating and concentrating targeted analytes from complex matrices, significantly improving detection accuracy and minimizing background interference. The ability to reuse magnetic nanoparticles (MNPs) not only promotes economic efficiency but also aligns with ecological sustainability by reducing both costs and the environmental impact.4–16 Despite its potential, the practical application of magnetic SERS in real-world scenarios is hampered by a trio of formidable challenges: the inconsistent reproducibility across different batches, concerns over substrate stability, and the inherent nonuniformity of hotspot distribution.17
To address these issues, recent advances have shifted focus toward the integration of plasmonic magnetic nanocomposites with external fields to manipulate hotspot formation and positioning.8 Hotspots, nanoscale gaps with significantly intensified electromagnetic fields, are crucial for SERS effectiveness. These hotspots, positioned in proximity to metallic nanostructures, facilitate the substantial amplification of Raman signals from nearby molecules. Owing to magnetic attraction, the configuration of hotspots on magnetic SERS substrates can be precisely controlled, either through orderly arrangement or targeted aggregation, thereby enhancing both the uniformity and strength of the substrate signal and, consequently, optimizing the SERS output.5–7,9,11,18–21 This modulation is heavily influenced by the spacing between MNPs, underscoring its significance.10 Although various hypotheses have been proposed to explain how external magnetic fields bolster signal amplification in magnetic SERS substrates, a unified and exhaustive understanding is yet to be achieved. This highlights an imperative and pressing need for in-depth investigations to demystify the complex dynamics between magnetic-field modulation and hotspot activities within these intricate magnetic nanoarchitectures.
In this study, we introduce a novel approach that harnesses the synergy of an external magnetic field and plasmonic magnetic nanocomposites, specifically 4-mercaptopyridine (4-MPY) modified Fe3O4@SiO2@Au nanocomposites (FA), to fine-tune the assembly of hotspots with unparalleled precision. Stereoscopic microscopy and statistical computational analysis were employed to evaluate substrate distribution and hotspot density. A finite-element model in COMSOL software elucidated the magnetic field's impact on the electromagnetic distribution across the metal surface. We investigated the effect of the external magnetic field on SERS signal intensity and hotspot distribution to establish a quantitative model for magnetic control over hotspots. Our study clarifies the mechanism of enhancement of SERS signals in external magnetic fields and guides the generation of high-quality signals from magnetic substrates.
Experimental
Materials
All the reagents were of analytical grade and were used without further purification. 4-MPY, standard HAuCl4·4H2O (>47.8%), ethylene glycol (EG), and FeCl3·6H2O were purchased from Sinopharm Chemical Reagent Co. Anhydrous sodium citrate (Na3Ct), sodium acetate (NaAc), tetraethyl orthosilicate (TEOS), and ethanol were supplied by Aladdin Biochemical Technology. Poly(dimethyl diallyl ammonium chloride) (PDDA) was purchased from Sigma-Aldrich. NaCl was obtained from Macklin Inc.SERS spectra were acquired without any pre-treatment of the samples using an ACCUMAN SR-510 portable Raman spectrometer (Ocean Optics, Shanghai, China) and a portable Raman spectrometer (PERS-RZ1702B, Xiamen, China), with a laser excitation wavelength of 785 nm. Transmission electron microscopy (TEM) images and energy-dispersive X-ray spectroscopy (EDS) maps were obtained using a JEM-2100F (JEOL Ltd) electron microscope. Ultraviolet-visible (UV-vis) spectra were recorded using a SHIMADZU UV-2550 spectrophotometer. White-light images were obtained using a SZ680 stereomicroscope (Chongqing Optec Instrument Co., Ltd).
Fabrication of Fe3O4@SiO2@Au@PDDA (FAP)
The FA substrate synthesis method used was an improved version of a method reported in the literature.22 The prepared FA substrate was added to a PDDA solution (30 mL) in a conical flask, and then the flask was shaken for 20 min. The resultant solid material was washed with deionized water six times to obtain FAP.Surface-enhanced Raman spectroscopy (SERS) measurements
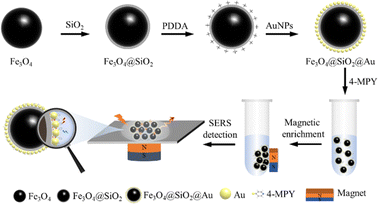
FAP (0.5 mL) was mixed with a 10 μM 4-MPY solution (25 mL) for 20 min, and then the supernatant was removed via magnetic enrichment and washed with deionized water three times, followed by the addition of deionized water (0.25 mL). The resultant samples were used to perform three types of SERS acquisitions. (1) The magnetic material (4 μL) was dropped onto a Si slide, and the SERS signal was acquired directly, without the application of an external magnet. (2) The magnetic material (4 μL) was dropped onto a Si slide and then magnetically enriched such that the center of the droplet contained a high proportion of the substrate particles, using magnets of different sizes directly below the magnetic material. (3) Magnets of different sizes were fixed directly below the Si slide, and then 4 μL of the magnetic material was dropped onto the Si slide for detection. In each case, a 785 nm laser with an excitation power of 105 mW and an acquisition time of 3 s were used. The complete substrate preparation and detection process is demonstrated in Fig. 1.COMSOL multiphysics simulation
To gain a deeper understanding of the near-field enhancement produced by an applied magnetic field on noble-metal nanoparticle substrates, a finite-element analysis was performed using COMSOL Multiphysics to examine the electromagnetic-field distribution near the surfaces of the AuNPs before and after the application of the magnetic field. The physical phenomena were simulated by solving partial differential equations. A 2 × 2 array model of the AuNPs (with a diameter of 20 nm) was created, and applied magnetic fields of 0.65 and 1.00 T were generated. The fluctuating optics and AC/DC modules were used to study the effect of the external magnetic field on the electromagnetic field of the Au nanosurface during irradiation with a 785 nm laser.Mantel test analysis
A Mantel test was performed using the ggcor package in R version 4.3.0 to analyze the correlation between EF and variables such as magnetic-field strength, area, GAP, hotspot density and 4-MPY density. Experiments with different magnetic fields strengths were conducted, and EF was calculated from spectral peak intensities. White-light images were used to determine the magnetic substrate area, from which GAP, hotspot density, and 4-MPY density were derived using the formulae in the ESI.† This data matrix was then used for Mantel test analysis.Results and discussion
Characterization of FA-4MPY
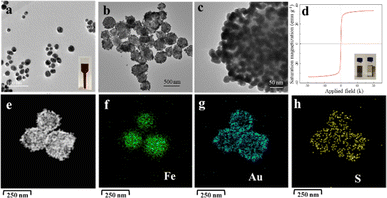
The satellite-like FA substrate has Fe3O4 as its magnetic core, which is encapsulated within a silica shell to improve stability and provide solid support for further growth and precious-metal coating. AuNPs were used to modify the surface of the magnetic microspheres through electrostatic interactions, and the FA substrate was synthesized via layer-by-layer assembly. The characterization of the FA substrate and its 4-MPY-probe-molecule-modified surface is shown in Fig. 2. It is apparent that the spherical AuNPs are uniformly modified on the surface of the magnetic core, and the elemental mapping (Fig. 2e–h) reveals that the Au and S are distributed in the areas around the Fe, confirming the successful synthesis of the substrate material with a satellite-like structure and successful 4-MPY modification.Effect of an applied magnetic field on the SERS signal
In our previous study, we found that applying external magnetic fields to magnetic substrates amplified the SERS signals of the probe molecules 2–3 fold.23 Building on these findings, our current investigation elucidates the mechanism of SERS hotspot engineering through external field assembly, which underlies the magnetic-field-induced enhancement of SERS signals on these substrates. The experimental setup employed a layer-assembled satellite-like plasmonic magnetic nanocomposite as the substrate, uniformly functionalized with 4-MPY via gold-thiol bonds, as shown in Fig. 1. During the SERS detection phase, magnets of varying magnetic strengths were placed directly beneath the substrate material on the silicon slide to fine-tune the magnetic-field distribution. This calibrated manipulation of the magnetic field is critical for precision engineering of SERS hotspots, enhancing the sensitivity and accuracy of the detection process (Fig. 3).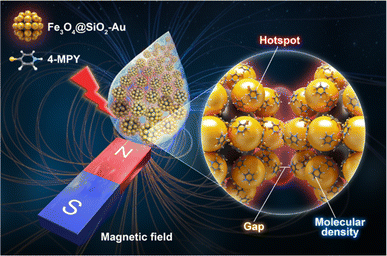 | ||
| Fig. 3 Schematic showing the modulation of a magnetic SERS substrate hotspot using an external magnetic field. | ||
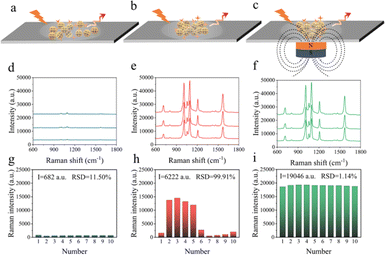
By applying a 103 mT magnetic field using the control variable method, we examined the effect of enrichment on the detected signals (Fig. 4). Fig. 4d–f show the characteristic Raman bands of 4-MPY molecules at 714, 1008, 1093, 1209, and 1570 cm−1, corresponding to ring breathing, C–S, C–H, and C![[double bond, length as m-dash]](https://www.rsc.org/images/entities/char_e001.gif) C vibrations.24 The highest intensity band at 1093 cm−1 was selected as the diagnostic band for quantifying the SERS signal. Without a magnet, the intensity range for this band was 528–819 a.u. After enrichment with a magnet, the detected signal intensity range increased to 550–14
C vibrations.24 The highest intensity band at 1093 cm−1 was selected as the diagnostic band for quantifying the SERS signal. Without a magnet, the intensity range for this band was 528–819 a.u. After enrichment with a magnet, the detected signal intensity range increased to 550–14![[thin space (1/6-em)]](https://www.rsc.org/images/entities/char_2009.gif) 530 a.u., and further increased to 18
530 a.u., and further increased to 18![[thin space (1/6-em)]](https://www.rsc.org/images/entities/char_2009.gif) 633–19
633–19![[thin space (1/6-em)]](https://www.rsc.org/images/entities/char_2009.gif) 303 a.u. with the application of a 103 mT magnetic field. Additionally, the relative standard deviation (RSD) of the intensities at 1093 cm−1 decreased from 11.50% to 1.14%. The uniformity of SERS signals was approximately 10-fold, and the signal intensity was approximately 27-fold higher after modulating the substrate distribution with magnets, consistent with previous reports.11–13,25 In the absence of magnetic modulation, the widely separated nanoparticles resulted in a scattered and inhomogeneous hotspot distribution. By contrast, the presence of an external magnetic field decreased the spacing between the FA particles, leading to plasma formation on the surface of the substrate and enhanced electromagnetic fields between the AuNPs. Simultaneously, the concentration of local probe molecules increased, amplifying the presence of 4-MPY molecules within the nanogap. The synergy of these two effects significantly enhances the SERS signals.5,9–11,19
303 a.u. with the application of a 103 mT magnetic field. Additionally, the relative standard deviation (RSD) of the intensities at 1093 cm−1 decreased from 11.50% to 1.14%. The uniformity of SERS signals was approximately 10-fold, and the signal intensity was approximately 27-fold higher after modulating the substrate distribution with magnets, consistent with previous reports.11–13,25 In the absence of magnetic modulation, the widely separated nanoparticles resulted in a scattered and inhomogeneous hotspot distribution. By contrast, the presence of an external magnetic field decreased the spacing between the FA particles, leading to plasma formation on the surface of the substrate and enhanced electromagnetic fields between the AuNPs. Simultaneously, the concentration of local probe molecules increased, amplifying the presence of 4-MPY molecules within the nanogap. The synergy of these two effects significantly enhances the SERS signals.5,9–11,19
Regulatory mechanism
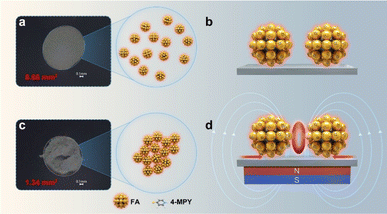
Building upon the fundamental principles outlined by Professor Kneipp from the Technische Universität Berlin in 1999,26 our research ventures into the nuances of SERS signal enhancement and its modulation by various factors. Kneipp's pivotal formula: PSERS(νS) = NσRads|A(νL)|2|A(νS)|2|I(νL) sheds light on the multifaceted influences on SERS effectiveness. This formula incorporates the intensity of the excitation light, I(νL), and the cross-sectional area of molecular adsorption, σRads, which can be increased by chemical enhancement. N is the number of molecules involved in the SERS process. The EFs for the laser and Raman scattering fields are denoted as A(νS) and A(νL), respectively. Acknowledged by the scientific community, this comprehensive equation underscores the SERS effect as a collective impact of various parameters, including the electromagnetic attributes of the substrate and the quantity and type of adsorbed molecules.27,28 Our study examines these integral components—hotspot density, probe molecular density, and near-field enhancement—to gain a deeper understanding of their concerted influence on SERS intensity.To investigate how the hotspot density and probe molecular density affect the SERS signal, the distribution of the magnetic substrate was observed before and after the application of a 103 mT magnetic field using a stereomicroscope. The results showed that in the absence of the magnetic field the nanoparticles naturally dispersed, forming a region with a natural drying area of 8.66 mm2 (Fig. 5a and b). When subjected to the magnetic field, the nanoparticles tended to coalesce as a consequence of the numerous multidirectional forces, leading to a diminution in the droplet's surface area to 1.34 mm2 (Fig. 5c and d). The satellite-like structure of the substrate facilitates coupling between nanoparticles, thereby generating multiple SERS hotspots. Quantitative analysis, presented in the ESI,† revealed a significant increase in particle densities following magnetic-field exposure: FA particle density increased from 1.0 × 10⁷ to 6.6 × 107 mm−2, SERS hotspot density from 2.1 × 10⁷ to 1.3 × 108 mm−2, and probe molecule density from 6.9 × 10¹⁴ to 4.5 × 1015 mm−2. The escalation in hotspot and probe molecule densities by two and one orders of magnitude, respectively, emphasizes the magnetic field's role in nanoparticle assembly and subsequent SERS signal enhancement. Exploration into the underlying mechanisms revealed that the induction of particle centralization by the external magnetic field decreased the inter-particle distances and increased the hotspot density among the AuNPs. This condition is anticipated to enhance the intensity of Raman signals, consistent with the experimental findings and hypotheses in previous studies.5–7,9–11,19 The particle centralization coincided with an increased concentration of probe molecules on the substrate surface, thereby enhancing the presence of probes within the interstitial spaces of the substrate and subsequently amplifying the signal.9 The empirical and analytical evidence collectively showed a direct correlation between the enhanced densities of hotspots and probe molecules with intensified SERS signals. A white-light image of the substrate distribution is shown in Fig. S2.† As the magnetic-field strength increased from 0 to 103 mT, the substrate particle distribution area decreased from 8.66 mm2 (Fig. S2a†) to 1.34 mm2 (Fig. S2g†). However, the area and gap do not change monotonously with the magnetic field. This can be attributed to the use of cylindrical magnets of different diameters and heights, affecting the magnetic field distribution. We have standardized our procedures to minimize errors, with specific data provided in supplementary Table S1.†
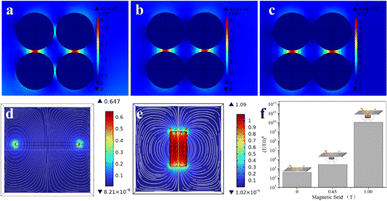
To investigate how the magnetic-field enhancement affects the SERS signal, COMSOL simulation was conducted to model the Au nanoarrays coupled with magnets. Fig. 6a–c show the simulation results for the Au nanoarray in the absence of a magnet and with magnetic fields of 0.65 and 1.00 T, respectively. The field distributions corresponding to Fig. 6b and c are shown in Fig. 6d and e, respectively; the field in Fig. 6e is evidently stronger. With 785 nm laser irradiation, coupling with the 0.65 T magnetic field increased the intensity of the electric-field mode on the surface of the AuNPs by 49%, and coupling with the 1.00 T magnetic field resulted in a 22-fold intensity. Compared to the background field magnetic field under a 785 nm laser, the Au nanoarrays have an EF of 4.2 × 10⁴ without the influence of an applied magnetic field, which is boosted to 3.4 × 10⁵ by the addition of a 0.65 T magnetic field and jumps to 1.1 × 10¹⁰ by the addition of a 1.00 T magnetic field (Fig. 6f). This enhancement is attributed to changes in the external magnetic field, particularly the magnetic flux, which induces an electromagnetic effect and results in an stronger electromagnetic field on the surface of AuNPs. These results are consistent with a previous study in that the near-field enhancement due to the applied magnetic field plays an important role in enhancing the SERS signal strength.20
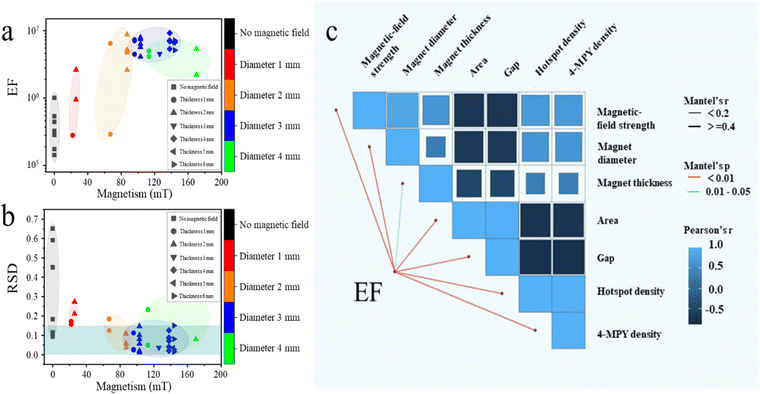
To investigate the variation in SERS signal strength with the applied magnetic field, we used various magnets with different specifications to produce a range of magnetic-field strengths between 0 and 187 mT. The results, shown in Fig. 7a, revealed that the applied magnetic fields significantly influenced the SERS signal strength, with a notable increase in EF values for the characteristic band at 1093 cm−1 observed at field strengths greater than 80 mT. The presence of the magnetic field elevated the EF values 8–39 fold compared with those in the absence of a magnetic field. Fig. 7b shows that the RSD for the EF was maintained below 15% for the bulk of observations. Under the influence of a magnetic field, the RSD of EF decreased from 59.15–9.44% to 28.70–1.14%. These findings demonstrate the stability of the signal under each magnetic condition.
To analyze the factors influencing the EF, a Mantel test was conducted to comprehensively assess the correlation between EF and various determinants. Specific data supporting these correlations are provided in the ESI.† The statistical results (Fig. 7c) showed a significant correlation between EF and several determinants, including magnetic-field strength, magnet diameter, and hotspot density with a correlation coefficient r ≥ 0.4, p < 0.01. The weak correlation with magnet thickness (r ≤ 0.2), suggesting its limited role in EF modulation. Among the various mechanisms reported in the literature, the interaction of external magnetic fields with magnetic substrates manifests primarily through three mechanisms: amplification of electromagnetic near-fields,20 induction of magnetic material aggregation,18 and concentration of adsorbed analyte molecules, which cumulatively enhance the SERS signal.11 These mechanisms elucidate the roles of increased local field strengths, densified electromagnetic hotspots, and the consequent intensification of the Raman scattering effect. Our work extends these foundational observations by providing empirical and simulation-based evidence on how hotspot density, probe molecular density, and near-field enhancements—orchestrated by precisely controlled external magnetic fields—serve as pivotal factors in refining SERS signal outputs from magnetic substrates.
Our findings reveal the indispensable need for meticulous control over nanoparticle aggregation to fortify these interactions for optimized amplification of SERS signals. This ensures both cost-effectiveness and improved performance, marking a significant step forward in the field. Our future research will focus on exploring the extent to which magnetic-field optimizations can further elevate SERS signal efficacy, with a particular emphasis on enhancing the efficiency of magnetic nanostructures. Such advancements are poised to redefine the landscape of SERS applications, particularly in scenarios demanding ultra-sensitive detection capabilities.
Conclusions
This work presents a comprehensive study on the mechanisms that propel amplification and standardization of SERS signals in the presence of external magnetic fields to advance magnetic nanoarchitectures. We advance the idea of creating innovative, versatile magnetic microsphere SERS substrates, which are anticipated to not only enhance the signal intensity linearly in relation to the strength of the magnetic field but also guarantee signal uniformity and dependability. Our results indicate that hotspot density, probe molecular density, and near-field enhancement—orchestrated by the external magnetic field—are the principal determinants in modulating the signals from magnetic SERS substrates. This study emphasizes the necessity of fine-tuning particle aggregation to ensure that the interplay between hotspot density, probe molecular density, and near-field enhancement leads to optimal SERS signal enhancement.Data availability
The data supporting this article have been included as part of the ESI.†Conflicts of interest
There are no conflicts to declare.Acknowledgements
This work was supported by the National Natural Science Foundation of China [no. U21A20290, 42077299 and 21707077].Notes and references
- J. Langer, D. J. de Aberasturi, J. Aizpurua, R. A. Alvarez-Puebla, B. Auguie, J. J. Baumberg, G. C. Bazan, S. E. J. Bell, A. Boisen, A. G. Brolo, J. Choo, D. Cialla-May, V. Deckert, L. Fabris, K. Faulds, F. J. G. de Abajo, R. Goodacre, D. Graham, A. J. Haes, C. L. Haynes, C. Huck, T. Itoh, M. Ka, J. Kneipp, N. A. Kotov, H. Kuang, E. C. Le Ru, H. K. Lee, J.-F. Li, X. Y. Ling, S. A. Maier, T. Mayerhofer, M. Moskovits, K. Murakoshi, J.-M. Nam, S. Nie, Y. Ozaki, I. Pastoriza-Santos, J. Perez-Juste, J. Popp, A. Pucci, S. Reich, B. Ren, G. C. Schatz, T. Shegai, S. Schlucker, L.-L. Tay, K. G. Thomas, Z.-Q. Tian, R. P. Van Duyne, T. Vo-Dinh, Y. Wang, K. A. Willets, C. Xu, H. Xu, Y. Xu, Y. S. Yamamoto, B. Zhao and L. M. Liz-Marzan, ACS Nano, 2020, 14, 28–117 CrossRef CAS PubMed.
- A. L. Chun, Nat. Nanotechnol., 2015, 87, 6017–6024 Search PubMed.
- E. Tiryaki, T. Zorlu and R. A. Alvarez-Puebla, Chem.–Eur. J., 2024, 30(24), e202303987 CrossRef CAS PubMed.
- B. H. Jun, G. Kim, J. Baek, H. Kang, T. Kim, T. Hyeon, D. H. Jeong and Y. S. Lee, Phys. Chem. Chem. Phys., 2011, 13, 7298–7303 RSC.
- D. A. Wheeler, S. A. Adams, T. López-Luke, A. Torres-Castro and J. Z. Zhang, Ann. Phys., 2012, 524, 670–679 CrossRef CAS.
- S. H. Toma, J. J. Santos, K. Araki and H. E. Toma, Anal. Chim. Acta, 2015, 855, 70–75 CrossRef CAS PubMed.
- T. X. Yang, X. Y. Guo, H. Wang, S. Y. Fu, Y. Wen and H. F. Yang, Biosens. Bioelectron., 2015, 68, 350–357 CrossRef CAS PubMed.
- Q. H. Guo, C. J. Zhang, C. Wei, M. M. Xu, Y. X. Yuan, R. A. Gu and J. L. Yao, Spectrochim. Acta, Part A, 2016, 152, 336–342 CrossRef CAS PubMed.
- J. Reguera, D. J. de Aberasturi, N. Winckelmans, J. Langer, S. Bals and L. M. Liz-Marzán, Faraday Discuss., 2016, 191, 47–59 RSC.
- T. Hou, Y. Liu, L. Xu, Y. Wu, Y. Ying, Y. Wen, X. Guo and H. Yang, Sens. Actuators, B, 2017, 241, 376–382 CrossRef CAS.
- P. Chen, A. Zhao, J. Wang, Q. He, H. Sun, D. Wang, M. Sun and H. Guo, Sens. Actuators, B, 2018, 256, 107–116 CrossRef CAS.
- Y. N. Wang, Q. Liu, Y. H. Sun and R. M. Wang, Nanoscale, 2018, 10, 12650–12656 RSC.
- Y. F. Huang, W. C. Huang, P. K. Hsu, J. M. Song, A. Gloter and S. Y. Chen, Appl. Surf. Sci., 2021, 536, 7 Search PubMed.
- B. H. Yin, W. K. H. Ho, Q. Zhang, C. Q. Li, Y. Y. Huang, J. X. Yan, H. R. Yang, J. H. Hao, S. H. D. Wong and M. Yang, ACS Appl. Mater. Interfaces, 2022, 14, 4714–4724 CrossRef CAS PubMed.
- D. You, R. Wang, J. Xie, L. Liu, K. Li, X. Han, T. Guo and C. Xu, J. Mater. Chem. A, 2022, 10, 14078–14089 RSC.
- T. Kokulnathan, K. M. Arun Kumar, T.-J. Wang, E. Ashok Kumar, A. Joseph Anthuvan, K.-J. Chen and Y.-Y. Liang, J. Mater. Chem. A, 2024, 12, 7287–7299 RSC.
- H. Li, P. Merkl, J. Sommertune, T. Thersleff and G. A. Sotiriou, Advanced Science, 2022, 9(22), 2201133 CrossRef CAS PubMed.
- J. Shen, Y. Zhu, X. Yang, J. Zong and C. Li, Langmuir, 2013, 29, 690–695 CrossRef CAS PubMed.
- W. Y. Cai, X. H. Tang, B. Sun and L. B. Yang, Nanoscale, 2014, 6, 7954–7958 RSC.
- C. Z. Fan, S. M. Zhu, H. Y. Xin, Y. C. Tian and E. J. Liang, J. Opt., 2017, 19, 7 CrossRef.
- S. Lu, J. Du, Z. Sun and C. Jing, Anal. Chem., 2020, 92, 16229–16235 CrossRef CAS PubMed.
- Z. Sun, J. Du, F. Duan, K. He and C. Jing, J. Mater. Chem. C, 2018, 6, 2252–2257 RSC.
- N. Wang, J. Du, X. Li, X. Ji, Y. Wu and Z. Sun, Anal. Chem., 2023, 95(34), 12956–12963 CrossRef CAS PubMed.
- J. Chen, Y. Huang, P. Kannan, L. Zhang, Z. Lin, J. Zhang, T. Chen and L. Guo, Anal. Chem., 2016, 88, 2149–2155 CrossRef CAS PubMed.
- C. B. Adamo, R. J. Poppi and D. P. de Jesus, Microchem. J., 2021, 160, 105704 CrossRef CAS.
- K. Kneipp, H. Kneipp, I. Itzkan, R. R. Dasari and M. S. Feld, Chem. Rev., 1999, 99, 2957–2976 CrossRef CAS PubMed.
- K. Kneipp, H. Kneipp and J. Kneipp, Acc. Chem. Res., 2006, 39, 443–450 CrossRef CAS PubMed.
- A. S. De Silva Indrasekara, PhD thesis, Rutgers The State University of New Jersey, 2014.
Footnote |
| † Electronic supplementary information (ESI) available: Density calculations of 4-MPY and the effect of different magnet sizes on the substrate. See DOI: https://doi.org/10.1039/d4ta02854f |
| This journal is © The Royal Society of Chemistry 2024 |

