 Open Access Article
Creative Commons Attribution 3.0 Unported Licence
Elucidating the particle size-dependent guest-induced structural transition of flexible metal–organic frameworks by exploring cooperative nature†
Homare
Arima
 ,
Shotaro
Hiraide
 * and
Satoshi
Watanabe
 *
*
Department of Chemical Engineering, Kyoto University, Nishikyo, Kyoto 615-8510, Japan. E-mail: hiraide@cheme.kyoto-u.ac.jp; nabe@cheme.kyoto-u.ac.jp
First published on 12th August 2024
Abstract
Flexible metal–organic frameworks (MOFs) exhibit a structural transition induced by adsorption of guest molecules. This guest-induced structural transition occurs at a certain gas pressure, resulting in an S-shaped adsorption isotherm. Consequently, these materials exhibit a high working capacity, making them highly competitive in energy-saving separation processes. However, the understanding of hysteresis loops between adsorption and desorption branches remains insufficient for industrial applications. Specifically, the particle size dependence of hysteresis behaviors is still actively being investigated. Generally, smaller particles of flexible MOFs show larger hysteresis loops. Herein, we constructed a simple multi-scale simulation model that couples molecular simulations for a unit cell with Ising lattice model-based simulations, in which solid–solid interactions for adjacent unit cells are considered, to address the cooperative nature within a flexible MOF particle. The solid–solid interactions strongly link unit cells in an identical state to form a domain, minimizing the heterointerface area. In transition states, the interfacial energy is independent of particle size, whereas the configurational entropy is significant for large particles, leading to a pronounced size dependence. This is applicable to real systems on the micron order, which is confirmed by the linear correlation between particle size and the free energy change of the unit cell over the hysteresis range. The correlation enables estimating particle size-dependent adsorption behavior, and consequently, tailoring the transition behaviors of flexible MOFs for target systems by controlling particle size. This study advances the understanding of hysteresis in guest-induced structural transitions and provides insights for designing adsorption-based separation processes.
1 Introduction
Recently, the disparity between the actions taken and those necessary to reduce greenhouse gas emissions has widened.1 Consequently, the development of energy-efficient separation technologies, including adsorption and membranes, is an urgent priority.2 Metal–organic frameworks (MOFs) have attracted significant attention for adsorption-based separation processes owing to their inherent potential arising from the infinite combinations of metal ions and coordinated organic linkers, which allows control over pore size and host–guest interactions.3 Several MOFs exhibit structural flexibility in response to external stimuli,4–8 suddenly changing their structures from a closed-pore (cp) to an open-pore (op) form at a specific threshold pressure during adsorption. This guest-induced structural transition is called the “gate opening” behavior and adsorption isotherms on flexible MOFs have a characteristic S-shape. Other specific MOFs show a reversible transition behavior through a single adsorption process, occurring from a large-pore (lp) to a narrow-pore (np) form at a low pressure and subsequently from the np to lp form at a high pressure. This reversible transition, so-called the “breathing” behavior, exhibits the similar adsorption isotherms and occurs due to the same mechanism as the gate adsorption. A stepwise isotherm enables a larger working capacity with only a slight pressure change, compared to the conventional type I isotherm. Guest recognition4,9 and intrinsic thermal management10,11 capabilities also have positive effects on adsorption-based separation processes,12 rendering flexible MOFs promising materials that should be urgently investigated.13In general, adsorption behavior involving a phase transition is accompanied by hysteresis. A typical example is capillary condensation in nanopores, in which the evaporation (desorption) process starts at a lower pressure (Pdes) than the condensation pressure during adsorption (Pads).14,15 The hysteresis behavior is not preferable for adsorption-based separation processes, because compared to an ideal adsorbent that exhibits an equilibrium transition at the same pressure for both adsorption and desorption branches, the adsorption and desorption processes require increasing and decreasing pressures to induce the transition, respectively, resulting in additional energy consumption.16 However, the capillary condensation/desorption pressures are determined only by the pore size and the surface properties of the pore walls,17 indicating that the width of the hysteresis loop cannot be controlled within the same material. Similarly, the guest-induced structural transition of flexible MOFs involves hysteresis and depends on the type of MOF;18 however, a crucial difference from the capillary condensation is that the hysteresis behavior depends on the particle size. Sakata et al. first reported that smaller particles of [Cu2(bdc)2(bpy)] (bdc = 1,4-benzenedicarboxylate, bpy = 4,4′-bipyridine) exhibit larger hysteresis.19 This tendency has also been observed in other flexible MOFs, such as breathing,20 swelling,21 and linker-bending types.22–26 Interestingly, an anisotropic size effect was observed for DUT-8(Ni) ([Ni2(ndc)2(dabco)]; ndc = 2,6-naphthalenedicarboxylate, dabco = 1,4-dizabicyclo[2.2.2]octane).24,27 The crystal width, which corresponds to the planar direction of the sheet composed of ndc paddle-wheels, affected its hysteresis loop, whereas the crystal length, aligning with the direction in which dabco ligands link the ndc sheets, had no significant effect. These observations indicate that elucidating the size effect can uncover new possibilities for controlling the hysteresis behavior while maintaining the other desired properties of the target MOFs.
The theoretical understanding of hysteresis loops has been developed based on a thermodynamic framework for guest-induced structural transitions,28 which explains the transition pressure as the point at which the free energy of the cp structure equals that of the op structure encapsulating the guest molecules. Based on molecular simulations using a toy model that mimics jungle gym-type MOF structures, we demonstrated the existence of an energy barrier between the cp and op phases,29 and many subsequent corroborating studies have reported that the hysteresis loop is caused by the additional pressure variance required for the system to overcome the energy barrier.30–33 However, the model cannot explain the size effect of the hysteresis behavior (which is discussed in detail below), mainly because it implicitly assumes a uniform transition within a bulk crystal, represented by a series of replicates of a nanoscale periodic unit cell. The current understanding of the energy barrier fails to incorporate aspects that are considered important when considering size dependence. These aspects include the effects of surface properties and the cooperative nature observed over long distances, which are only apparent in mesoscale systems wherein constituting unit cells are allowed to adopt different states. Several pioneering studies have been reported regarding this cooperative nature.34–39 Vandenhaute et al.37 developed a mesoscale simulation box of MIL-53(Al), showing that the simulation box exhibits a mixed-phase state during the transition induced by mechanical pressure, in which a unit cell within the simulation box tends to take on the same phase as its neighbors, thereby forming domain structures of cp and op phases. Mitsumoto and Takae38 constructed a toy model that accounts for distortion energy upon structural deformation, revealing that the difference in the domain structures between adsorption and desorption processes causes hysteresis. Their results suggest that the transition state in actual systems does not lie in the intermediate structure between the cp and op structures, as suggested by earlier studies, but rather in the cooperative nature where the interactions between neighboring flexible motifs play a key role.40,41 Therefore, a detailed investigation into the cooperative nature to redefine the “true” energy barrier would reveal the size-dependent hysteresis behavior.
In this study, we elucidated the guest-induced structural transition including the particle size dependence of the hysteresis loop. We developed a simple multi-scale simulation model that couples molecular simulations for a nanoscale unit cell with Ising lattice model-based simulations for a mesoscale system, thereby addressing the cooperative nature between motifs within frameworks of a MOF particle. As a model case, we focused on ELM-11 ([Cu(BF4)2(bpy)2]),42,43 which possesses a stack-layered structure and exhibits a guest-induced structural transition arising from the expansion of its interlayer widths. The material displays a high degree of selectivity for CO2/CH4 separation, thereby realizing an energy-efficient process for the treatment of industrial exhaust gas.12
2 Theoretical procedures
2.1 Thermodynamics of guest-induced structural transition
The osmotic free energy of a unit cell, as part of a bulk MOF crystal having a stack-layered structure, denoted as ωos, is represented by| ωos(h,P) = fhost(h) + ωguest(h,P) | (1) |
 | (2) |
| ΔΩos = MΔωos(h,P) | (3) |
However, it is better to express ΔΩos as a function of interlayer widths composed of unit cells, h = (h1, h2, …, hM). ΔΩos(h,P) should include the free energy term for each unit cell, Δωos(hi,P), and interactions between unit cells representing a penalty for adjacent cells in different states. In this context, the primitive theory corresponds to the assumption of an infinite inter-unit-cell penalty, which enforces all unit cells to have an identical interlayer width. Note that in the derivation of the equation for the structural transition-type adsorption (STA equation39) reported by our group, ΔΩos(h,P) is modeled as follows:
 | (4) |
In contrast, the present study directly addresses the inter-unit-cell interaction. Specifically, ΔΩos(h,P) was modeled as
 | (5) |
 | (6) |
 | (7) |
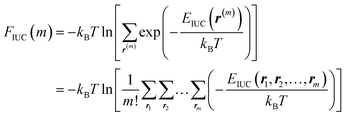 | (8) |
Through the last transformation in eqn (8), the meaning of r changes from the index vector to the integer coordinates for m distinguishable op “particles.” Consequently, the summation is divided by m! to eliminate duplication. Furthermore, EIUC is also extended to return ∞ if any two of the m particles have identical coordinates, ensuring that exp(−EIUC/kBT) = 0. Taken together, ΔΩos can be modeled as a function of m and P as
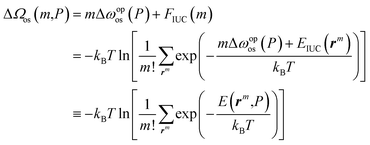 | (9) |
 | (10) |
we can obtain the ensemble average of m, 〈m〉, at a given P. Consequently, the average amount adsorbed, Nguest, can be determined using the adsorbed amount for a unit cell in the op phase, nopguest, such that:
| Nguest(P) = 〈m〉nopguest(P) | (11) |
Furthermore, the test particle method44 enables us to evaluate the profile of ΔΩos(m,P) as
 | (12) |
2.2 Simulation model
To evaluate E(rm,P), we performed two types of simulations. The first, named “nanoscale simulation,” involves conducting molecular simulations for a toy model that mimics the framework structure of ELM-11 to obtain variables regarding the unit cell, such as nopguest(P) and Δωopos(P) (Fig. 1a). We used the same toy model as in our previous studies,31–33 where the stack-layered structure of ELM-11 is represented by a pair of planes with a pillar atom and the cell size of 10σgg × 10σgg × h (σgg: the size parameter of the Lennard-Jones (LJ) potential for a guest molecule). The second, named “mesoscale simulation,” represents the cooperative behavior within a particle. We constructed a particle model consisting of Mx × My × Mz (= M) unit cells that adopt either the cp or op phase, with interfacial energy Ji imposed if the adjacent cell in the i-direction is in the different state. MC simulations were conducted for this particle model to obtain Nguest(P) and ΔΩos(m,P) according to eqn (11) and (12) (Fig. 1b). As the stack-layered structure should have a much stronger connection in the x- and y-directions due to coordination bonds than in the z-direction which stems from van der Waals interactions, we assumed Jx = Jy (≡ J#), Jz = 0, and Mx = My (≡ M#) and varied J#, M#, and Mz as a first step. For more details, refer to Section 5.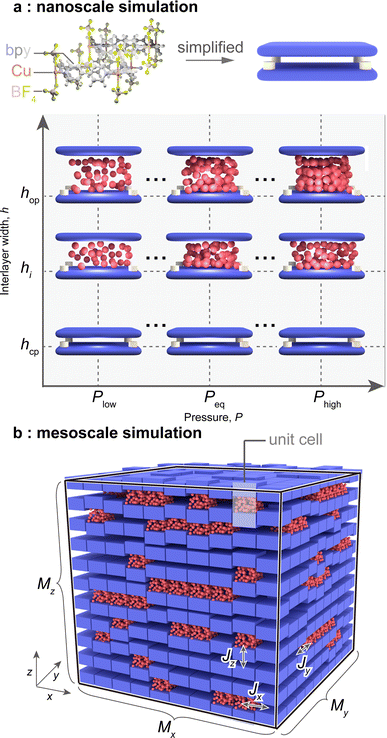 | ||
| Fig. 1 Schematics of (a) the toy model that mimics the framework structure of ELM-11 and (b) the particle model where the unit cells can undergo transitions while interacting with adjacent cells. | ||
Note that all variables are discussed in their dimensionless forms using the LJ parameters of the guest molecule, σgg and εgg, where εgg is the depth of the LJ potential. Throughout all simulations, the temperature was fixed at kBT/εgg = 1.
3 Results and discussion
3.1 Particle size-dependent behaviors of ELM-11
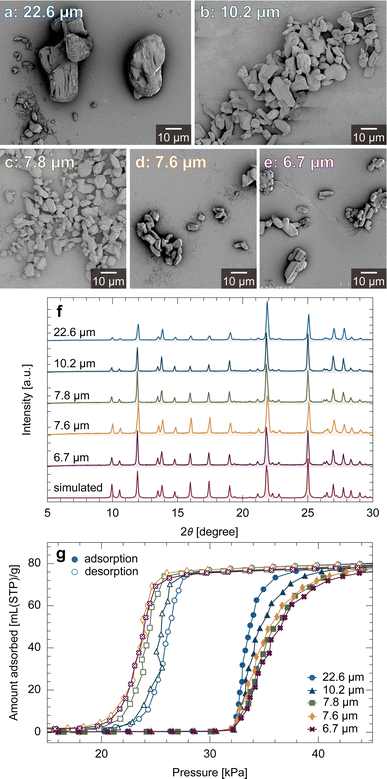
First, we experimentally examined the size-dependent behaviors of ELM-11 (see Section 5 for synthesis and analysis procedures). Fig. 2a–e show scanning electron microscopy (SEM) images of ELM-11 particles synthesized under various concentration conditions. X-ray diffraction (XRD) measurements confirmed that these particles are the hydrated form of ELM-11 (ref. 45) (Fig. 2f), and the particles sizes on the longer side measured 22.6 ± 10.0, 10.2 ± 4.1, 7.8 ± 2.6, 7.6 ± 2.7, and 6.7 ± 2.6 μm, respectively (particle size distributions are provided in Section S2, ESI†). Higher concentrations resulted in smaller particles, which agreed with the classical nucleation theory and the results of ZIF-8 synthesis.46,47Fig. 2g shows CO2 adsorption isotherms on the ELM-11 samples at 273 K, indicating a clear trend wherein smaller particles exhibit larger hysteresis and less distinct S-shaped curves. This aligns with the tendencies exhibited by other flexible MOFs.19,20,22–26,483.2 Nanoscale simulation of the unit cell
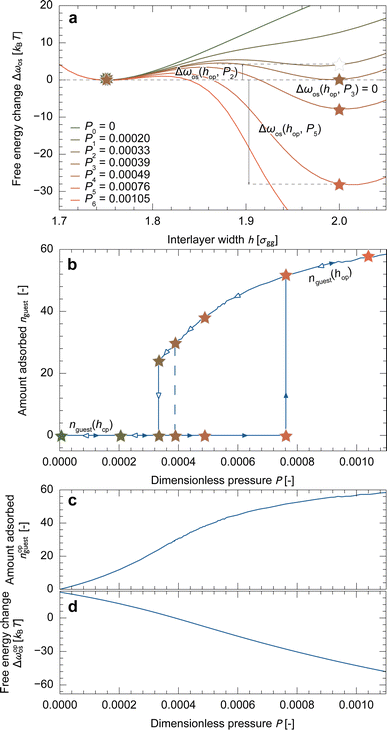
Fig. 3a depicts the free energy landscape of the unit cell along the interlayer width. At P = 0, the free energy increases as h increases, which represents the free energy change of host-framework deformation, Δfhost, as no guest molecules are adsorbed. With increasing pressure, guest adsorption stabilizes the system, leading to a decrease in Δωos for a larger h. The bistable state is established at P = P3, indicating that P3 is the equilibrium transition pressure for a unit cell (Peq). As the stable state switches across Peq, the adsorption isotherm exhibits a stepwise shape, as depicted by the dashed line in Fig. 3b. From these results, we determined hop = 2.00σgg and obtained nopguest(P) and Δωopos(P) profiles from the data, as shown in Fig. 3c and d, which were used in the subsequent mesoscale simulations.Note that the primitive theory attributes the cause of the hysteresis loop to the energy barriers found in the free energy profiles shown in Fig. 3a.31 For example, assuming that the system can overcome an energy barrier lower than 2kBT through thermal fluctuation, the transition during adsorption would occur at P = P5 (> Peq), while during desorption, it would occur at P = P2 (< Peq), as depicted by the solid lines in Fig. 3b. However, this approach has resulted in an incomplete understanding in two aspects: first, the simulated adsorption isotherms exhibit a stepwise shape at the transition pressure, whereas experimental results show gradual changes within narrow pressure ranges (Fig. 2g). Second, according to eqn (3), ΔΩos is the product of Δωos and the number of unit cells. This suggests that a larger particle has a higher energy barrier, and thus, a larger hysteresis loop (details are present in Section S3†), which contradicts the experimental observations (Fig. 2g). To explain the experimental results, the energy barrier must be lower for larger particles.
3.3 Mesoscale simulation for the particle model
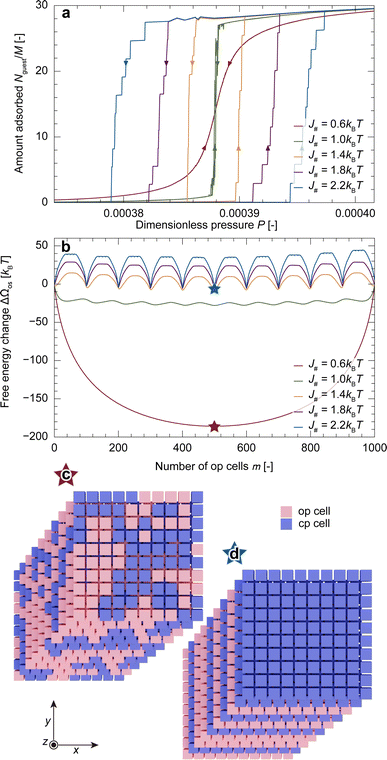
Fig. 4a depicts adsorption isotherms for the particle model (M# = Mz = 10) with various J#. These adsorption behaviors showed three features: (1) weak interaction between unit cells, as represented by J# = 0.6kBT, resulted in no hysteresis loops. (2) Moderate interaction caused a step-by-step change in the amount adsorbed, accompanied by hysteresis. (3) Strong interaction expanded the hysteresis loop. All these points can be explained by the free energy landscapes at P = Peq, i.e., ΔΩos(m,Peq). Fig. 4b shows free energy profiles with various J# values at P = Peq. A small J# exhibited a downward-convex profile with no energy barriers. In contrast, the profiles with a larger J# exhibited repeated upward convexes; these energy barriers inhibited the equilibrium transition and caused hysteresis. Further increasing J# increased the energy barriers and consequently widened the hysteresis loop.In principle, free energy is determined by the balance between internal energy and entropy. Because Δωopos equals zero at P = Peq, the free energy profiles illustrated in Fig. 4b consist solely of FIUC, which is determined by the balance between how comfortable a cell feels towards its neighbors and how freely op cells are placed. The downward-convex profiles with smaller J# demonstrate that, under these conditions, the entropic contribution controls the system as the interfacial energy is too small. A snapshot at the stable point, highlighted with a star symbol, illustrates the seemingly random coexistence of cp and op cells, supporting this explanation (Fig. 4c). The free energy profile remained downward convex with increasing pressure while the value of m at which ΔΩos reaches its minimum varied, resulting in a gradual increase in adsorption without hysteresis (details are provided in Section S4†). In contrast, as shown in Fig. 4d, increasing J# tends to make all unit cells within the same layer share an identical state so that the interfacial contribution is minimized, leading to Mz + 1 local minima when m is a multiple of M#2. Therefore, the system needs to overcome an energy barrier Mz times, resulting in a step-by-step adsorption increase with a hysteresis loop. These findings indicate that an experimentally obtained S-shaped isotherm with a large increase in uptake within a narrow pressure range originates from the layer-by-layer transition in a MOF particle.
3.4 Size dependence of a guest-induced structural transition
Fig. 5a shows adsorption isotherms for a particle with various M# under the conditions of Mz = 10 and J# = 2.2kBT, demonstrating that decreasing M# resulted in a wider hysteresis loop. Because M# can be regarded as being proportional to particle size, the results qualitatively coincide with the experimental observation (Fig. 2g). Fig. 5b shows that the energy barrier at a pressure higher than Peq increases as M# decreases, which should be the cause of the widening hysteresis loop. To clarify the mechanism behind the obtained results, we attempt to simplify ΔΩos(m,P) (eqn (9)) under appropriate assumptions. As discussed in the previous section, the process that causes an energy barrier fundamentally involves a transition within a layer. Because Jz was set to 0 in the simulations, each layer can be regarded as independent from the other layers. This means that one simulation with Mz layers is statistically identical to the average of Mz individual simulations with a single layer (details are provided in Section S5†). Therefore, the key is to understand the free energy profile of a single layer, as shown in Fig. 5c where M# = 1 and J# = 2.2kBT. The snapshots in Fig. 5c show that, with such a large J#, op cells exist adjacent to each other to form a domain, which allows categorizing the transition into three stages: both the initial and final stages feature square-shaped domains, albeit with different phase compositions, while the intermediate stage presents a rectangular shape with the long side of M#. Both square and rectangular shapes have the minimum interfacial areas under periodic boundary conditions. Given that the intermediate stage presents a plateau region in ΔΩos(m,Peq) and that ΔΩos(m,P) can be expressed as mΔωopos(P) + ΔΩos(m,Peq), the transition state having a local maximum energy emerges in the initial stage during the adsorption process (Δωopos < 0), as demonstrated in Fig. 5b. Here, ΔΩos(m,P) can be rewritten in a different form from eqn (9) using the energy levels of the interfacial interaction, εIUC,c (c: the index for the energy level), and the number of configurations satisfying EIUC = εIUC,c, denoted as wc, as follows: | (13) |
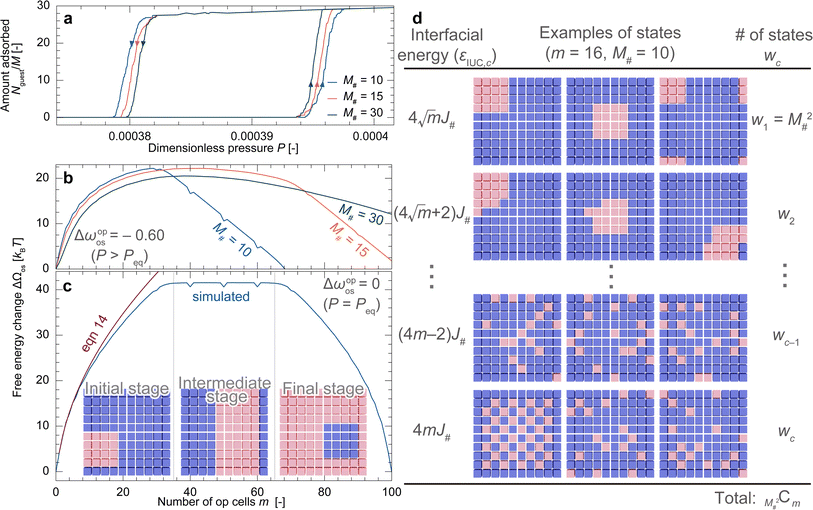 | ||
| Fig. 5 (a) Adsorption isotherms for the particle model with various M#. (b) Free energy profiles at a higher pressure than Peq, indicating that a smaller M# exhibits a higher energy barrier. (c) The free energy profile of a single layer (Mz = 1) with M# = 10 and J# = 2.2kBT at P = Peq, showing three stages with different domain shapes. The red line represents an approximated curve of the free energy profile during the initial stage (eqn (14)). (d) Schematic representations of the states at m = 16. | ||
Note that in eqn (13), the op cells are regarded as indistinguishable. Assuming a square number for m, the energy level in the initial stage should be  in ascending order, as illustrated in Fig. 5d. Under the conditions where the interfacial energy is governed, considering only the lowest energy level state should provide a good approximation. Therefore, eqn (13) can be transformed as
 | (14) |
The red line in Fig. 5c represents eqn (14), demonstrating a reasonable approximation for the profile in the initial stage, including non-square numbers of m. Differentiating eqn (14) with respect to m provides the transition state as
 | (15) |
Therefore, the height of the energy barrier, ΔΩtr, can be approximated as:
 | (16) |
While the first energetic term remains constant regardless of layer size, the second entropic term reduces the energy barrier more significantly for larger layers. Therefore, we conclude that particle size-dependent hysteresis primarily arises from the entropic contribution.
Eqn (16) also indicates an important relationship between particle size and transition pressure. Assuming that the system can overcome the energy barrier with the height of κ through its thermal fluctuations, eqn (16) can be rewritten as
 | (17) |
![[thin space (1/6-em)]](https://www.rsc.org/images/entities/char_2009.gif) M# and 1/Δωopos. Fig. 6a shows the plot of ln
M# and 1/Δωopos. Fig. 6a shows the plot of ln![[thin space (1/6-em)]](https://www.rsc.org/images/entities/char_2009.gif) M#vs. 1/Δωopos obtained from simulations for single layers with M# = 10, 15, 30, 50, and 100, where Δωopos was evaluated at the pressure at which the adsorption branch reaches its transition ratio m/M#2 of 0.5 (see Fig. S6† for the obtained isotherms). Fig. 6a demonstrates clear linearity between ln
M#vs. 1/Δωopos obtained from simulations for single layers with M# = 10, 15, 30, 50, and 100, where Δωopos was evaluated at the pressure at which the adsorption branch reaches its transition ratio m/M#2 of 0.5 (see Fig. S6† for the obtained isotherms). Fig. 6a demonstrates clear linearity between ln![[thin space (1/6-em)]](https://www.rsc.org/images/entities/char_2009.gif) M# and 1/Δωopos, which agrees well with eqn (17). However, the slope and intercept of the regression line indicate that J# = 1.49kBT and κ = 10.4kBT, which differ slightly from the exact values: J# = 2.2kBT (a set value) and κ = 23kBT (the average energy barrier heights in the actual free energy profiles for layers with various M#). These deviations probably arise from the assumption that only the lowest energy state is considered. Nonetheless, this linearity is useful to validate the applicability of our simulation to experimental systems, as discussed below.
M# and 1/Δωopos, which agrees well with eqn (17). However, the slope and intercept of the regression line indicate that J# = 1.49kBT and κ = 10.4kBT, which differ slightly from the exact values: J# = 2.2kBT (a set value) and κ = 23kBT (the average energy barrier heights in the actual free energy profiles for layers with various M#). These deviations probably arise from the assumption that only the lowest energy state is considered. Nonetheless, this linearity is useful to validate the applicability of our simulation to experimental systems, as discussed below.
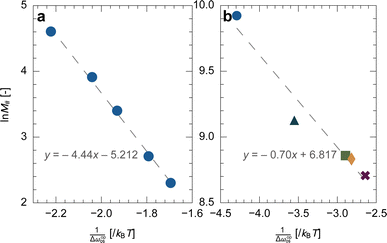 | ||
Fig. 6 Plot of ln![[thin space (1/6-em)]](https://www.rsc.org/images/entities/char_2009.gif) M#vs. 1/Δωopos for (a) the simulation results and (b) the experimental results (Fig. 2g). The dashed lines represent the regression lines. M#vs. 1/Δωopos for (a) the simulation results and (b) the experimental results (Fig. 2g). The dashed lines represent the regression lines. | ||
3.5 Validation of the simulation model through comparison with experimental results
Due to computational costs, our simulation was limited to a maximum size of M# = 100. Considering that the unit cell size of ELM-11 is approximately 1.1 nm (the length of Cu–bpy–Cu), our results only cover less than 100 nm. Therefore, we examined the linear relationship between ln![[thin space (1/6-em)]](https://www.rsc.org/images/entities/char_2009.gif) M# and 1/Δωopos in experimental results (Fig. 2g) to indirectly demonstrate the applicability of our simulation model to real-system conditions, specifically at the micrometer scale. According to the primitive theory, Δωopos(Pads) can be obtained by28
M# and 1/Δωopos in experimental results (Fig. 2g) to indirectly demonstrate the applicability of our simulation model to real-system conditions, specifically at the micrometer scale. According to the primitive theory, Δωopos(Pads) can be obtained by28 | (18) |
| Δωopos(Pads) = −Δωopos(Pdes) | (19) |
Therefore, eqn (18) can be transformed without Peq as
 | (20) |
In the second transformation, nopguest was modeled by the Langmuir equation, characterized by the parameters n∞ and K. Note that eqn (19) also provides the important insight that Peq can be numerically determined from an experimental isotherm (see Section S7 for details†). As n∞ and K of the ELM-11–CO2 system were determined to be 3.910 mmol g−1 and 0.201 kPa−1 at 273 K, respectively,39 Δωopos can be evaluated from the experimental adsorption and desorption branches. Fig. 6b shows the plot of ln![[thin space (1/6-em)]](https://www.rsc.org/images/entities/char_2009.gif) M#vs. 1/Δωopos for ELM-11 derived from experimental results, where the M# values were calculated by dividing the mean particle size by 1.1 nm. The experiments also confirmed clear linearity, suggesting our transition model is valid in actual MOFs. Substituting eqn (20) into eqn (17) yields:
M#vs. 1/Δωopos for ELM-11 derived from experimental results, where the M# values were calculated by dividing the mean particle size by 1.1 nm. The experiments also confirmed clear linearity, suggesting our transition model is valid in actual MOFs. Substituting eqn (20) into eqn (17) yields:
 | (21) |
By extrapolating the regression line in Fig. 6b, we can estimate how the width of the hysteresis loop changes with particle sizes. For example, if we could synthesize one order of magnitude larger ELM-11 particles (100 μm), the width of the hysteresis loop would be 4.8 kPa, which is 1.7 times narrower than that of 22.6 μm ELM-11 particles (Fig. 2g). This would provide guidelines for synthesizing a flexible MOF with a narrow hysteresis loop, thereby reducing the additional pumping cost in adsorption-based separation processes. However, eqn (21) also indicates that the hysteresis loop never disappears even if millimeter-sized single crystals are synthesized (e.g., 3.2 kPa for 1 mm and 2.4 kPa for 10 mm), because the size responsiveness becomes milder for larger particles, which follows an experimental trend.24
Finally, we discuss the validity of the approach taken in this study, which posits that the transition state controlling the system's behavior stems from the interfacial energy rather than the intermediate structure during the layer expansion of the unit cell. At P = Peq where Δωopos = 0, the transition state of the entire particle is at the intermediate stage of Fig. 5c. Considering only the lowest energy state, the energy barrier at the intermediate stage can be approximated as
ΔΩtr(Peq,M#) = 2M#J# − kBT![[thin space (1/6-em)]](https://www.rsc.org/images/entities/char_2009.gif) ln ln![[thin space (1/6-em)]](https://www.rsc.org/images/entities/char_2009.gif) 2M# 2M# | (22) |
To disregard the effect of the intermediate structure during the layer expansion, the following points should be verified: first, Δωtr is much smaller than ΔΩtr, thereby allowing the height of the energy barrier to be regarded as ΔΩtr. Second, the total energy barrier when all the unit cells undergo transition simultaneously, i.e., M#2Δωtr, is much greater than the ΔΩtr value, thereby making the transition state stemming from the interfacial energy an actual saddle point. Thus,
Δωtr ≪ 2M#J# − kBT![[thin space (1/6-em)]](https://www.rsc.org/images/entities/char_2009.gif) ln ln![[thin space (1/6-em)]](https://www.rsc.org/images/entities/char_2009.gif) 2M# ≪ M#2Δωtr 2M# ≪ M#2Δωtr | (23) |
is the required condition. By assuming Δωtr ≃ 4.6kBT (Fig. 3c) and 10 μm particles (M# ∼ 104), the order of J# should be much larger than 10−3kBT and smaller than 104kBT. It is plausible to assume that the energy arising from the interfaces is larger than the thermal motion (∼kBT) but smaller than the reaction heat (∼102kBT) involved in cleaving and connecting chemical bonds,49 which satisfies the requirement condition. Therefore, we can conclude that the intermediate structure during the layer expansion does not severely affect the system's transition behavior nor hysteresis behaviors.
4 Conclusion
This study explored the particle size dependence of guest-induced structural transitions from experimental and theoretical perspectives. We conducted mesoscale simulations of multiple unit cells, considering the interfacial interactions between adjacent cells in different states, to understand the size effect. These interactions strongly bind cells in the same state, creating a domain that reduces the heterointerface area. While the energetic term contributing to the free energy profile is independent of particle size, the configurational entropic term increases with particle size, resulting in a pronounced size dependence of the hysteresis loop.Finally, we note three limitations of this study and one perspective. The limitations are as follows:
(1) In our model, we consider interactions only between adjacent cells, which might be insufficient for modeling guest-induced structural transitions that involve drastic deformation. To accurately model the distortions, considering interactions with non-adjacent or diagonally adjacent cells would be effective, as some studies have demonstrated in exploring solid–solid phase transitions in complex magnetic materials.50,51
(2) Eqn (17) has room for improvement. Although the experimental results showed a linear correlation between ln![[thin space (1/6-em)]](https://www.rsc.org/images/entities/char_2009.gif) M# and 1/Δωopos (Fig. 6b), comparing the regression line to eqn (17) indicates that κ is less than zero, i.e., a negative thermal fluctuation. This unnatural outcome may stem from the accuracy of eqn (14) (as discussed above), the discrepancy between an actual ELM-11 and the ideal condition of Jz = 0, and the way that M# was derived from experiments (where particle size was considered in Fig. 6b, though crystallite size might be more appropriate). An improved linear equation that addresses these concerns is highly promising, offering the potential to gain quantitative insights into interfacial energy and thermal fluctuation in real systems.
M# and 1/Δωopos (Fig. 6b), comparing the regression line to eqn (17) indicates that κ is less than zero, i.e., a negative thermal fluctuation. This unnatural outcome may stem from the accuracy of eqn (14) (as discussed above), the discrepancy between an actual ELM-11 and the ideal condition of Jz = 0, and the way that M# was derived from experiments (where particle size was considered in Fig. 6b, though crystallite size might be more appropriate). An improved linear equation that addresses these concerns is highly promising, offering the potential to gain quantitative insights into interfacial energy and thermal fluctuation in real systems.
(3) Although our model demonstrates the typical size dependence shown by specific flexible MOFs, such as ELM-11, Cu2(bdc)2(bpy),19 MIL-53,20 and DUT-8,22–26 some other unique size dependence cannot be explained. Specifically, ZIF-8 exhibits a shift to a higher transition pressure in both the adsorption and desorption branches as the particle size decreases. A previous study suggested that this phenomenon is caused by the weaker adsorption potential near the surface; therefore, a smaller particle with a larger specific surface area requires additional pressurization to undergo a transition in both the adsorption and desorption branches.52 This exception highlights the necessity to expand our model to incorporate surface contributions for a comprehensive understanding of the size-dependent hysteresis behavior.
Despite these limitations, our simulation model is useful not only for understanding the fundamental mechanism behind size-dependent hysteresis behavior, but also for exploring dependences on framework type. In this study, we focused on stack-layered MOFs having stronger connections within their two-dimensional layers. However, some MOFs display stronger connections along one-dimensional paths, such as [Cu(BF4)2(bpp)2] (bpp = 1,3-bis(4-pyridyl)propane).53,54 The behavior of these one-dimensional chain MOFs could be simulated using our model with Jz > 0 and J# = 0, preliminary results of which are shown in Section S8.† Although a trend similar to that observed in the stack-layered MOF was obtained with an increase in interfacial energy, the S-shaped uptake upon structural transition was less distinct compared to those in Fig. 4a. This observation aligns with the experimental results: [Cu(BF4)2(bpp)2] exhibits a more gradual adsorption increase compared to ELM-11.53,54 Furthermore, when J# and Jz have specific non-zero values, a decrease in M# resulted in a widening of the hysteresis loop, whereas Mz had no impact on the behavior. This tendency agrees with the anisotropic size effect observed in DUT-8(Ni)24 (see Section S8† for prospective results). Additionally, our simulation model also has the potential to elucidate a more generalized system with three-dimensional interfacial interactions (Fig. S9†). A systematic investigation using our model, considering the type of connectivity in the framework, would provide a comprehensive understanding of the size-dependent hysteresis behavior of flexible MOFs; such a study is currently underway and will be reported elsewhere.
5 Methods
5.1 Synthesis of ELM-11 samples
ELM-11 was synthesized by the following procedure, which is based on our previous report.45,55 First, 0.295 g 4,4′-bipyridine (bpy; 98.0%, Tokyo Chemical Industry Co., Ltd) was dissolved in 1.181 mL methanol (99.%, Kishida Chemical Co., Ltd). Second, 0.283 mL of a Cu(BF4)2 45% aqueous solution (Kanto Chemical Co., Inc.) was mixed with 0.738 mL deionized water prepared using an Arium®mini plus (Sartorius) water purification system. Subsequently, the bpy methanol solution was added dropwise into a Cu(BF4)2 aqueous solution in a vial while stirring with a magnetic stirrer at room temperature (∼297 K). The dropwise addition was completed slowly over 2 h, followed by mixing for several days. The synthesized particles were collected by vacuum filtration, washed several times with deionized water, and then dried under vacuum overnight. The particle size of ELM-11 becomes smaller as the concentration of bpy and Cu(BF4)2 is higher. Therefore, we varied the concentrations with a fixed ratio to control the size range of the resulting particles ([bpy], [Cu(BF4)2]) = (0.8 M, 1.6 M), (1.0 M, 2.0 M), (1.2 M, 2.4 M), (1.4 M, 2.8 M), and (1.6 M, 3.2 M); the particles obtained under these conditions correspond to Fig. 2a–e, respectively.5.2 Characterization
XRD patterns were obtained using an UltimaIV/285/DX (Rigaku Corp., Japan) with Cu Kα radiation (40 kV and 20 mA) at a scan rate of 10° min−1 and step size of 0.01°. SEM images were obtained using an SU8220 field emission SEM (Hitachi High-Tech Corp., Japan). The mean particle size was calculated by measuring the length of at least 70 particles using the SEM images. CO2 adsorption isotherms were measured at 273 K using a BELSORP-mini (MicrotracBEL Corp., Japan), in which the equilibrium setting was pressure variation within 30 Pa for 600 s and the sample amount was approximately 50 mg. The samples were dehydrated and activated by degassing at 393 K for 10 h under vacuum below 10 Pa before adsorption measurements.5.3 Nanoscale simulations for the unit cell
Grand canonical MC simulations were conducted on 36 models with slightly different interlayer widths from h = 1.70σgg to h = 2.05σgg at various pressures (Fig. 1a), obtaining the amount adsorbed on the unit cell, nguest(h,P). By computing relative free energy of each structure without guest molecules and the grand potential of the guest molecules, ωos(h,P) was obtained. Details of the simulation are present elsewhere31 or in Section S9.†5.4 Mesoscale simulations for the particle model
We performed two types of mesoscale simulations using the particle model, in which periodic boundary conditions were imposed in all directions.The first was to obtain the adsorption isotherms, which resembles a standard simulation method for the Ising lattice model. The simulation procedures were as follows:
(1) Set a pressure and obtain the Δωopos(P) value from the nanoscale simulation.
(2) Choose one cell at random and convert its state into the other one.
(3) Accept the conversion with the probability defined by eqn (10).
(4) Perform Steps 2 and 3 M × 10, 000 times and calculate the ensemble average number of op cells, 〈m(P)〉, in which the first half of the trials are used for equilibration, and the sampling is conducted in the latter half.
(5) Repeat Steps 1–4 with increasing/decreasing pressure to obtain adsorption/desorption isotherms.
Except for the results shown in Fig. 4a, the adsorption and desorption isotherms were averaged over 10 separate simulations to obtain smooth profiles.
The second method mimicked Widom's test particle technique to calculate free energy profiles. The simulation procedures are outlined as follows:
(1) Set the number of op cells, m, in the particle model and the pressure to P = Peq, where Δωopos(Peq) = 0.
(2) Choose one of op cells at random and convert it into the cp state. Then, choose another cell and convert it into the op state, which corresponds to a movement trial.
(3) Accept the movement trial based on the probability defined by eqn (10):
(4) Perform Steps 2 and 3 1![[thin space (1/6-em)]](https://www.rsc.org/images/entities/char_2009.gif) 000
000![[thin space (1/6-em)]](https://www.rsc.org/images/entities/char_2009.gif) 000
000![[thin space (1/6-em)]](https://www.rsc.org/images/entities/char_2009.gif) 000 times.
000 times.
(5) Every 1000 MC steps after 5![[thin space (1/6-em)]](https://www.rsc.org/images/entities/char_2009.gif) 000
000![[thin space (1/6-em)]](https://www.rsc.org/images/entities/char_2009.gif) 000 MC steps during Step 4, calculate E+(rm′,P), which is the energy received by a cell when converting it into the op phase. This calculation is conducted sequentially for all cells, and the resultant values are averaged.
000 MC steps during Step 4, calculate E+(rm′,P), which is the energy received by a cell when converting it into the op phase. This calculation is conducted sequentially for all cells, and the resultant values are averaged.
(6) Repeat Steps 1–4 with increasing m to obtain free energy profiles according to eqn (12).
Data availability
The data supporting this article have been included as part of the ESI.†Author contributions
Homare Arima: conceptualization, formal analysis, investigation, writing – original draft, visualization Shotaro Hiraide: conceptualization, methodology, writing – review & editing, visualization, supervision Satoshi Watanabe: writing – review & editing, supervision.Conflicts of interest
The authors declare no conflict of interest.Acknowledgements
We are grateful to H. Nagano, K. Nishimoto, and K. Shota for their assistance with this study. This study was financially supported by a Grant-in-Aid for Scientific Research (B) (No. 23K23116 and 24K01235), JST, the establishment of university fellowships towards the creation of science technology innovation (No. JPMJFS2123), the Grant-in-Aid for JSPS Fellows (No. 23KJ1198), and the Hosokawa Powder Technology Foundation (Grant Number HPTF22501).References
- N. Höhne, M. d. Elzen, J. Rogelj, B. Metz, T. Fransen, T. Kuramochi, A. Olhoff, J. Alcamo, H. Winkler, S. Fu, M. Schaeffer, R. Schaeffer, G. P. Peters, S. Maxwell and N. Dubash, Nature, 2020, 579, 25–28 CrossRef PubMed.
- D. S. Sholl and R. P. Lively, Nature, 2016, 532, 435–437 CrossRef PubMed.
- J. Y. S. Lin, Science, 2016, 353, 6295 CrossRef PubMed.
- S. Horike, S. Shimomura and S. Kitagawa, Nat. Chem., 2009, 1, 695–704 CrossRef CAS PubMed.
- A. Schneemann, V. Bon, I. Schwedler, I. Senkovska, S. Kaskel and R. A. Fischer, Chem. Soc. Rev., 2014, 43, 6062 RSC.
- S. Krause, N. Hosono and S. Kitagawa, Angew. Chem., Int. Ed., 2020, 59, 15325–15341 CrossRef CAS PubMed.
- Y. Li, Y. Wang, W. Fan and D. Sun, Dalton Trans., 2022, 51, 4608 RSC.
- I. Senkovska, V. Bon, L. Abylgazina, M. Mendt, J. Berger, G. Kieslich, P. Petkov, J. L. Fiorio, J.-O. Joswig, T. Heine, L. Schaper, C. Bachetzky, R. Schmid, R. A. Fischer, A. Pöppl, E. Brunner and S. Kaskel, Angew. Chem., Int. Ed., 2023, 62, e202218076 CrossRef CAS PubMed.
- T. K. Maji, R. Matsuda and S. Kitagawa, Nat. Mater., 2007, 6, 142 CrossRef CAS PubMed.
- J. A. Mason, J. Oktawiec, M. K. Taylor, M. R. Hudson, J. Rodriguez, J. E. Bachman, M. I. Gonzalez, A. Cervellino, A. Guagliardi, C. M. Brown, P. L. Llewellyn, N. Masciocchi and J. R. Long, Nature, 2015, 527, 357 CrossRef CAS PubMed.
- S. Hiraide, H. Tanaka, N. Ishikawa and M. T. Miyahara, ACS Appl. Mater. Interfaces, 2017, 46, 41066–41077 CrossRef PubMed.
- S. Hiraide, Y. Sakanaka, S. Kajiro, S. Kawaguchi, M. T. Miyahara and H. Tanaka, Nat. Commun., 2020, 11, 3867 CrossRef CAS PubMed.
- J. Fujiki, H. Kajiro, Y. Takakura, T. Yajima and Y. Kawajiri, Chem. Eng. J., 2023, 460, 141781 CrossRef CAS.
- A. V. Neimark, P. I. Ravikovitch and A. Vishnyakov, Phys. Rev. E, 2000, 62, R1493–R1496 CrossRef CAS PubMed.
- A. Vishnyakov and A. V. Neimark, J. Phys. Chem. B, 2001, 105, 7009–7020 CrossRef CAS.
- R. Maity, M. Gholami, S. A. Peter, M. Schoukens, S. Tiriana, G. V. Baron and J. F. M. Denayer, Small, 2023, 19, 2302893 CrossRef CAS PubMed.
- T. Hiratsuka, H. Tanaka and M. T. Miyahara, ACS Nano, 2017, 11, 269–276 CrossRef CAS PubMed.
- S. Rahman, A. Arami-Niya, X. Yang, G. Xiao, G. K. Li and E. F. May, Commun. Chem., 2020, 3, 186 CrossRef CAS PubMed.
- Y. Sakata, S. Furukawa, M. Kondo, N. Horike, Y. Takashima, H. Uehara, N. Louvain, M. Meilikhov, T. Tsuruoka, S. Isoda, W. Kosaka, O. Sakata and S. Kitagawa, Science, 2013, 339, 193–196 CrossRef CAS PubMed.
- V. Bon, N. Busov, I. Senkovska, N. Bönisch, L. Abylganzia, A. Khadiev, D. Novikov and S. Kaskel, Chem. Commun., 2022, 58, 1492–1495 RSC.
- R. Bose, V. Bon, N. Bönisch, P. Selvam, N. S. Kaisare and S. Kaskel, Chem. Mater., 2023, 35, 7825–7838 CrossRef CAS.
- S. Ehrling, I. Senkovska, V. Bon, J. D. Evans, P. Petikov, Y. Krupskaya, V. Katev, T. Wulf, A. Krylov, A. Vtyurin, S. Krylova, S. Adichtchev, E. Slyusareva, M. S. Weiss, B. Büchner, T. Heine and S. Kaskel, Front. Mater., 2019, 7, 21459 CAS.
- S. Krause, F. S. Reuter, S. Ehrling, V. Bon, I. Senkovska, S. Kaskel and E. Brunner, Chem. Mater., 2020, 32, 4641–4650 CrossRef CAS PubMed.
- L. Abylganzia, I. Senkovska, R. Engemann, S. Ehrling, T. E. Gorelik, N. Kavoosi, U. Kaiser and S. Kaskel, Front. Chem., 2021, 9, 674566 CrossRef PubMed.
- L. Abylgazina, I. Senkovska, S. Ehrling, V. Bon, P. S. Pektov, J. D. Evans, S. Krylova, A. Krylov and S. Kaskel, CrystEngComm, 2021, 23, 538–549 RSC.
- M. Maliuta, I. Senkovska, R. Thümtmter, S. Ehrling, S. Becker, V. Romaka, J. D. Evans and S. Kaskel, Dalton Trans., 2023, 52, 2816 RSC.
- N. Klein, C. Herzog, M. Sabo, I. Senkovska, J. Getzscgmann, S. Paasch, M. R. Lohe, E. Brunner and S. Kaskel, Phys. Chem. Chem. Phys., 2010, 12, 11778–11784 RSC.
- F.-X. Coudert, M. Jeffroy, A. H. Fuchs, A. Boutin and C. Mellot-Draznieks, J. Am. Chem. Soc., 2008, 130, 14294–14302 CrossRef CAS PubMed.
- S. Watanabe, H. Sugiyama, H. Adachi, H. Tanaka and M. T. Minoru, J. Chem. Phys., 2009, 130, 164707 CrossRef PubMed.
- H. Sugiyama, S. Watanabe, H. Tanaka and M. T. Miyahara, Langmuir, 2012, 28, 5093–5100 CrossRef CAS PubMed.
- R. Numaguchi, H. Tanaka, S. Watanabe and M. T. Miyahara, J. Chem. Phys., 2013, 138, 054708 CrossRef PubMed.
- S. Hiraide, H. Arima, H. Tanaka and M. T. Miyahara, ACS Appl. Mater. Interfaces, 2021, 13, 30213–30223 CrossRef CAS PubMed.
- H. Arima, S. Hiraide, M. T. Miyahara and S. Watanabe, ACS Appl. Mater. Interfaces, 2023, 15, 36975–36987 CrossRef CAS PubMed.
- C. Triguero, F.-X. Coudert, A. Boutin, A. H. Fuchs and A. V. Neimark, J. Chem. Phys., 2012, 137, 184702 CrossRef PubMed.
- F.-X. Coudert, A. Boutin, A. H. Fuchs and A. V. Neimark, J. Phys. Chem. Lett., 2013, 4, 3198–3205 CrossRef CAS.
- S. M. J. Rogge, Faraday Discuss., 2021, 225, 271–285 RSC.
- S. Vandenhaute, S. M. J. Rogge and V. V. Speybroeck, Front. Chem., 2021, 9, 718920 CrossRef CAS PubMed.
- K. Mitsumoto and K. Takae, Proc. Natl. Acad. Sci. U. S. A., 2023, 120, 30 CrossRef PubMed.
- S. Hiraide, Y. Sakanaka, Y. Iida, H. Arima, M. T. Miyahara and S. Watanabe, Proc. Natl. Acad. Sci. U. S. A., 2023, 120, 31 CrossRef PubMed.
- L. Onsager, Phys. Rev., 1944, 65, 117 CrossRef CAS.
- B. Fultz, Phase Transition in Materials, Cambridge university press, 2nd edn, 2020, pp. 10–12 Search PubMed.
- D. Li and K. Kaneko, Chem. Phys. Lett., 2001, 335, 50–56 CrossRef CAS.
- A. Kondo, H. Noguchi, S. Ohnishi, H. Kajiro, A. Tohdoh, Y. Hattori, W.-C. Xu, H. Tanaka, H. Kanoh and K. Kaneko, Nano Lett., 2006, 6, 2581–2584 CrossRef CAS PubMed.
- B. Widom, J. Phys. Chem., 1982, 86, 869–872 CrossRef CAS.
- S. Watanabe, S. Hiraide, H. Kunimitsu, A. Fujiwara and M. T. Miyahara, Front. Mater., 2022, 9, 825592 CrossRef.
- X.-C. Huang, Y.-Y. Lin, J.-P. Zhang and X.-M. Chen, Angew. Chem., Int. Ed., 2006, 45, 1557–1559 CrossRef CAS PubMed.
- S. Watanabe, S. Ohsaki, T. Hanafusa, K. Takada, K. Mae and M. T. Miyahara, Chem. Eng. J., 2017, 313, 724–733 CrossRef CAS.
- S. Ehrling, H. Miura, I. Senkovska and S. Kaskel, Trends Chem., 2021, 3, 291–304 CrossRef CAS.
- D. D. Wagman, W. H. Evans, V. B. Parker, R. H. Schumm, I. Halow, S. M. Bailey, K. L. Churney and R. L. Nuttall, J. Phys. Chem. Ref. Data, 1982, 11, 2 Search PubMed.
- R. A. d. Anjos, J. R. Vianna, J. R. d. Sousa and J. A. Plascak, Phys. Rev. E, 2007, 76, 022103 CrossRef PubMed.
- D. P. Landau, Phys. Rev. B: Condens. Matter Mater. Phys., 1980, 21, 1285–1297 CrossRef CAS.
- S. Ohsaki, S. Watanabe, H. Tanaka and M. T. Miyahara, J. Phys. Chem. C, 2017, 121, 20366–20374 CrossRef CAS.
- R. Kotani, A. Kondo and K. Maeda, Chem. Commun., 2012, 48, 11316–11318 RSC.
- T. Suzuki, R. Kotani, A. Kondo and K. Maeda, J. Phys. Chem. C, 2016, 120, 21571–21579 CrossRef CAS.
- S. Hiraide, K. Nishimoto and S. Watanabe, J. Mater. Chem. A, 2024, 12, 18193 RSC.
Footnote |
| † Electronic supplementary information (ESI) available: Derivation of eqn (12). Particle size distribution for the ELM-11 samples. Explanation of particle-size dependence based on the primitive theory and its shortcomings. Downward-convex profile inducing a gradual increase in the amount adsorbed. Particle-thickness dependence. Simulated adsorption isotherms with various M#. Determination of the equilibrium transition pressure. Cooperative transition behavior under various conditions. Details of the nanoscale simulation. See DOI: https://doi.org/10.1039/d4ta04222k |
| This journal is © The Royal Society of Chemistry 2024 |

