A ratiometric fluorescent probe for imaging the fluctuation of HOBr during endoplasmic reticulum stress†
Bingpeng
Guo
 a,
Mengyu
Li
a,
Guiwen
Hao
a,
Liangchen
Wei
c,
Honghan
Sa
a,
Jianbin
Chen
a,
Mengyu
Li
a,
Guiwen
Hao
a,
Liangchen
Wei
c,
Honghan
Sa
a,
Jianbin
Chen
 *a,
Wei
Shu
 *c and
Changxiang
Shao
 *b
*b
aSchool of Chemistry and Chemical Engineering, Qilu University of Technology (Shandong Academy of Sciences), Jinan, 250103, China. E-mail: jchen@qlu.edu.cn
bSchool of Chemistry and Pharmaceutical Engineering, Medical Science and Technology Innovation Center, Shandong First Medical University & Shandong Academy of Medical Sciences, Jinan, 250117, China. E-mail: cxshao@sdfmu.edu.cn
cSchool of Life Sciences and Medicine, Shandong University of Technology, Zibo, 255000, China. E-mail: jdshuwei@163.com
First published on 29th December 2023
Abstract
Endoplasmic reticulum (ER) stress is closely associated with cell apoptosis, autophagy, DNA damage, metabolism, and migration. When ER stress occurs, a large number of reactive oxygen species, including hypobromous acid (HOBr), are generated. The degree of ER stress can be understood by accurately detecting the HOBr concentration in the ER. Unfortunately, no ER-targetable probes for detecting HOBr have been reported to date. To solve this problem, we developed a naphthalimide-based fluorescent probe (ER-NABr) for imaging HOBr in the ER. Upon reaction with HOBr, a red shift in the fluorescence spectrum occurs due to the difference in the molecular conjugation between the original ER-NABr and the reaction product. ER-NABr showed a fast response (within 30 s) and high selectivity towards HOBr, with a ratiometric quantitative response (5–40 μM) and high sensitivity (138 nM). With its excellent biocompatibility and remarkable ER-targetable ability, ER-NABr was successfully utilized to ratiometrically image intracellular HOBr, particularly during ER stress, which is beneficial for revealing the role of HOBr in ER-associated diseases.
Introduction
Hypobromous acid (HOBr), one kind of reactive oxygen species (ROS), is generated from the reaction of Br− and H2O2 catalyzed by myeloperoxidase or eosinophil peroxidase in vivo.1 It functions as an effective potent antibacterial agent and plays a crucial role in the neutrophil host defense system.2,3 However, excessively generated HOBr can result in tissue inflammation, resulting in diseases such as inflammation, cardiovascular diseases, and cancers by reacting with lipids, nucleic acids, and proteins.4–8 Hence, monitoring the fluctuation of HOBr in living cells can reveal their physiological and pathological functions. Usually, fluorescent probes are used as powerful detection tools due to their outstanding sensitivity, low cytotoxicity, and super spatial and temporal resolution.9–11 Though HOBr shares similar properties with HOCl, its concentration in vivo is significantly lower than that of HOCl.12,13 As a result, there are limited fluorescent probes available for detecting HOBr compared to those for HOCl.14–25 Despite the development of several specific probes for mitochondria and lysosomes to investigate the role of HOBr in subcellular organelles,26–31 there is no reported endoplasmic reticulum (ER)-targeted probe for HOBr, to the best of our knowledge (Table S1, ESI†).The ER is the largest organelle and is present in most eukaryotic cells.32 Its primary function is associated with the synthesis, folding, modification, and transport of proteins.33 Additionally, the ER acts as the main store of intracellular Ca2+ and plays a crucial part in maintaining cellular homeostasis.34 The dysfunction of the ER, caused by abnormal fluctuations of Ca2+, pH, and oxidative stress, can induce the unfolded protein response (UPR), commonly known as ER stress.35,36 This stress can either facilitate the recovery of ER proteostasis and cell survival or trigger programmed cell death.37,38 Increasing evidence suggests that ER stress-induced cell death is closely linked to neurodegenerative diseases, vascular diseases, and cancer.39–41 Consequently, the development of fluorescent probes to monitor the fluctuation of HOBr during ER stress holds significant value in understanding ER stress-induced programmed cell death and associated pathologies.
Herein, an ER-targetable fluorescent probe (ER-NABr) for ratiometric imaging of HOBr in living cells was well designed and synthesized. The probe was based on the cyclization reaction of amino and thioether mediated by HOBr. To achieve ER targeting, p-toluenesulfonamide is introduced as the ER-targeting group of the probe (ER-NABr).42 The resulting ER-NABr emitted yellow fluorescence at 560 nm. Upon interaction with HOBr, the product showed pink fluorescence at 610 nm, which can be attributed to the larger π-conjugation system compared to ER-NABr (Scheme 1). ER-NABr has been proven to exhibit ratiometric detection for HOBr with an impressive response time (less than 30 s), high sensitivity (LOD = 138 nM), excellent selectivity, and appreciable biocompatibility. Based on the above remarkable characteristics, ER-NABr is successfully applied to detect exogenous and endogenous HOBr in HeLa cells, particularly imaging the fluctuation of HOBr during ER stress.
Results and discussion
The response of ER-NABr to HOBr
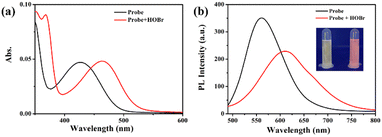
The characteristic spectra of ER-NABr show the difference before and after reaction with HOBr in Fig. 1. ER-NABr displays a maximum absorption peak at 425 nm and emits yellow fluorescence with a major emission peak at 550 nm. Upon addition of HOBr (50 μM) to the solution, the maximum absorption peak undergoes a red shift to 470 nm, accompanied by the appearance of an isoabsorptive point at 450 nm. Additionally, the maximum emission band is red-shifted from 550 nm to 610 nm, resulting in bright pink fluorescence. These results indicate that the reaction product of ER-NABr and HOBr possesses a larger π-conjugated system, contributing to the simultaneous red shift observed in both the maximum absorption and maximum emission peaks. To understand the sensing mechanism, the reaction product of ER-NABr with HOBr was analyzed using ESI-HRMS analysis. The mass spectrum peak of the product corresponds perfectly to the ER-NABr-HOBr, with the calculated mass of m/z 530.11981 [M + H]+ and m/z 552.10175 [M + Na]+ (Fig. S1, ESI†). In short, the reaction between ER-NABr and HOBr involves the nucleophilic substitution and cyclization reactions (Scheme 1), which is consistent with previous reports.18,22As exhibited in Fig. S2 (ESI†), the addition of HOBr (50 μM) to the test solution results in the ratio of I610/I560 reaching a plateau within 30 s, which demonstrates the quick reaction between ER-NABr and HOBr. Furthermore, the pH effect on the reaction of ER-NABr towards HOBr was explored. When the probe is alone, the ratio of I610/I560 remains relatively unchanged within the pH range from 5.5 to 9.0 (Fig. S3, ESI†), indicating the high stability of ER-NABr under physiological conditions. However, upon addition of HOBr (50 μM) to the test solution at different pH (5.5–9.0), the ratio of I610/I560 exhibits a significant response to HOBr, particularly at pH = 7.4. These findings collectively indicate that ER-NABr has the capability to detect HOBr rapidly under physiological conditions.
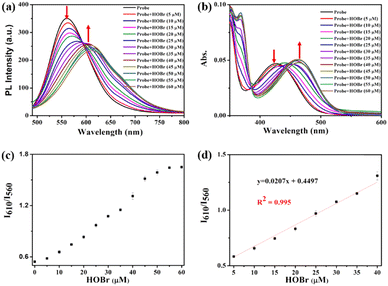
Then, the absorption and fluorescence spectra of ER-NABr towards increasing concentrations of HOBr were tested (Fig. 2). It is observed that with the increase of the HOBr concentration from 0 to 60 μM, the fluorescence peak of ER-NABr at 560 nm gradually decreases, while the fluorescence peak at 610 nm increases (Fig. 3a). Additionally, as the concentration of HOBr increases, the maximum absorption peak at 425 nm gradually decreases, and a new absorption band centered at 470 nm emerges (Fig. 3b). Importantly, there is a significant linear relationship between the ratio of I610/I560 and HOBr concentration in the range of 5–40 μM, with a linear equation of y = 0.0207 [HOBr] (μM) + 0.4497, R2 = 0.995. The limit of detection (LOD) is determined to be 138 nM (Fig. 3d), indicating the high sensitivity of ER-NABr to HOBr. Similarly, the ratio of I610/I560 or A470/A425 increases with the concentration of HOBr, reaching a plateau at 50 μM (Fig. 3c and Fig. S4a, ESI†). The ratio of A470/A425 demonstrates a good linear relationship with the concentration of HOBr (5–40 μM) with a linear equation of y = 0.031 [HOBr] (μM) + 0.2571, R2 = 0.990 (Fig. S4b, ESI†). Therefore, ER-NABr can quantitatively detect HOBr with high sensitivity.
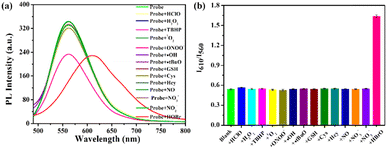
To confirm the selectivity of ER-NABr towards HOBr, the fluorescence responses between ER-NABr and other ROSs, RNSs, and amino acids were tested. Apparently, only HOBr causes a red-shift emission from 560 nm to 610 nm in the fluorescence spectrum of ER-NABr in Fig. 3a. Notably, the fluorescence of ER-NABr at 560 nm is weakened in the presence of peroxynitrite (ONOO−). This can be attributed to the oxidation of the thioether bond of ER-NABr to sulfoxide by ONOO− (Scheme S1, ESI†), which weakens its electron giving ability and thus reduces its fluorescence. Nevertheless, there is almost no change in the ratio (I610/I560) after the addition of ONOO− (Fig. 3b). This result highlights the superiority of the ratiometric fluorescent probe in preventing interferences through self-calibration. Consequently, ER-NABr hardly responds to other active substances even at a much higher concentration, confirming the high specificity of ER-NABr towards HOBr.
Cell imaging experiments and cytotoxicity
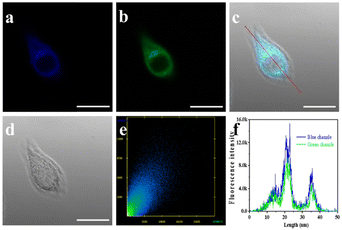
The cytotoxicity of ER-NABr was assessed using HeLa cells with different concentrations of ER-NABr for 24 hours before applying it to cell experiments. Even at a high concentration of 50 μM, ER-NABr exhibits low cytotoxicity accompanied by a high cell survival rate (>88%) (Fig. S5, ESI†), demonstrating good biocompatibility and laying the foundation for subsequent cell imaging.Subsequently, the ER-targeting ability of ER-NABr was verified by comparison with commercial ER-tracker Blue. Cells stained by ER-tracker Blue and ER-NABr show blue and green fluorescence, respectively. The blue channel image (Fig. 4a) and the green channel image (Fig. 4b) are overlapped to get the combined light blue image (Fig. 4c), which displays a close match. In addition, the fluorescence intensities (Fig. 4e) of ER-NABr and ER-Tracker Blue exhibit high correlation and the Pearson's colocalization coefficient is 0.90. Moreover, the intensity profiles of the red line across the HeLa cells are also tightly synchronized (Fig. 4f). All these results indicate that ER-NABr can effectively target the ER as expected.
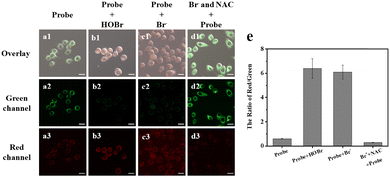
Encouraged by the excellent ER-targeting ability, good biocompatibility and outstanding analytical performance in vitro of ER-NABr, we imaged the exogenous HOBr in HeLa cells firstly. As shown in Fig. 5a, the HeLa cells in the control group, stained only with the ER-NABr (10 μM), exhibit bright green fluorescence and weak red fluorescence. In sharp contrast, after the addition of exogenous HOBr (50 μM) or Br− (100 μM), the green fluorescence is weakened, while the red fluorescence is enhanced (Fig. 5b and c). Subsequently, HeLa cells were pretreated with NAC (N-acetylcysteine, an effective ROS scavenger) and Br− before being stained with ER-NABr. An obvious contrast with enhanced green fluorescence and reduced red fluorescence occurs (Fig. 5d). The relative contrasts of the red channel/green channel under different conditions can be clearly seen in Fig. 5e. These results provide evidence that ER-NABr can detect exogenous HOBr in the ER through ratiometric imaging.
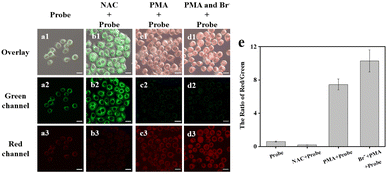
To image endogenous HOBr, the HeLa cells were pretreated with NAC. Compared with the control group (Fig. 6a), the green fluorescence was enhanced and the red fluorescence was weakened due to the effective NAC removal of ROSs (Fig. 6b). In contrast, to induce more HOBr, the HeLa cells were pretreated with PMA or PMA + Br− before being stained by ER-NABr. As a result, the green fluorescence became invisible, while the red fluorescence increased in Fig. 6c and d. The relative change of the red channel/green channel (Fig. 6e) clearly demonstrate that the probe can effectively image endogenous HOBr.
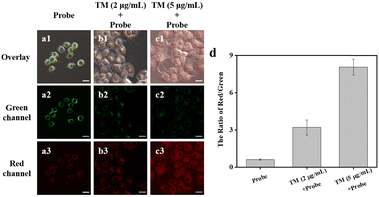
Finally, we applied ER-NABr to monitor the HOBr fluctuation during ER stress. The HeLa cells were pretreated with TM (tunicamycin) to induce ER stress.43 As the concentration of TM increased, the fluorescence of the red channel enhanced gradually, while that of the green channel decreased (Fig. 7a–c). As a result, the ratio of red channel to green channel is gradually enhanced (Fig. 7d). This is because when HeLa cells are subjected to ER stress triggered by TM, the intracellular HOBr concentration increases. ER-NABr can detect the fluctuation of HOBr in real time through the change of the fluorescence intensity ratio, and then reflect the state of ER stress.
Conclusions
In summary, an ER-targetable fluorescent probe (ER-NABr) has been developed for ratiometric response to HOBr for the first time. ER-NABr demonstrates excellent analytical performance for HOBr in vitro, including rapid response (less than 30 s), ratiometric response in the fluorescence and absorption spectra, high sensitivity (LOD = 138 nM), and superb selectivity. Additionally, ER-NABr exhibits low cytotoxicity and remarkable ER-targeting ability. With the assistance of ER-NABr, the exogenous and endogenous HOBr can be ratiometrically imaged, with a particular focus on monitoring HOBr fluctuations during ER stress. This achievement presents a promising analytical tool for the treatment and evaluation of related diseases during ER stress.Experimental
Materials and instruments
The chemicals used in this work were obtained from commercial suppliers and used without additional purification. Flash column chromatography was carried out using silica gel (200–300 mesh, QingdaoHaiyang Chemical Co.). 1H NMR spectra were recorded using a Bruker Avance III (400 MHz) with chemical shifts reported as ppm (in DMSO-d6, TMS as internal standard). Mass spectra were recorded using a BrukerApex IV FTMS. UV-vis spectra were measured using a Purkinje TU-1901 spectrometer. Photoluminescence (PL) spectra were recorded using a F97Pro fluorescence spectrophotometer. pH measurements were carried out with a pH acidometer (Yueping PHS-25). Fluorescence imaging was observed using a Zeiss LSM900 confocal fluorescence microscope.Synthetic procedures
The synthesis route of ER-NABr is shown in Scheme S2 (ESI†).Synthesis of compound 2
Compound 1 (500 mg, 1.71 mmol) and N-(2-aminoethyl)-4-methylbenzenesulfonamide (440 mg, 2.06 mmol) were added to 30 mL of absolute ethanol. The mixture was refluxed overnight. After cooling to room temperature, the resulting solid precipitate was filtered under negative pressure and washed with cold ethanol. The precipitate was then placed in a vacuum drying oven at 60 °C for 6 h, yielding a golden yellow solid (650 mg, 77.8%). 1H NMR (400 MHz, DMSO-d6): δ (ppm): 8.19 (d, J = 8.48 Hz, 1H), 8.10 (d, J = 7.24 Hz, 1H), 8.05 (s, 1H), 7.75 (t, J = 7.28 Hz, 2H), 7.58 (d, J = 8.16 Hz, 2H), 7.21 (d, J = 8.28 Hz, 2H), 6.31 (s, 2H), 4.07 (t, J = 6.48 Hz, 2H), 3.08 (q, J = 6.48 Hz, 2H), 2.55 (s, 3H).Synthesis of the probe ER-NABr
Compound 2 (200 mg, 0.41 mmol), 2-methylthiophenylboronic acid (83 mg, 0.49 mmol), Pd(dppf)Cl2 (30 mg, 8 mol%) and potassium carbonate (567 mg, 4.1 mmol) were mixed in H2O/THF (10.0 mL, 1![[thin space (1/6-em)]](https://www.rsc.org/images/entities/char_2009.gif) :
:![[thin space (1/6-em)]](https://www.rsc.org/images/entities/char_2009.gif) 2, v/v). The mixture was then refluxed under nitrogen for 8 hours. After refluxing, the mixture was cooled to room temperature and 50 mL of water was added. The resulting solution was extracted with CH2Cl2. The DCM extract was dried using anhydrous Na2SO4, and the solvent was removed under reduced pressure. The obtained residue was purified by chromatography on a silica gel column (CH2Cl2: CH3OH = 50
2, v/v). The mixture was then refluxed under nitrogen for 8 hours. After refluxing, the mixture was cooled to room temperature and 50 mL of water was added. The resulting solution was extracted with CH2Cl2. The DCM extract was dried using anhydrous Na2SO4, and the solvent was removed under reduced pressure. The obtained residue was purified by chromatography on a silica gel column (CH2Cl2: CH3OH = 50![[thin space (1/6-em)]](https://www.rsc.org/images/entities/char_2009.gif) :
:![[thin space (1/6-em)]](https://www.rsc.org/images/entities/char_2009.gif) 1) to yield the pure product as a pale-yellow solid (91 mg, 40.2%). 1H NMR (400 MHz, DMSO-d6): δ (ppm): 8.13 (s, 1H), 8.06 (d, J = 7.20 Hz, 1H), 7.76 (t, J = 6.32 Hz, 1H), 7.61 (d, J = 8.16 Hz, 2H), 7.56–7.47 (m, 3H), 7.36 (d, J = 7.28 Hz, 2H), 7.30 (s, 1H), 7.28 (s, 1H), 7.25 (d, J = 8.48 Hz, 1H). 7.14 (d, J = 7.44 Hz, 1H), 5.31 (s, 2H), 4.11 (t, J = 6.48 Hz, 2H), 3.07 (q, J = 6.4 Hz, 2H), 2.34 (s, 3H), 2.31 (s, 3H). ESI-HRMS calcd for C28H26N3O4S2 [M + H]+, 532.1359; found, 532.1328; C28H25N3O4S2Na [M + Na]+, 554.1179; found, 554.1160.
1) to yield the pure product as a pale-yellow solid (91 mg, 40.2%). 1H NMR (400 MHz, DMSO-d6): δ (ppm): 8.13 (s, 1H), 8.06 (d, J = 7.20 Hz, 1H), 7.76 (t, J = 6.32 Hz, 1H), 7.61 (d, J = 8.16 Hz, 2H), 7.56–7.47 (m, 3H), 7.36 (d, J = 7.28 Hz, 2H), 7.30 (s, 1H), 7.28 (s, 1H), 7.25 (d, J = 8.48 Hz, 1H). 7.14 (d, J = 7.44 Hz, 1H), 5.31 (s, 2H), 4.11 (t, J = 6.48 Hz, 2H), 3.07 (q, J = 6.4 Hz, 2H), 2.34 (s, 3H), 2.31 (s, 3H). ESI-HRMS calcd for C28H26N3O4S2 [M + H]+, 532.1359; found, 532.1328; C28H25N3O4S2Na [M + Na]+, 554.1179; found, 554.1160.
General procedure for analysis
Parent stock solution of ER-NABr (2.0 mM) was prepared in DMSO. To prepare the test solution, 50 μL of the parent stock solution was diluted to 10 mL with a mixture of CH3CN and ultrapure water (2![[thin space (1/6-em)]](https://www.rsc.org/images/entities/char_2009.gif) :
:![[thin space (1/6-em)]](https://www.rsc.org/images/entities/char_2009.gif) 3, v/v, pH = 7.4, and 10 mM PBS). All spectra were recorded in quartz cuvettes (path length = 10 mm). Each spectrum was acquired 1 min after HOBr-addition at room temperature, λex = 470 nm.
3, v/v, pH = 7.4, and 10 mM PBS). All spectra were recorded in quartz cuvettes (path length = 10 mm). Each spectrum was acquired 1 min after HOBr-addition at room temperature, λex = 470 nm.
HOBr and other analytes were prepared according to the previous literature.23
Determination of the detection limit
The detection limit (3σ/k) was calculated by fluorescence titration, where σ is the standard deviation of blank measurements (n = 10), k is the slope between I610/I560vs. HOBr concentration.Cell culture and imaging
HeLa cells were grown on glass-bottom culture dishes using DMEM containing 10% fetal bovine serum (v/v) and 50 μg mL−1 penicillin–streptomycin in a humidified 37 °C, 5% CO2 incubator. Before use, the adherent cells were washed three times with FBS-free DMEM. The HeLa cells were pretreated with ER-NABr (10 μM) in culture media for 30 min and then washed with PBS twice. Fluorescence imaging of HeLa cells was observed under a Zeiss LSM 900 confocal fluorescence microscope, and the excitation wavelength was 488 nm.Cytotoxicity assay
The cytotoxicity of ER-NABr on HeLa cells was assessed using the standard MTT assay, as previously described.9Author contributions
Bingpeng Guo: methodology, investigation, visualization and writing – original draft. Mengyu Li: investigation, data curation, and visualization. Guiwen Hao: investigation, data curation, and visualization. Liangchen Wei: data curation, methodology, and software. Honghan Sa: investigation, data curation, and visualization. Jianbin Chen: conceptualization, writing – review and editing, resources and funding acquisition. Wei Shu: conceptualization, writing – review and editing, resources and funding acquisition. Changxiang Shao: conceptualization, writing – review and editing, resources and funding acquisition.Conflicts of interest
There are no conflicts of interest to declare.Acknowledgements
We gratefully acknowledge financial support from the National Natural Science Foundation of China (22171154), Young Taishan Scholar Program of Shandong Province (tsqn202211206), the Natural Science Foundation of Shandong Province (No. ZR2022QB215, ZR2022QB227 and ZR2022QB175) and Jinan Science & Technology Bureau (2021GXRC080). The project was also Supported by the Cultivating Project of Qilu University of Technology (Shandong Academy of Sciences) (2022PY002, 2023PX043, and 2023RCKY102).References
- B. Halliwell and M. Whiteman, Br. J. Pharmacol., 2010, 142, 231–255 CrossRef PubMed.
- C. Nathan, Nat. Rev. Immunol., 2006, 6, 173–182 CrossRef CAS PubMed.
- O. Skaff, D. I. Pattison and M. J. Davies, Chem. Res. Toxicol., 2007, 20, 1980–1988 Search PubMed.
- C. L. Hawkins and M. J. Davies, Chem. Res. Toxicol., 2005, 18, 1669–1677 Search PubMed.
- A. C. Carr, C. C. Winterbourn and J. J. M. V. D. Berg, Arch. Biochem. Biophys., 1996, 327, 227–233 CrossRef CAS PubMed.
- M. C. Vissers, A. C. Carr and A. L. Chapman, Biochem. J., 1998, 330, 131–138 CrossRef CAS PubMed.
- S. Sugiyama, Y. Okada, G. K. Sukhova, R. Virmani, J. W. Heinecke and P. Libby, Am. J. Pathol., 2001, 158, 879–891 CrossRef CAS PubMed.
- C. Gorrini, I. S. Harris and T. W. Mak, Nat. Rev. Drug Discovery, 2013, 12, 931–947 CrossRef CAS PubMed.
- B. Guo, W. Shu, W. Liu, H. Wang, S. Xing, J. Chen and X. Zhang, Sens. Actuators, B, 2021, 344, 130206 CrossRef CAS.
- B. Zheng, Y. Tian, S. Liu, J. Yang, F. Wu and H. Xiong, Anal. Chem., 2023, 95, 12054–12061 CrossRef CAS PubMed.
- C. Liu, X. Wang, H. Zhu, K. Wang, M. Yu, Y. Zhang, M. Su, X. Rong, W. Sheng and B. Zhu, Anal. Chem., 2023, 95, 11732–11740 CrossRef CAS PubMed.
- D. I. Pattison and M. J. Davies, Biochemistry, 2004, 43, 4799–4809 CrossRef CAS PubMed.
- P. G. Furtmüller, U. Burner and C. Obinger, Biochemistry, 1998, 37, 17923–17930 CrossRef PubMed.
- R. Zhang, B. Song and J. Yuan, TrAC, Trends Anal. Chem., 2018, 99, 1–33 CrossRef CAS.
- M. Ren, K. Zhou, L. He and W. Lin, J. Mater. Chem. B, 2018, 6, 1716–1733 RSC.
- D. Wu, L. Chen, Q. Xu, X. Chen and J. Yoon, Acc. Chem. Res., 2019, 52, 2158–2168 CrossRef CAS PubMed.
- Y. Fang and W. Dehaen, Molecules, 2021, 26, 363 CrossRef CAS PubMed.
- K. Xu, D. Luan, X. Wang, B. Hu, X. Liu, F. Kong and B. Tang, Angew. Chem., Int. Ed., 2016, 55, 12751–12754 CrossRef CAS PubMed.
- F. Yu, P. Song, P. Li, B. Wang and K. Han, Chem. Commun., 2012, 48, 7735–7737 RSC.
- J. Zhang, S. Liu, C. Liu, Y. Hu, T. Peng and Y. He, ChemistrySelect, 2022, 7, e202203278 CrossRef CAS.
- J. Zhang, Y. Xie, J. Ma, K. Liu, Y. Ding, Y. Li, X. Jiao, X. Xie, X. Wang and B. Tang, Chem. Commun., 2023, 59, 1018–1021 RSC.
- P. Jia, D. Liu, Z. Zhuang, L. Qu and B. Zhu, Sens. Actuators, B, 2020, 320, 128583 CrossRef CAS.
- P. Jia, Z. Zhuang, D. Liu, Y. Chen, B. Tian, C. Liu, Z. Li, H. Zhu, Y. Yu and X. Zhang, Sens. Actuators, B, 2020, 305, 127460 CrossRef CAS.
- Z. Xu, Y. Zhang, S. Sun, W. Min, A. Peng, L. Qiu and C. Liu, Dyes Pigm., 2023, 217, 111381 CrossRef CAS.
- L. Wu, Y. Shi, H. Yu, J. Zhang and X. F. Yang, Sens. Actuators, B, 2021, 337, 129790 CrossRef CAS.
- X. Liu, A. Zheng, D. Luan, X. Wang, F. Kong, L. Tong, K. Xu and B. Tang, Anal. Chem., 2017, 89, 1787–1792 CrossRef CAS PubMed.
- W. Qu, K. Li, D. Han, X. Zhong, C. Chen, X. Liang and H. Liu, Sens. Actuators, B, 2019, 297, 126826 CrossRef CAS.
- C. Ma, M. Ma, Y. Zhang, X. Zhu, L. Zhou, R. Fang, X. Liu and H. Zhang, Spectrochim. Acta, Part A, 2019, 212, 48–54 CrossRef CAS PubMed.
- H. Zhu, P. Jia, X. Wang, Y. Tian, C. Liu, X. Li, K. Wang, P. Li, B. Zhu and B. Tang, Anal. Chem., 2022, 94, 11783–11790 CrossRef CAS PubMed.
- Y. Wang, Y. Zhang, L. Yang, H. Wu and N. Finney, Analyst, 2021, 146, 2484–2489 RSC.
- H. Huang and T. Yang, Chem. Commun., 2018, 54, 12198–12201 RSC.
- O. Baumann and B. Walz, Int. Rev. Cytol., 2001, 205, 149–214 CAS.
- S. R. Pfeffer and J. E. Rothman, Ann. Rev. Biochem., 1987, 56, 829–849 CrossRef CAS PubMed.
- J. Meldolesi and T. Pozzan, Trends Biochem. Sci., 1998, 23, 10–14 CrossRef CAS PubMed.
- A. E. Frakes and A. Dillin, Mol. Cell, 2017, 66, 761–771 CrossRef CAS PubMed.
- A. Arunagiri, L. Haataja, A. Pottekat, F. Pamenan and P. Arvan, eLife, 2019, 8, e44532 CrossRef CAS PubMed.
- I. Tabas and D. Ron, Nat. Cell Biol., 2011, 13, 184–190 CrossRef CAS PubMed.
- K. You, L. Wang, C. H. Chou, K. Liu and R. J. Xavier, Science, 2021, 371, eabb6896 CrossRef CAS PubMed.
- R. V. Rao and D. E. Bredesen, Curr. Opin. Cell Biol., 2004, 16, 653–662 CrossRef CAS PubMed.
- T. Minamino, I. Komuro and M. Kitakaze, Circ. Res., 2010, 107, 1071–1082 CrossRef CAS PubMed.
- I. Kim, W. Xu and J. C. Reed, Nat. Rev. Drug Discovery, 2008, 7, 1013–1030 CrossRef CAS PubMed.
- S. J. Li, D. Y. Zhou, Y. Li, H. W. Liu, P. Wu, J. Ou-Yang, W. L. Jiang and C. Y. Li, ACS Sens., 2018, 3, 2311–2319 CrossRef CAS PubMed.
- C. Gao, Y. Tian, R. B. Zhang, J. Jing and X. Zhang, Anal. Chem., 2017, 89, 12945–12950 CrossRef CAS PubMed.
Footnote |
| † Electronic supplementary information (ESI) available: Additional spectral data. See DOI: https://doi.org/10.1039/d3tb02679e |
| This journal is © The Royal Society of Chemistry 2024 |


