 Open Access Article
Creative Commons Attribution 3.0 Unported Licence
Hybrid PNA-peptide hydrogels as injectable CEST-MRI agents†
Elisabetta
Rosa‡
a,
Enza
Di Gregorio‡
 b,
Giuseppe
Ferrauto
 b,
Carlo
Diaferia
 a,
Enrico
Gallo
c,
Enzo
Terreno
 *b and
Antonella
Accardo
 *a
*a
aDepartment of Pharmacy and Interuniversity Research Centre on Bioactive Peptides (CIRPeB) “Carlo Pedone”, University of Naples “Federico II”, Via D. Montesano 49, Naples 80131, Italy. E-mail: antonella.accardo@unina.it
bMolecular and Preclinical Imaging Center, Department of Molecular Biotechnology and Health Sciences, University of Turin, Via Nizza 52, Turin, Italy. E-mail: enzo.terreno@unito.it
cIRCCS Synlab SDN, Via Gianturco 113, Naples, 80143, Italy
First published on 29th May 2024
Abstract
The self-assembly of peptides and peptide analogues may be exploited to develop platforms for different biomedical applications, among which CEST-MRI (chemical exchange saturation transfer magnetic resonance imaging) represents one of the most attractive techniques to be explored as a novel metal-free contrast approach in imaging acquisitions. A lysine-containing peptide sequence (LIVAGK-NH2, named K2) was thus modified by insertion, at the N-terminus, of a peptide nucleic acid (PNA) base, leading to a primary amine suitable for the signal generation. a-K2, c-K2, g-K2 and t-K2 peptides were synthesized and characterized. The c-K2 sequence displayed gelling properties and the Watson and Crick pairing, arising from its combination with g-K2, allowed a significant increase in the mechanical responsivity of the hydrogel. These matrices were able to generate a CEST signal around 2.5 ppm from water and, after assessing their cytocompatibility on GL261 (murine glioma), TS/a (murine breast carcinoma), and 3T3-NIH (murine fibroblasts) cell lines, their capability to work as implants for in vivo detection, was proved by intratumor injection in Balb/c mice inoculated with TS/a murine breast cancer cells.
1. Introduction
Peptide sequences have recently attracted attention as suitable building blocks for the development of innovative supramolecular materials for use in different biomedical areas.1–4 Some advantages related to the use of peptides with respect to polymers are their high biocompatibility, degradability, and low cost.5 Moreover, the primary sequence of peptides can be easily modified ad-hoc to modulate the structural and the functional properties of the resulting material. In this context, many different examples of peptide nanostructures (nanofibers,6,7 nanowires,8 nanotubes9,10 and nanospheres11) and soft materials (hydrogels12–14 and hydrogel nanoparticles15,16) have been proposed as delivery vehicles of therapeutics and/or diagnostic agents. The delivery of the active pharmaceutical ingredient (API) can be achieved according to different strategies, in which the API is covalently bound to the nanostructure or, as an alternative, physically encapsulated inside the nanostructure. According to this latter strategy, we recently proposed peptide-based hydrogels (HGs) as supramolecular contrast agents (CAs) in magnetic resonance imaging (MRI) applications.17,18 These HGs were generated by the self-assembly of cationic hexapeptides (K1 = ILVAGK, K2 = LIVAGK or K3 = AIVAGK) derivatized at their N-terminus with the fluorenyl- (Fmoc-) or the acetyl (Ac-) group. By starting from these macroscopic HGs, we also prepared their submicronized version, named nanogels (NGs) that can be used as injectable nanocarriers, alternative to liposomes and polymeric micelles, for increasing the CA concentration in the target site.17,18 Hydrogels of Ac-K and Fmoc-K peptides were demonstrated to be able to encapsulate two different types of MRI contrast agents: (i) gadolinium complexes ([Gd(BOPTA)]2−), [Gd(DTPA)]2−, and ([Gd(AAZTA)]−) belonging to the class of T1-MRI CAs17 and (ii) iopamidol, a clinically approved CT agent also acting as a chemical exchange saturation transfer (CEST)-MRI probe.18–20 CEST-MRI represents a versatile technique for generating MRI contrast, alternative to the classical T1 and/or T2 relaxation mechanism. In particular, it is very efficient for the monitoring of tissue pH and the detection of endogenous mobile proteins.21 The basis of the CEST approach is the use of molecules with exchangeable spins as tools responsible for signal generation. By the application of a selective radiofrequency pulse, the spins are saturated, and, thanks to the proton exchange, the saturation is transferred to the bulk water, resulting in the saturation of a significant portion of the water signal and, consequently, generation of contrast in MR images.Depending on their magnetic properties, CEST agents can be classified as diamagnetic or paramagnetic.22 Focusing on diamagnetic (DIACEST) agents, the signal relies upon exchangeable protons belonging to amidic (NH), aminic (NH2) or hydroxylic (OH) groups, which generally give rise to signals falling within 5 ppm of water.23 However, more recently, novel DIACEST systems with more shifted resonances have been reported. These agents are based on salicylic and anthranilic acid moieties, where the presence of intramolecular hydrogen bonding extends the chemical shift of the exchangeable protons.24–27
For this reason, the CEST contrast may be generated by both endogenous (glycogen, proteins, glucosaminoglycans) or synthetic molecules (iopamidol, anthranilic acid analogues, polypeptides).28–30 It is worth noting that this method appears to be less invasive than the classical gadolinium-enhanced MRI detection since it does not require the administration of exogenous metal-containing CAs.
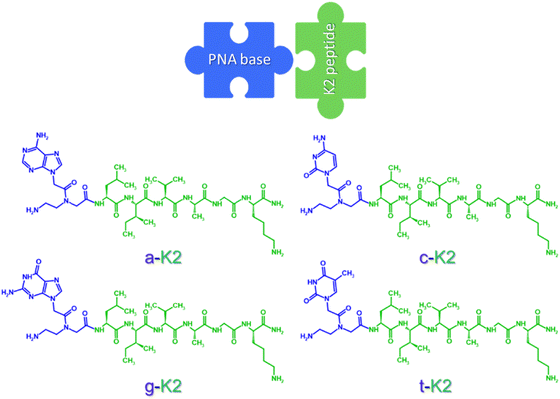
In our previous study, Ac-K1 and Ac-K2 hydrogels, embedding the iodinated molecule iopamidol, were formulated and tested both in vitro and in vivo. Despite the presence of a primary amine introduced by the lysine residue, the sequences used for the scaffold generation did not generate any CEST signal themselves. With the aim to preserve the aggregation capability driven by the primary structure of the peptides (five aliphatic amino acids followed by a lysine, with both the N- and the C-terminals capped with acetyl and an amidic group, respectively) and the prospect to introduce moieties that would also make a peptide based hydrogel CEST responsive itself, peptide nucleic acid (PNA) bases were used to modify one of the previously described building blocks (K2, arbitrarily chosen). These PNA bases, indeed, can be easily linked to the peptide backbone during the solid phase peptide synthesis (SPPS) through conventional coupling and carry aminic groups requested for signal generation. Therefore, a series of PNA-based blocks, a-K2, c-K2, g-K2 and t-K2 (Fig. 1, where the codes a, c, g and t stand for adenine, cytosine, guanine and thymine, respectively) were synthesized and their capability to aggregate into supramolecular hydrogels was tested under physiological conditions. Moreover, the possibility of generating multicomponent matrices with improved mechanical features was explored, by mixing the peptides in the couples a-K2/t-K2 and c-K2/g-K2, where the establishment of the Watson and Crick pairing was supposed to favor the packing. The obtained hydrogels were fully characterized through a series of spectroscopic techniques and their biocompatibility was also tested in vitro. The CEST imaging performances were also examined and a proof of concept of their possible application as implants for diagnostic scopes was given.
2. Results and discussion
2.1. Hydrogel design and synthesis
A peptide nucleic acid (PNA) basis (adenine, cytosine, guanine, or thymine) was inserted at the N-terminal of the previously reported K2 peptide,31 composed by five neutral aliphatic residues (L, I, V, A and G) followed by a lysine (K) conferring the sequence a net positive charge at neutral pH. The aromatic heterocycles carried by the PNA skeleton were expected to promote aggregative behavior driven by π–π interactions. The sequences thus designed, named a-K2, c-K2, g-K2, and t-K2 (see Fig. 1), were synthesized through the SPPS procedure, purified by RP-HPLC chromatography and characterized by LC–MS (Fig. S1, ESI†). The ability of each peptide to self-assemble was evaluated in PBS at pH = 7.4. Indeed, our previous studies on Fmoc-analogues demonstrated that the addition of PBS could catalyze the formation of hydrogels as a consequence of the reduction of the electrostatic repulsive forces between the lysine chains.2.2. Secondary structure characterization
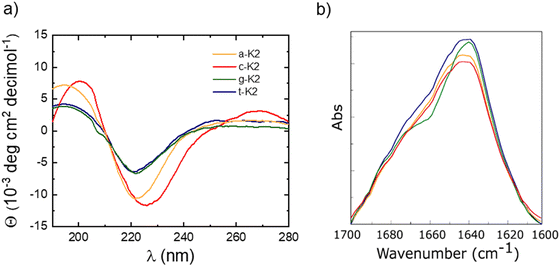
Samples at a concentration of 1 × 10⁻² mol L−1 were examined through circular dichroism (CD) and Fourier transform infrared (FTIR) spectroscopies. As it can be observed from the inspection of Fig. 2(a), the CD profiles of the four peptides point out the occurrence of a β-sheet organization, evidenced by the presence of a positive band centered at 195 nm for a-K2, g-K2, and t-K2, and red-shifted to 200 nm for c-K2, generated by π–π* transitions, and a negative signal indicative of n–π* ones, at 220 nm for a-K2, g-K2, and t-K2, undergoing a slight bathochromic effect (225 nm) for c-K2. A similar β-sheet organization was previously observed for Fmoc-K2 and Ac-K2 progenitors, thus suggesting that N-capping of this Lys-containing sequence has no influence on their aggregation modes.17,18 An additional analysis of the secondary structure was supported by FTIR spectroscopy. The IR spectra of peptides and proteins contain nine different amide bands (I to VII, A and B), deriving from vibrational contributions of the backbone and of amino acid side chains. The amide I region, going between 1700 and 1600 cm−1, is associated with the C![[double bond, length as m-dash]](https://www.rsc.org/images/entities/char_e001.gif) O stretching motus, and it represents the relevance range for the secondary structure analysis. For this, deconvolved IR spectra in amide I (Fig. 2(b)) are dominated by a 1642 cm−1 peak, attributable to C
O stretching motus, and it represents the relevance range for the secondary structure analysis. For this, deconvolved IR spectra in amide I (Fig. 2(b)) are dominated by a 1642 cm−1 peak, attributable to C![[double bond, length as m-dash]](https://www.rsc.org/images/entities/char_e001.gif) O stretching reported for the presence of β-rich structures.
O stretching reported for the presence of β-rich structures.
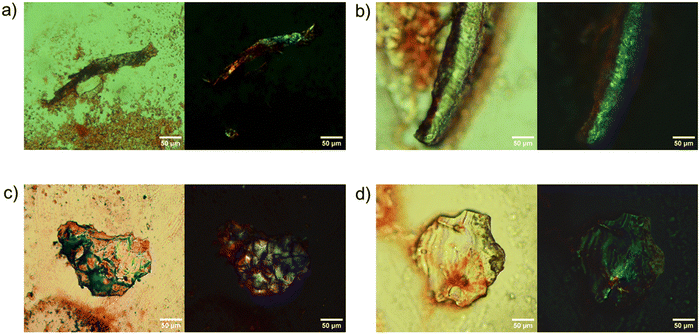
The tendency of peptides to assume a β-sheet structure was further confirmed by the Congo red (CR) birefringence assay carried out on the samples in the solid state. CR is a dye that, after staining amyloids, shows “anomalous birefringence” under polarized light.32
Indeed, the “apple-green” color, generally identified as the characteristic and expected one for CR-stained amyloid-like samples, only occurs under ideal conditions, whether sometimes additional or strain birefringence partially or completely eliminates the blue or the yellow transmissions, originating from negative and positive birefringence, respectively.32 In our case, the aggregates belonging to each of the four samples are clearly positive in the CR assay, even if for g-K2, a blue color is observed in place of a classic green one (Fig. 3).
2.3. Fluorescence studies
The critical aggregation concentration (CAC) of the four peptide derivatives was estimated through fluorescence experiments using Thioflavin T (ThT), a dye able of recognizing amyloid-like structures rich in β-sheets through a mechanism being still not fully understood. Some hypotheses suggest that ThT can bind β-sheet grooves or that binding may depend on electrostatic interactions, or it can be affected by the diameter of the supramolecular structure. However, when in the presence of a β-sheet organization, by exciting ThT at 450 nm, a characteristic emission peak centered at 485 nm can be detected. For this reason, solutions at different peptide concentrations were prepared in the presence of ThT at a concentration of 5 × 10⁻⁵ mol L−1. By plotting the fluorescence intensity as a function of the peptide concentration, CAC values, pin-pointed at the breakpoint of the curve, were found to be 1.96 × 10⁻³ mol L−1, 7.24 × 10⁻⁴ mol L−1, 1.74 × 10⁻³ mol L−1 and 6.95 × 10⁻⁴ mol L−1 for a-K2, c-K2, g-K2, and t-K2, respectively (Fig. 4 and Table 1). The higher aggregative tendency observed for the pyrimidine derivatives (c-K2 and t-K2) at lower concentrations can be explained by considering that the one-ring structure, compared with the purine heterocycle, may result in less pronounced steric hindrance. This, in turn, could promote better packing between the peptide monomers.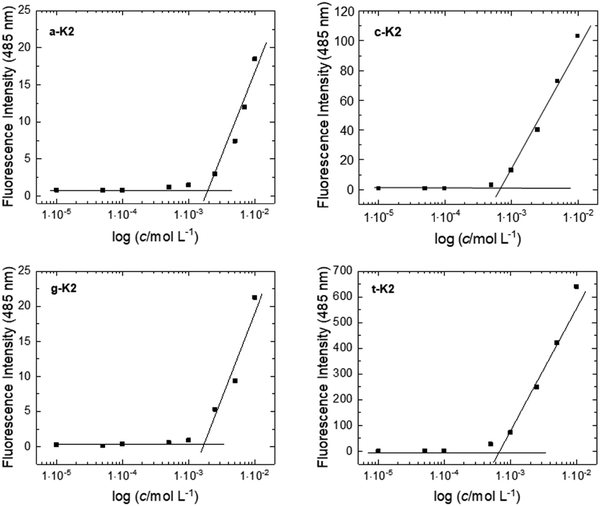 | ||
| Fig. 4 ANS titration curves for peptides. The fluorescence intensity of ThT at 485 nm is reported as a function of the peptide concentration and the CAC value is determined in the intercept point. | ||
| Peptide | Formula | MWcalc. (a.m.u.) | MWdeter. (a.m.u.) | t R (min) | CAC (mol L−1) |
|---|---|---|---|---|---|
| a-K2 | C39H66N15O8 | 874.0 | 874.7 | 11.12 | 1.96 × 10⁻³ |
| c-K2 | C38H67N13O9 | 850.0 | 850.6 | 10.08 | 7.24 × 10⁻⁴ |
| g-K2 | C39H67N15O9 | 890.0 | 890.6 | 11.06 | 1.74 × 10⁻³ |
| t-K2 | C39H68N12O10 | 865.0 | 865.6 | 11.83 | 6.95 × 10⁻⁴ |
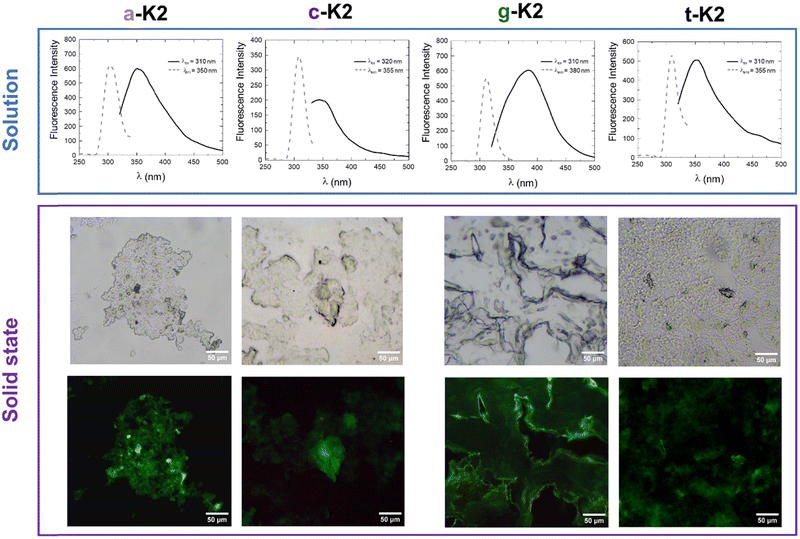
Fluorescence spectra of the four PNA-containing sequences were collected at two peptide concentrations: one below (5 × 10⁻⁶ mol L−1) and one above (1 × 10⁻² mol L−1) the CAC values previously estimated. As expected, for samples below the CAC, an emission peak at 310 nm can be observed upon excitation at 260 nm, corresponding to the maximum absorption wavelength of the four PNA residues (see Fig. S5, ESI†).33 Also, fluorescence analyses were conducted on more concentrated solutions to detect the aggregate formation (Fig. 5). Aggregation induced emission (AIE) phenomena with a Stokes shift comprised between 35 and 45 nm were observed for a-K2, c-K2 and t-K2, whereas an 80 nm shift is observed for g-K2. Moreover, a marked photoluminescence behavior was observed for air-dried samples through fluorescence microscopy analyses. All the peptide aggregates were able to emit in the blue and green spectral regions. The fluorescence emission in the green region of dried films has been reported as an example in Fig. 5.
2.4. Hydrogel preparation and characterization
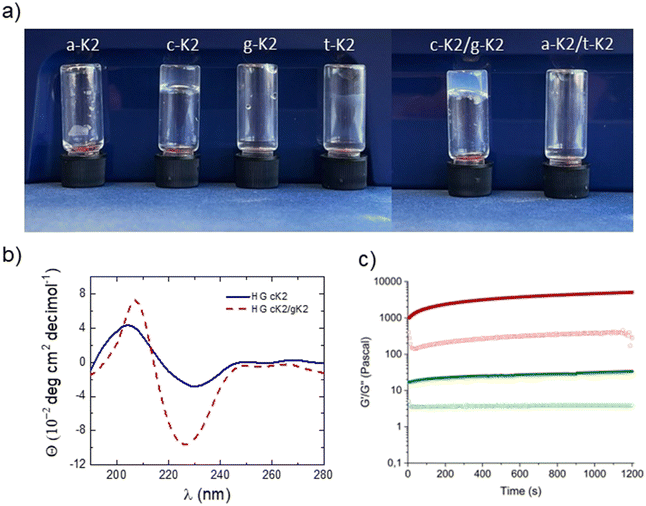
Hydrogel formation was tested for all the PNA-containing sequences by first solving the peptide powder at 3.0 wt% concentration in water and then by adding PBS to a final 2.6 wt% peptide concentration, similarly to what was previously done for Ac-K and Fmoc-K analogues. PBS acts as a trigger, being able to act as a bridge between the positively charged lysine chains, reducing the electrostatic repulsion. Under these tested conditions, only c-K2 was demonstrated to undergo a gelation process, resulting in a transparent and self-supporting hydrogel, as underlined by the inspection of the inverted test tube analysis in Fig. 6. Moreover, the possibility of establishing new additional interactions between purine and pyrimidine rings was considered as a chance to improve the mechanical properties of the final matrix. The hydrogen bonds responsible for the base pairing, known as Watson and Crick interactions, occur in the adenine–thymine and guanine–cytosine couples, in the number of two and three, respectively.After solving the peptide couples in water at a concentration of 3 wt% (1/1, w/w ratio) and then adding PBS as previously described, only the mixture c-K2/g-K2 was able to generate an opaque hydrogel (Fig. 6), while the interactions which were supposed to be established between a-K2 and t-K2 peptide derivatives did not support the formation of a network able to retain water. The swelling ratio, calculated by incubating hydrogels with PBS overnight, was 23.3% and 28.6% for cK2 and cK2/gK2 HGs, respectively. These values are indicative of the amount of water that the gel network can retain.
2.5. Rheological studies
The Hydrogel state for both the systems is supported by the rotational controlled stress rheological analysis. The time sweep (20 min, frequency of 1 Hz and strain of 0.1%) for both the matrices is reported in terms of storage (G′) and loss (G′′) moduli in Fig. 6(c), and it was performed on 400 μL (3.0 wt%) of freshly prepared samples. A preliminary evaluation of the optimal measurement parameters was achieved according to both dynamic oscillation strain (at a frequency of 1 Hz) and dynamic frequency sweep (at 0.1% strain) measurements, collected in Fig. S6 (ESI†). The gel state is analytically evidenced by values coupled with G′ > G′′. (G′ = 34 Pa, G′′ = 4 Pa, for c-k2/and G′ = 5092 Pa, G′′ = 280 Pa, for c-k2/g-k2). Compared to the parental Fmoc-K2 matrices (G′ = 925 Pa), the replacement of Fmoc-protecting group with the c-base generates a decrease in rigidity. The weak nature of the c-K2 hydrogel is strongly modified by the inclusion of g-K2 monomers, thus allowing the formation of multicomponent matrices. The mixed hydrogel shows additionally an exacerbated viscoelastic behavior, with an increase in tanδ value (ratio G′/G′′) from 8.50 (c-K2) to 18.18. This evidence suggests a cooperative interaction of PNA-K2 monomers, producing an increase in the no-covalent interactions networking.2.6. In vitro CEST-MRI of hydrogels
It has been already reported that K2 peptides do not exhibit any CEST effect.18 On the other hand, the amino groups of both cytosine and guanine moieties have been demonstrated to generate a CEST contrast when stimulated at 2–3 ppm downfield from bulk water protons resonance.34,35Based on this premise, it was considered pertinent to investigate the CEST properties of the two systems that were able to form a hydrogel: c-K2 peptide alone and in equimolar ratio with a g-K2 peptide. Two formulations for each system, differing in the amount of the peptides (1.7 wt% and 2.6 wt%), were tested. Fig. 7 shows the Z-spectra (that reports the intensity of the water protons signal as a function of the saturation frequency) and the asymmetry plot (calculated from the fitted Z-spectra) measured at 7 T and room temperature for the investigated HGs.
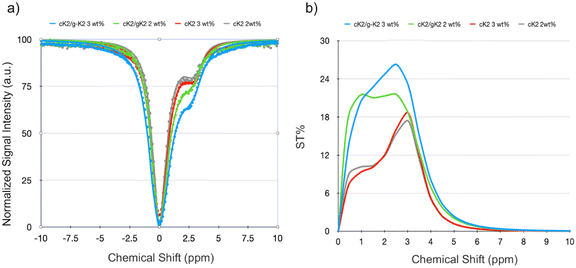 | ||
| Fig. 7 (a) Z- and (b) ST% spectra of different tested HGs, i.e.: c-K2/g-K2 3 wt% (blue line), cK2/g-K2 2 wt% (green line), cK2 3 wt% (red line) and cK2 2 wt% (grey line) (pH = 7.1 ± 0.1). | ||
Z-spectra were fitted using the set of Bloch equations modified to include chemical exchange36 and assuming the presence of a single pool of protons exchanging with the bulk water protons. The relevant parameters obtained (chemical shift offset, Δδ, and proton exchange rate, kex) are listed in Table 2.
| Sample | Δδ (ppm) | k ex (s−1) | ST% |
|---|---|---|---|
| c-K2 2 wt% | 3.1 | 1052.6 | 17.4 |
| c-K2 3 wt% | 3.1 | 909.1 | 18.7 |
| c-K2/g-K2 2 wt% | 2.5 | 2000.0 | 21.6 |
| c-K2/g-K2 3 wt% | 2.5 | 1785.7 | 26.3 |
The kex values appear in the expected range for the amino protons of the two bases (e.g., kex values in the 800–900 s−1 range have been reported for unconjugated and not gelled cytosine).35 An interesting outcome of the fitting is the acceleration of the proton exchange rate in the mixed HGs, which is one of the factors responsible for the higher CEST efficiency exhibited by this scaffold with respect to the pure c-K2 HGs. Another observation comes from the asymmetry plots (Fig. 7(b)), which suggest that the enhancement of the CEST contrast in the mixed HG is partly justified by an ST effect at a lower chemical shift (1–2 ppm).
However, the analysis of the Z-spectra did not allow for discerning the molecular events that contribute to the differences between the CEST properties of c-K2 and c-K2/g-K2 HGs. Likely, the contribution from the mobile protons of the guanine moiety (including the possible role of the exchangeable OH protons of the tautomers of the base) and the H-bond pairing between cytosine and guanine may account for the observed results. Beyond this, the mixed c-K2/g-K2 HG coupled the best CEST-MRI performance with good mechanical properties, and for this reason, this HG was selected for the next experiments.
Since the proton exchange mechanism is pH dependent, the CEST effect of the c-K2/g-K2 3 wt% HG was monitored at two additional pH values: 5.5, 6.6, and 7.4 (Fig. 8). Lowering pH significantly reduced the CEST contrast, and this effect can be accounted for in terms of the slowing down of the proton exchange rate. In contrast, at pH 7.4, not only the CEST contrast enhance to almost 40% due to the base-catalysis of the proton exchange, but an additional ST peak was detected around 6 ppm with a CEST effect of ca. 7%. As this frequency offset nicely corresponds to the resonance of imino protons, this saturation transfer is likely generated by the irradiation of the imino protons of the guanine base, whose exchange rate was likely too slow at pH 7.
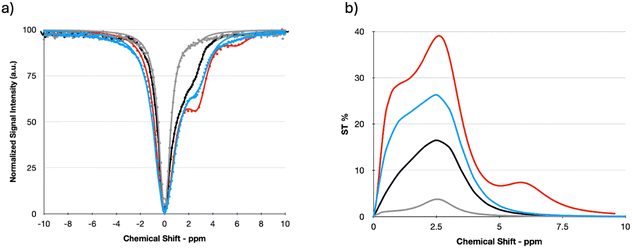 | ||
| Fig. 8 (a) Z- and (b) ST% spectra of c-K2/g-K2 3 wt% HGs, at pH = 5.5 (grey line), pH = 6.6 (black line), pH = 7 (blue line), and pH = 7.4 (red line). | ||
To confirm the suitability of this formulation for in vivo applications, cell toxicity has been in vitro assessed by using an MTT assay. Cell toxicity of c-K2/g-K2 and Ac-K1 hydrogels has been tested by using MTT assay on three cells lines, i.e. (i) GL261 (murine glioma), (ii) TS/a (murine breast carcinoma), and (iii) 3T3-NIH (murine fibroblasts). Cells were incubated for 24 h in the presence of a cell medium previously incubated with the hydrogel to assess if the release of some hydrogel components could affect cell viability. As reported in Fig. S7 (ESI†), hydrogels can be considered non-toxic, since cell viability is ca. 100% for all the cell lines.
2.7. In vivo imaging of c-K2/g-K2 hydrogel using CEST-MRI
In vitro preliminary results were promising enough to assess, as proof of concept, the in vivo MRI detection of the c-K2/g-K2 HG in vivo by intratumor injection of the scaffold in tumor-bearing Balb/c mice (n = 3). For this purpose, TS/a murine breast cancer cells have been subcutaneously injected in the back of Balb/c mice. Animals were enrolled in the study when tumors reached the volume of ca. 400 ± 50 mm3. Then, 50 μL of c-K2/g-K2 HG were injected into the tumor core and MRI-CEST sessions were performed before and after the injection of the hydrogel at different times (from 15 min to 24 h) to assess the detectability and the stability of the HG over time in a tumor microenvironment. Fig. 9 shows T2w and CEST images acquired after presaturation at 2.5 ppm of a representative mouse injected with the c-K2/g-K2 hydrogel. T2w MR images showed the presence of a region of hyperintensity in the tumor corresponding to the localization of the hydrogel because of its high-water content. Such a region quickly decreased over time, likely as a consequence of the hydrogel degradation and re-absorption.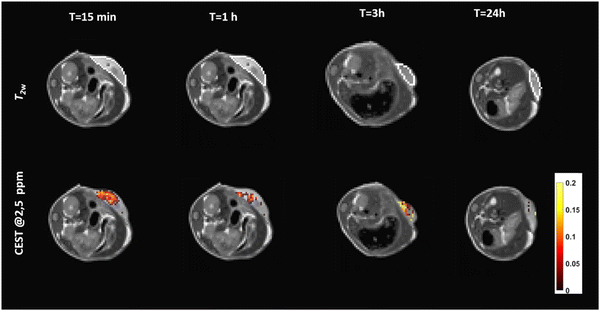 | ||
Fig. 9
T
2w and CEST@2.5![[thin space (1/6-em)]](https://www.rsc.org/images/entities/char_2009.gif) ppm of a representative mouse intratumorally injected with the c-K2/g-K2 hydrogel at variable time post-injection. ppm of a representative mouse intratumorally injected with the c-K2/g-K2 hydrogel at variable time post-injection. | ||
CEST-MR images reported a well-detectable signal with ST% = 11% 15 min post injection. The analysis of ST% in manually drawn ROIs shows a quick decrease of ST% signal down to ca. 4% at 3 hours from implantation (Fig. 10). The stability of the same hydrogel was also tested upon subcutaneous administration. However, when injected under the skin, the hydrogel rapidly spread out into the subcutaneous space and was reabsorbed (Fig. S8, ESI†).
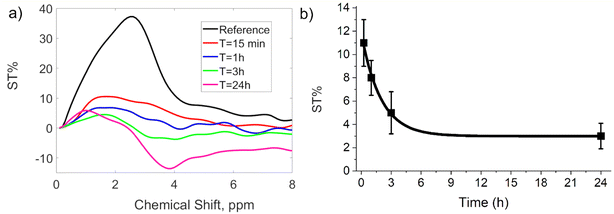 | ||
| Fig. 10 ST% spectra (a) and ST% vs. time (b) at variable time after c-K2/g-K2 hydrogel administration (t = 15 min, 1 h, 3 h and 24 h). | ||
Finally, preliminary tests on the capability of this formulation to retain the drug have been carried out by loading c-K2/g-K2 hydrogel with salicylic acid, which inherently display CEST properties. Fig. S8 (ESI†) shows the Z- and ST-spectra of the hydrogel with the drug. It is possible to note that both CEST signals are present, i.e. (i) the one of the hydrogels centered at 2.5 ppm and (ii) the one of salicylic acid centered at ca. 9 ppm. It must be noted that in the presence of salicylic acid, the CEST effect of the hydrogel is significantly lower than the one reported for the drug-free hydrogel. This is the consequence of two factors, i.e. (i) the lowering of pH in the presence of the acidic drug and (ii) the need to dilute the hydrogel in buffer to partially counteract the pH lowering.
3. Conclusion
Herein, a peptide nucleic acid (PNA) moiety (containing alternatively adenine, cytosine, guanine, or thymine) was inserted at the N-terminal of the K2 peptide, composed of a sequence of five neutral aliphatic residues (L, I, V, A and G) followed by lysine (K). All of the explored sequences (a-K2, c-K2, g-K2 and t-K2) were found able to self-assemble with a β-sheet secondary structure confirmed by both CD and FT-IR spectroscopic analyses. However, only c-K2 was able to form hydrogels at the tested 1.7 and 2.6 wt% concentration, after triggering the gelation with the addition of PBS to a watery peptide solution. Moreover, the capability of c-K2 to gel in combination with g-K2 was also tested and the Watson and Crick pairing allowed an increase in the mechanical responsivity of the hydrogel. In vitro, both the mono- and the multi-component c-K2-based hydrogels (HGs) exhibited a readily detectable CEST-MRI contrast and high biocompatibility, suggesting promising potential for in vivo applications. Upon intratumor administration, the hydrogel displayed rapid in vivo re-absorption due to its considerable softness. Therefore, further efforts are required to optimize the rheological and pharmaceutical properties while maintaining or enhancing CEST performance. This optimization is crucial for utilizing such material in topical drug administration or as a scaffold for cellular therapies.Furthermore, it is essential to note that the data presented here were obtained at 7 T, a magnetic field commonly used in preclinical studies but not yet in clinical MRI, where scanners typically operate at 1.5 or 3 T. At lower magnetic fields, the mobile protons of the proposed system exhibit a kex rate larger than the difference in chemical shift between their resonance and the bulk water signal (Δδ), thereby compromising the fundamental condition of any CEST agent (Δδ > kex). This poses a significant challenge to the clinical translation of DIACEST systems, as recently observed with GlucoCEST agents. Therefore, optimizing the properties of PNA-based HGs (by slowing down the exchange rate and/or increasing the chemical shift offset), likely achievable through modulation of intermolecular interactions, will be necessary.37
In conclusion, this study introduces PNA-based hydrogels capable of being imaged via CEST-MRI, marking a significant step towards the creation of new and refined systems. While certain aspects such as sensitivity, chemical shift, and kex rates require further optimization, the PNA-based hydrogels presented here offer a promising alternative to Gd(III)-based agents, potentially reducing or eliminating the need for metal-based probes.38
4. Materials and methods
Chemicals
Fmoc-A-(Bhoc)-AEG-OH (2-[[2-[6-(benzhydryloxycarbonylamino)purin-9-yl]acetyl]-[2-(9H-fluoren-9-ylmethoxycarbonylamino)ethyl]amino]acetic acid), Fmoc-C-(Bhoc)-AEG-OH (2-[[2-[4-(benzhydryloxycarbonylamino)-2-oxopyrimidin-1-yl]acetyl]-[2-(9H-fluoren-9-yl methoxy carbonyl amino) ethyl]amino]acetic acid), Fmoc-G-(Bhoc)-AEG-OH (2-[[2-[2-(benzhydryloxycarbonyl amino)-6-oxo-1H-purin-9-yl]acetyl]-[2-(9H-fluoren-9-ylmethoxycarbonylamino)ethyl]amino]acetic acid) and Fmoc-T-AEG-OH (2-[2-(9H-fluoren-9-ylmethoxycarbonylamino)ethyl-[2-(5-methyl-2,4-dioxopyrimidin-1-yl)acetyl]amino]acetic acid) were purchased from PolyOrg, Inc. (Leominster, MA). Protected Nα-Fmoc-amino acid derivatives, Rink amide MBHA (4-methylbenzhydrylamine) resin and coupling reagents are commercially available from Calbiochem- Novabiochem (Laufelfingen, Switzerland). All other chemical products are commercially available from Fluka (Bucks, Switzerland), Merck (Milan, Italy) or Labscan (Stillorgan, Dublin, Ireland), and unless stated otherwise, they were used as delivered. Sodium chloride, potassium chloride, sodium phosphate dibasic, potassium phosphate monobasic and all other chemicals were purchased from Sigma Aldrich, Co. LLC-Merck KGaA, Darmstadt, Germany, and used without further purification. PBS (phosphate buffered saline) was prepared containing 0.137 M sodium chloride and 10 mM or 20 mM phosphate (pH 7.3 ± 0.1, osmolarity 280 ± 10 mosm L−1).Solid-phase peptide synthesis
The peptide derivatives a-LIVAGK-NH2 (a-K2), c-LIVAGK-NH2 (c-K2), g-LIVAGK-NH2 (g-K2) and t-LIVAGK-NH2 (t-K2), were obtained through standard SPPS strategy using the Fmoc/tBu strategy. The Rink amide MBHA resin, with a substitution rate of 0.50 mmol g−1, was used as the solid-phase support. Each peptide derivative was synthesized in DMF using a scale of 0.20 mmol in DMF. After leaving the resin to swell in DMF for 30 min, the Fmoc group was removed by treatment with 30% (v/v) piperidine in DMF for two cycles of 10 min each. A 2-fold molar excess of the Fmoc-protected amino acid was used for the coupling and solved in DMF together with equimolar amounts of 1-hydroxybenzotriazole (HOBt), benzotriazol-1-yl-oxytris-pyrrolidino-phosphonium (PyBOP), and a 4-fold molar excess of diisopropylethylamine (DIPEA). Each coupling was performed twice for 40 min. The coupling of the PNA base was performed by solving a 5-fold molar excess of the base, HOBt and PyBOP in DMF with 1 mL of pyridine and 24 μL of N-methylmorpholine. After removal of the Fmoc protecting group, crude peptides were fully cleaved by treating the resin for 3 h at room temperature with a TFA (trifluoroacetic acid)/meta-Cresol/TIS (triisopropylsilane)/H2O (80/15.5/2.5/2 v/v/v/v) mixture. Cold ether was used to precipitate the peptides, which were freeze-dried for three times.Pure peptides were obtained from the crude ones through RP-HPLC with an LC8 Shimadzu HPLC system (Shimadzu Corporation, Kyoto, Japan) equipped with a UV lambda-Max Model 481detector, using a Phenomenex (Torrance, CA, USA) C18 column. The flow rate was set at 20 mL min−1 and the elution solvents were H2O/0.1% TFA (A) and CH3CN/0.1% TFA (B) with (B) increasing from 10 to 70% over 30 min. Analytical RP-HPLC analysis was used to assess the purity of peptides. Peptides were eluted from a C18 column using (A) and (B) as solvents and a method providing the increase of (B) percentage from 10 to 70% over 20 min at a flow rate of 1 mL min−1. The identity of peptides was confirmed by MS spectrometry performed by using an LTQ XL Linear Ion Trap Mass Spectrometer, as detailed in the ESI.†
Hydrogel preparation
Peptide solutions in different concentrations were prepared by simply solving the peptide powders in 1 × 10⁻² mol L−1 phosphate buffer. Hydrogels were obtained by solving the single peptide powder or the purine/pyrimidine 1/1 based peptide mixture in water at a concentration of 2.0 or 3.0 wt%, followed by the addition of phosphate buffer 1 × 10⁻¹ or 2 × 10⁻¹ mol L−1, leading to a final peptide concentration of 1.7 or 2.6 wt%, respectively. After 15 minutes of sonication, the sample was left at room temperature overnight before the hydrogel formation was evaluated.Circular dichroism (CD) spectroscopy
Peptide solutions at a concentration of 1 × 10⁻² mol L−1 were placed in 0.1 quartz cell and Far-UV CD spectra were collected through a Jasco J-810 spectropolarimeter equipped using a NesLab RTE111 thermal controller unit at 25 °C. Spectra were recorded from 280 to 180 nm. 0.5 nm step, 1 nm bandwidth, and 1 s collection time per step were used as experimental settings for the measures. For each sample, three scans were collected, averaged, and corrected for the blank to obtain the final spectrum.Fourier transform infrared (FTIR) spectroscopy
FTIR spectra were collected using a Thermo-Scientific Nicolet iS5 instrument with a DTGS detector. Peptide solutions were prepared in PBS at a concentration of 0.5 wt% and were fixed into a Specac Pearl liquid cell with CaF2 plates. Each sample was subjected to a total of 128 scans. Spectra were collected over the range of 900–4000 cm−1.Fluorescence spectroscopy
A Varian Model Cary Eclipse spectrofluorometer was used to carry out fluorescence experiments. Samples were placed in a 10.0 mm × 5.00 mm quartz cell and the settings used for the measurement were excitation and emission bandwidths of 2.5 nm and a temperature of 20 °C. The Critical Aggregation Concentration (CAC) of the peptide analogues was estimated through the use of thioflavin T (ThT), a cationic benzothiazole dye showing enhanced fluorescence around 485 nm upon binding to amyloid fibers. The peptide powder was solved, at different final concentrations, into a ThT PBS solution at a concentration of 5 × 10⁻⁵ mol L−1. Emission spectra were recorded between 460 and 600 nm (λex = 450 nm). Emission spectra of the peptides at low concentrations (5 × 10⁻⁶ mol L−1) were recorded between 270 and 500 nm after excitation at 260 nm. The aggregation properties of the peptides were further investigated by fluorescence measurements in both excitation and emission modes carried out on highly concentrated (1 × 10⁻² mol L−1) peptide solutions.CR staining and polarized optical microscopy (POM)
30 μL of each peptide solution (at a concentration of 0.01 mol L−1) was placed on a microscope slide and air-dried before being stained with a saturated Congo red aqueous solution. The sample was thus left drying again and then it was observed under bright-field illumination and between crossed polars by using an OptechMB80-Pol microscope.Fluorescence microscopy
After drop-casting on a microscope slide the 1 × 10⁻² mol L−1 peptide solution and letting it dry overnight, peptide aggregates at the solid state were analyzed using a Fluorescence OptechMB80-Pol microscope.Swelling test
The swelling ratios of hydrogels were measured by adding 0.8 mL of doubly distilled water to 350 μL of the hydrogel. The sample was then incubated overnight at 30 °C. After removing the excess of water, fully swollen hydrogels were weighed (Ws), freeze-dried and weighed again (Wd). The swelling behavior was expressed, according to eqn (1), as the swelling ratio q, which is the ratio between the weight of the swollen sample (Ws) and the weight of the freeze-dried hydrogel.| q = ((Ws − Wd))/Wd % | (1) |
Rheological studies
Rheological measurements of freshly preformed 2.6 wt% hydrogels (500 μL) were performed with a rotational controlled-stress rheometer (Malvern Kinexus, UK) using a 1.5 cm diameter flat-plate geometry (PU20-PL61). All the analyses were conducted at 25 °C in a humidity chamber with a gap distance of 1.0 mm. Preliminary parameter optimization was performed via oscillatory frequency (0.1–100 Hz) and strain sweep (0.1–100%). Then, a fifteen-min time-sweep oscillatory analysis was conducted at 25 °C with a 0.1% strain and a 1.0 Hz frequency. The rheological profiles, reported in Pascal (Pa), were plotted as storage or elastic modulus (G′) and shear loss or viscous modulus (G′′).Cells culture
Cell culture materials, such as RPMI (Roswell Park Memorial Institute), DMEM (Dulbecco's Modified Eagle Medium), FBS (Fetal Bovine Serum), Glutamine, penicillin/streptomycin, and the MycoAlert™ Mycoplasma Detection Kit, were obtained from Lonza Sales AG-EuroClone SpA, Milano (Italy). The research involved three different types of cells: GL261 (murine glioma), TS/a (murine breast carcinoma), and 3T3-NIH (murine fibroblasts). GL261 and 3T3-NIH cell lines were acquired from ATCC (American Type Culture Collection). They were cultivated in DMEM 1064 medium supplemented with 10% heat-inactivated FBS, 2 mM glutamine, 100 U mL−1 penicillin, and 100 μg mL−1 streptomycin.The cells were seeded in 75-cm2 flasks at a density of approximately 2 × 10⁴ cells per cm2 and maintained in a humidified 5% CO2 incubator at 37 °C. When they reached confluence, the detachment was achieved by adding 1 mL of Trypsin-EDTA solution (0.25% (w/v) Trypsin-0.53 mM EDTA). TS/a murine breast cancer cells were derived at the University of Torino from a spontaneous mammary adenocarcinoma that emerged in a retired breeder BALB/c female.39 These cells were grown in the RPMI 1064 medium with 10% heat inactivated FBS, 2 mM glutamine, 100 U mL−1 penicillin, and 100 μg mL−1 streptomycin. They were also seeded in 75-cm2 flasks at a density of approximately 2 × 10⁴ cells per cm2 and maintained in a humidified 5% CO2 incubator at 37 °C. Similarly, detachment at confluence was achieved using 1 mL of Trypsin-EDTA solution (0.25% (w/v) Trypsin-0.53 mM EDTA). All cells used in the experiments were tested for mycoplasma using the MycoAlert™ Mycoplasma Detection Kit, and they were confirmed negative.
Cells viability
To investigate the compatibility of the hydrogels with GL261, TS/a, and 3T3-NIH cell lines, an elution assay was conducted following ISO 10993-5 guidelines. In this assay, the cells were cultured in a specific medium that had been previously conditioned by the hydrogels. To begin the elution test, 200 mL of each hydrogel was prepared under sterile conditions. The hydrogels underwent two rounds of washing, each lasting 2 hours, using 1 mL of complete medium (in a ratio of 1/5 v/v gel to extracting media). After this, the gels were incubated overnight with 1 mL of fresh complete medium, and the next day, the medium was collected for the elution test. No color change was observed in the medium after incubation, while a pink coloration of the gel after the medium extraction indicated its permeability. To assess the toxicity, an MTT assay was utilized. Cells were seeded into 96-well tissue culture plates (104 cells per plate) one day before the experiment. Then, the cells were exposed to the complete medium conditioned by the presence of the hydrogel to be tested. After overnight incubation, the medium was removed, and the cells were washed. Next, fresh medium supplemented with 0.5 mg mL−1 MTT (Thiazolyl Blue Tetrazolium Bromide, Sigma Aldrich) was added to the cells and incubated for 4 hours in a humidified 5% CO2 incubator at 37 °C. Following this, the MTT solution was removed, and the plates were filled with 0.1 mL of DMSO each, allowing for the solubilization of formazan crystals for 30 minutes at room temperature under gentle agitation. The resulting-colored solutions’ absorbance was then quantified using a 96-multiwell iMark Bio-Rad microplate Reader at a wavelength of 570 nm. The percentage of viable cells was determined by comparing the mean absorbance of the treated cells (AbsT) to the mean absorbance of the untreated cells (Abscnt) after subtracting the background absorbance from empty plates. The formula used to calculate the percentage of viable cells was:| Viable cells% = (AbsT/Abscnt) × 100 | (2) |
To obtain reliable results, the cell experiments were repeated four times, and the data were presented as the mean value ± standard deviation.
Animals
In vivo experiments were conducted using female Balb/C mice aged 8–10 weeks, obtained from Charles River Laboratories in Calco, Italy. These mice were bred at the Molecular Biotechnology Center of the University of Turin, Italy. Throughout the experiments, the mice were housed under standard conditions, with a 12-hour light/dark cycle, and provided with rodent chow and water ad libitum. The experiments were performed following the Amsterdam Protocol on Animal Protection and in accordance with institutional guidelines, which adhere to national laws (D.L.vo 116/92, D.L.vo 26/2014, and subsequent additions) as well as international laws and policies (2010/63/EU, EEC Council Directive 86/609, OJL 358, Dec 1987, NIH Guide for the Care and Use of Laboratory Animals, U.S. National Research Council, 1996). This study was carried out in the framework of a protocol approved by the Italian Ministry of Health (authorization number 298/2022-PR).To prepare the tumor model, approximately 3 × 10⁵ TS/a breast cancer cells were suspended in 0.1 mL of PBS and subcutaneously injected into the flank of female mice aged 8–10 weeks (n = 3 for each tested hydrogel). This low number of mice used in the experiments aligns with the 3Rs principles (replacement, reduction, refinement) for ethical animal use, considering that the purpose was to demonstrate the in vivo feasibility of the proposed method. For the experiments, the mice were anesthetized through intramuscular injection of tiletamine/zolazepam (Zoletil 100; Virbac, Milan, Italy) at a dose of 20 mg kg−1, combined with xylazine (Rompun; Bayer, Milan, Italy) at a dose of 5 mg kg−1, using a 27-G syringe. The tumor size of the mice was monitored weekly using calipers. The experiments were conducted two weeks after the implantation of tumor cells when the mean tumor volume reached approximately 400 ± 50 mm3. At this point, about 50 μL of each hydrogel was intratumor implanted using a 27-G syringe. CEST-MR (Chemical Exchange Saturation Transfer-Magnetic Resonance) images were then acquired following the established procedure. At the conclusion of the experiments, the mice were sacrificed through cervical dislocation in compliance with ethical guidelines.
MRI and data analysis
Magnetic resonance (MR) images of phantoms and mice were obtained using a Bruker Avance 300 spectrometer equipped with a Micro 2.5 microimaging probe, at a room temperature of approximately 21 °C. T2-weighted (T2w) images were acquired using a standard RARE (rapid acquisition with refocused echoes) sequence with specific parameters: tepetition time (TR) = 5000 ms, echo time (TE) = 5.5 ms, RARE factor = 24, number of averages = 4, isotropic 128 × 128 acquisition matrix with a FOV (field of view) of 30 mm and a slice thickness of 1 mm.Z-spectra (CEST-MRI) were recorded using a typical RARE spin-echo sequence with the following parameters: TE = 3 ms, TR = 5 s, RARE factor = 32, and number of averages = 1. An isotropic 64 × 64 acquisition matrix with a FOV of 30 mm and a slice thickness of 1 mm was utilized. Prior to the entire sequence, a saturation scheme was applied, involving a continuous rectangular wave pulse lasting 2 seconds with a radiofrequency intensity of 3 μT. The frequency-offset range investigated was ± 20 ppm. Custom-made script running in Matlab software (Mathworks Inc., Natick, MA) was employed for data analysis.
First, the Z-spectra were processed using smoothing spline interpolation to identify the frequency with the minimum signal, which is attributable to the resonance of the bulk water protons on the ROI to be analyzed. This offset was then applied to the acquired data points to get a symmetric Z-spectrum.40 Subsequently, for the in vitro CEST experiments, data were analyzed using the model originally developed by Woessner et al.,36 which is based on the set of Bloch equations modified to incorporate chemical exchange and implemented with a variable number of exchanging pools depending on the system under analysis.
This process allowed the correct calculation of the ST% (saturation transfer percentage) value across the entire range of frequency offsets explored.
The CEST effect was calculated using the following formula:
 | (3) |
Conflicts of interest
There are no conflicts to declare.Acknowledgements
The work has received funding from the Italian Ministry of Research (PRIN project 2017 “Rationally designed nanogels embedding paramagnetic ions as MRI probes”, A. A., E. T.). The authors acknowledge the Italian Ministry of Research for FOE's contribution to the EuroBioImaging MultiModal Molecular Imaging Italian Node (https://www.mmmi.unito.it). This research was performed in the framework of COST Action AC15209 (EURELAX). The work has received funding from the PNRR M4C2-Investimento 1.4-CN00000041 “Finanziato dall’Unione Europea-NextGenerationEU” (G. F.). Open Access Funding provided by Università degli Studi di Napoli Federico II within the CRUI-CARE Agreement.References
- N. Y. Zhang, X. J. Hu, H. W. An, J. X. Liang and H. Wang, Biomaterials, 2022, 287, 121655 CrossRef CAS PubMed.
- Y. Wang, L. Xie, X. Li, L. Wang and Z. Yang, Bioact. Mater., 2023, 31, 549–562 Search PubMed.
- M. Li, H. Yu, Y. Li, X. Li, S. Huang, X. Liu, G. Weng, L. Xu, T. Hou, D. S. Guo and Y. Wang, Biosens. Bioelectron., 2023, 242, 115716 CrossRef CAS PubMed.
- R. Binaymotlagh, L. Chronopoulou and C. Palocci, J. Funct. Biomater., 2023, 14, 233 CrossRef CAS PubMed.
- J. H. Collier and T. Segura, Biomaterials, 2011, 32(18), 4198–4204 CrossRef CAS PubMed.
- A. Yıldız, A. A. Kara and F. Acartürk, Int. J. Biol. Macromol., 2020, 148, 1084–1097 CrossRef PubMed.
- J. D. Hartgerink, E. Beniash and S. I. Stupp, Proc. Natl. Acad. Sci. U. S. A., 2002, 99(8), 5133–5138 CrossRef CAS PubMed.
- L. Raganato, A. Del Giudice, A. Ceccucci, F. Sciubba, S. Casciardi, S. Sennato, A. Scipioni and G. Masci, Int. J. Biol. Macromol., 2022, 207, 656–665 CrossRef CAS PubMed.
- E. Rosa, L. de Mello, V. Castelletto, M. L. Dallas, A. Accardo, J. Seitsonen and I. W. Hamley, Biomacromolecules, 2023, 24(1), 213–224 CrossRef CAS PubMed.
- F. Li, R. Tang, Y. Kang, X. Cui, Y. Wang and X. Yang, Spectrochim. Acta, Part A, 2024, 305, 123492 CrossRef CAS PubMed.
- B. Panigrahi, R. K. Singh, U. Suryakant, S. Mishra, A. A. Potnis, A. B. Jena, R. G. Kerry, H. Rajaram, S. K. Ghosh and D. Mandal, Eur. J. Pharm. Sci., 2022, 171, 106125 CrossRef CAS PubMed.
- J. H. Mondal and D. Das, RSC Adv., 2013, 3, 9117–9149 RSC.
- C. Diaferia, E. Rosa, E. Gallo, G. Smaldone, M. Stornaiuolo, G. Morelli and A. Accardo, Biomedicines, 2021, 9(6), 678 CrossRef CAS PubMed.
- J. Mitrovic, G. Richey, S. Kim and M. O. Guler, Langmuir, 2023, 39(34), 11935–11945 CrossRef CAS PubMed.
- E. Rosa, C. Diaferia, E. Gallo, G. Morelli and A. Accardo, Molecules, 2020, 25(15), 3455 CrossRef CAS PubMed.
- S. Pal, A. H. Khan, M. Chowdhury and P. K. Das, ChemBioChem, 2023, 24(18), e202300253 CrossRef CAS PubMed.
- E. Rosa, F. Carniato, L. Tei, C. Diaferia, G. Morelli, M. Botta and A. Accardo, Pharmaceuticals, 2022, 15(12), 1572 CrossRef CAS PubMed.
- E. Di Gregorio, E. Rosa, G. Ferrauto, C. Diaferia, E. Gallo, A. Accardo and E. Terreno, J. Mater. Chem. B, 2023, 11(31), 7435–7441 RSC.
- D. L. Longo, E. Pirotta, R. Gambino, F. Romdhane, A. Carella and A. Corrado, Methods Mol. Biol., 2023, 2614, 287–311 CrossRef CAS PubMed.
- B. V. Jardim-Perassi, P. Irrera, J. Y. C. Lau, M. Budzevich, C. J. Whelan, D. Abrahams, E. Ruiz, A. Ibrahim-Hashim, S. Damgaci Erturk, D. L. Longo, S. A. Pilon-Thomas and R. J. Gillies, Contrast Media Mol. Imaging, 2023, 2023, 1944970 CrossRef PubMed.
- F. Kogan, H. Hariharan and R. Reddy, Curr. Radiol. Rep., 2013, 1(2), 102–114 CrossRef PubMed.
- I. Hancu, W. T. Dixon, M. Woods, E. Vinogradov, A. D. Sherry and R. E. Lenkinski, Acta Radiol., 2010, 51(8), 910–923 CrossRef PubMed.
- E. Vinogradov, A. D. Sherry and R. E. Lenkinski, J. Magn. Reson., 2013, 229, 155–172 CrossRef CAS PubMed.
- X. Yang, X. Song, Y. Li, G. Liu, S. R. Banerjee, M. G. Pomper and M. T. McMaho, Angew. Chem., Int. Ed., 2013, 52(31), 8116–8119 CrossRef CAS PubMed.
- X. Song, X. Yang, S. R. Banerjee, M. G. Pomper and M. T. McMahon, Contrast Media Mol. Imaging, 2015, 10(1), 74–80 CrossRef CAS PubMed.
- S. Sinharay, E. A. Randtke, K. M. Jones, C. M. Howison, S. K. Chambers, H. Kobayashi and M. D. Pagel, Magn. Reson. Med., 2017, 77(5), 2005–2014 CrossRef CAS PubMed.
- S. Sinharay, C. M. Howison, A. F. Baker and M. D. Pagel, NMR in Biomed., 2017, 30(7), e3721 CrossRef PubMed.
- M. T. McMahon, A. A. Gilad, M. A. De Liso, S. M. Berman, J. W. Bulte and P. C. van Zijl, Magn. Reason. Med., 2008, 60(4), 803–812 CrossRef CAS PubMed.
- B. F. Moon, K. M. Jones, L. Q. Chen, P. Liu, E. A. Randtke, C. M. Howison and M. D. Pagel, Contrast Media Mol. Imaging, 2015, 10(6), 446–455 CrossRef CAS PubMed.
- X. Song, X. Yang, S. Ray Banerjee, M. G. Pomper and M. T. McMahon, Contrast Media Mol. Imaging, 2015, 10(1), 74–80 CrossRef CAS PubMed.
- Y. Loo, A. Lakshmanan, M. Ni, L. L. Toh, S. Wang and C. A. Hauser, Nano Lett., 2015, 15(10), 6919–6925 CrossRef CAS PubMed.
- A. J. Howie, D. B. Brewer, D. Howell and A. P. Jones, Lab. Invest., 2008, 88(3), 232–242 CrossRef CAS PubMed.
- C. Avitabile, C. Diaferia, V. Roviello, D. Altamura, C. Giannini, L. Vitagliano, A. Accardo and A. Romanelli, Chem. – Eur. J., 2019, 25(65), 14850–14857 CrossRef CAS PubMed.
- A. N. Bade, H. E. Gendelman, J. McMillan and Y. Liu, AIDS, 2021, 35(11), 1733–1741 CrossRef CAS PubMed.
- G. Liu, Y. Liang, A. Bar-Shir, K. W. Y. Chan, C. S. Galpoththawela, S. M. Bernard, T. Tse, N. N. Yadav, P. Walczak, M. T. McMahon, J. W. M. Bulte, P. C. M. van Zijl and A. A. Gilad, J. Am. Chem. Soc., 2011, 133(41), 16326–16329 CrossRef CAS PubMed.
- D. E. Woessner, S. Zhang, M. E. Merritt and A. D. Sherry, Magn. Reason. Med., 2005, 53(4), 790–799 CrossRef CAS PubMed.
- M. Kim, F. Torrealdea, S. Adeleke, M. Rega, V. Evans, T. Beeston, K. Soteriou, S. Thust, A. Kujawa, S. Okuchi, E. Isaac, W. Piga, J. R. Lambert, A. Afaq, E. Demetriou, P. Choudhary, K. K. Cheung, S. Naik, D. Atkinson, S. Punwani and X. Golay, Quant. Imaging Med. Surg., 2019, 9(10), 1628–1640 CrossRef PubMed.
- T. Gréa, G. Jacquot, A. Durand, C. Mathieu, A. Gasser, C. Zhu, M. Banerjee, E. Hucteau, J. Mallard, P. L. Navarro, B. V. Popescu, E. Thomas, D. Kryza, J. Sidi-Boumedine, G. Ferrauto, E. Gianolio, G. Fleith, J. Combet, S. Brun, S. Erb, S. Cianferani, L. J. Charbonnière, L. Fellmann, C. Mirjolet, L. David, O. Tillement, F. Lux, S. Harlepp, X. Pivot and A. Detappe, Adv. Mater., 2024, 36(13), 2308738 CrossRef PubMed.
- P. Nanni, C. de Giovanni, P. L. Lollini, G. Nicoletti and G. Prodi, Clin. Exp. Metastasis, 1983, 1(4), 373–380 CrossRef CAS PubMed.
- E. Terreno, J. Stancanello, D. Longo, D. Delli Castelli, L. Milone, H. M. H. F. Sanders, M. B. Kok, F. Uggeri and S. Aime, Contrast Media Mol. Imaging, 2009, 4(5), 237–247 CrossRef CAS PubMed.
Footnotes |
| † Electronic supplementary information (ESI) available. See DOI: https://doi.org/10.1039/d4tb00358f |
| ‡ These authors have contributed equally. |
| This journal is © The Royal Society of Chemistry 2024 |

