
 Open Access Article
 This Open Access Article is licensed under a
 Creative Commons Attribution 3.0 Unported Licence
Quantitative multiplexing of uric acid and creatinine using polydisperse plasmonic nanoparticles enabled by electrochemical-SERS and machine learning†
Tabitha
Jones
 ab,
Deyue
Zhou
ab,
Jia
Liu
ab,
Ivan P.
Parkin
a and
Tung-Chun
Lee
*ab
ab,
Deyue
Zhou
ab,
Jia
Liu
ab,
Ivan P.
Parkin
a and
Tung-Chun
Lee
*ab
aDepartment of Chemistry, University College London, London, WC1H 0AJ, UK. E-mail: tungchun.lee@ucl.ac.uk
bInstitute for Materials Discovery, University College London, London, WC1H 0AJ, UK
First published on 1st October 2024
Abstract
Surface-enhanced Raman spectroscopy (SERS) is a promising technique for the detection of biomarkers, but it can struggle to quantify multiple analytes in complex fluids. This study combines electrochemical SERS (E-SERS) and machine learning for the quantitative multiplexed detection of uric acid (UA) and creatinine (CRN). Using classical polydisperse Ag nanoparticles (NPs) made by scalable synthesis, we achieved quantitative multiplexing with low limits of detection (LoDs) and high prediction accuracy, comparable to those made by sophisticated approaches. The E-SERS LoDs at the optimal applied potentials were 0.127 μM and 0.354 μM for UA and CRN respectively, compared to 0.504 μM and 1.02 μM for conventional SERS (recorded at 0 V). By collecting a multi-dimensional E-SERS dataset and applying a two-step partial least squares regression – multilayer perceptron (PLSR-MLP) machine learning algorithm, we were able to identify the analyte concentrations in unseen spectra with a prediction accuracy of 0.94. This research demonstrates the potential of E-SERS and machine learning for multiplexed detection in clinical settings.
Introduction
The detection of biomarkers has emerged as an essential part of disease diagnosis, monitoring and treatment.1 Bodily fluids, such as urine, blood, and saliva, contain a plethora of different biomarkers, which can be used to give a holistic understanding of a patient's health.2 Therefore, the simultaneous measurement of different biomarkers, known as multiplexed detection, is extremely desirable. Multiplexed detection of biomarkers is possible with advanced analytical methods, such as mass spectrometry and high-performance liquid chromatography, but these techniques are time-consuming and require expensive lab-based equipment.3,4 Simpler, cheaper detection methods, for example, colourimetric assays or lateral flow tests, typically struggle to detect more than one analyte at the same time, especially for small molecules.5,6 As such, there is a need for rapid, cost-effective sensors which can quantitatively detect multiple biomarkers.Surface-enhanced Raman spectroscopy (SERS) is an analytical technique which can selectively detect low concentrations of biomarkers.7 In SERS, the Raman signal of a molecule is significantly enhanced when it is adsorbed onto a nanostructured noble-metal surface, allowing analyte molecules to be identified by their vibrational fingerprints.8 It is a promising technique due to its sensitivity, selectivity, and ease-of-use. However, multiplexed quantification can be difficult in complex media due to the competitive adsorption of analytes on the SERS substrate and the overlapping of characteristic peaks.
In electrochemical SERS (E-SERS), the SERS substrate acts as the working electrode in a three-electrode electrochemical cell, allowing SERS spectra to be recorded under an applied potential.9 The applied potential enhances the SERS signal and boosts multiplexed detection in three ways.10 Firstly, certain molecules will be selectively adsorbed onto an electrode surface at different applied potentials depending on their charge distribution. Consequently, the coverage, adsorption orientation and interaction strength of a target molecule on an electrode can be modulated using the potential.9,11,12 As SERS is a surface-selective effect, this means particular peaks in the SERS spectra can be selectively enhanced by adjusting the applied potential. Secondly, SERS signals can be amplified by charge transfer between the metal and the adsorbed molecule. The likelihood of charge transfer is determined by the Fermi level of the metal.9 Changing the potential of an electrode alters the Fermi level, which can increase the probability of charge transfer and enhance the SERS signal.12,13 Lastly, the primary reason for conventional SERS enhancement is localized surface plasmon resonance (LSPR) in the metal nanoparticles which generates large localized electric fields around the nanostructure.14 When a negative potential is applied to an electrode, the electron density in the nanostructure will rise, increasing the magnitude of the LSPR, and boosting the SERS signal.9,10
The relative importance of these three phenomena depends on the system and is still being fully understood. Nevertheless, E-SERS shows significant promise for addressing critical challenges in SERS sensing. Its capability to control the adsorption of molecules on the substrate reduces competitive adsorption and enables the resolution of complex spectra. E-SERS has already demonstrated improved detection of a variety of analytes, including therapeutic drugs,15,16 biomarkers17,18 and food contaminants.19–22 However, very few of these studies demonstrate quantitative detection. Reliable quantitative measurements rely on robust, repeatable nanostructured electrodes which can be difficult to fabricate. Issues also arise due to the complex nature of the E-SERS system, in particular, the important part surface adsorption plays. Nonetheless, there are examples of successful quantitative detection of a single analyte.
To our knowledge, quantitative detection of multiple analytes using E-SERS has not been reported and is likely to be difficult without additional functionalities within the system. Machine learning (ML) for SERS analysis is growing rapidly, with techniques such as partial least squares regression (PLSR), and artificial neural networks (ANNs) being employed to recognise subtle patterns in SERS datasets and identify the presence or concentration of analytes in unseen spectra. ML approaches have been used to classify or quantify biomarkers,15,18,20,23–25 bacteria,26,27 and food products.28,29 In addition to improving interpretation, it reduces the need for time-consuming visual inspection of SERS spectra by trained operators, increasing the practicality of SERS as an analytical technique. Machine learning has recently been used for E-SERS classification of fentanyl-related compounds,30 but it is yet to be applied to quantitative E-SERS. However, the additional complexity within the datasets, which comes from the applied potential, makes it an ideal application for these techniques.
Uric acid (UA) is the end product of purine metabolism and is an important biomarker for preeclampsia in pregnant women,31,32 gout and cardiovascular disease.33,34 Creatinine (CRN) is a vital indicator of kidney filtration function in renal clearance tests.35,36 Herein, we report the quantitative multiplexed detection of UA and CRN using E-SERS and machine learning. The biomarkers are detected using drop-cast polydisperse Ag NPs SERS electrodes which are quick to make and require no specialist nanofabrication equipment. We achieve quantitative multiplexing with low limits of detection (LoDs) and high prediction accuracy, comparable to those made by sophisticated approaches (Tables S1 and S2, ESI†). Applying a potential to the SERS electrodes resulted in significant enhancement of the Raman signal of these analytes and enabled lower concentrations to be detected compared to conventional SERS. The E-SERS LoDs at the optimal applied potentials were 0.127 μM and 0.354 μM for UA and CRN respectively, compared to 0.504 μM and 1.02 μM for conventional SERS (recorded at 0 V). Notably, the SERS intensities of UA and CRN exhibit different potential dependence, which allows us to construct a meaningful multi-dimensional E-SERS dataset. Subsequently, a two-step PLSR-MLP machine learning algorithm was applied to interpret the complex E-SERS dataset. Using this approach, we were able to identify the analyte concentrations in unseen spectra with a prediction accuracy of 0.94. Finally, proof-of-concept experiments were performed to demonstrate the detection of clinically relevant concentrations of UA and CRN in dilute synthetic urine.
Experimental section
Fabrication of Ag NP electrodes
To fabricate solid SERS electrodes, colloidal Ag NP solution was concentrated and then drop-cast onto APTES-coated FTO-coated glass electrodes (refer to ESI† for additional details). 1 mL aliquots of the Ag NP solution were added to 1.5 mL Eppendorf tubes and each tube was centrifuged at 3600 rpm for 15 minutes. The supernatant was removed and discarded, and another aliquot of the colloidal solution was added. This was repeated 10 times. After the solution was centrifuged for the 10th time, almost all the supernatant was removed, leaving ∼0.03 mL of concentrated Ag NP solution. The concentrated Ag NP solution was drop-cast onto the APTES-coated FTO-coated glass electrodes in three successive 10-μL aliquots, resulting in a Ag NP film which was approximately 0.5 cm in diameter. The substrate was then left to dry overnight before use.Instrumentation
The Raman spectra were recorded using an Ocean Optics QE Pro-Raman system with a 633 nm He–Ne laser (power ca. 22 mW). The detector was a 1044 × 64-element TE-cooled CCD array, and the spectrometer had a 50 μm slit and a 1200 lines per mm grating. An InPhotonics RPB Raman fibre optic probe, with a numerical aperture of 0.22 and a working distance of 7.5 mm, was used. The laser spot size was approximately 4 μm. The spectra were obtained from 10 scans with an acquisition time of 7 s. Asymmetric least squares (ALS) baseline correction was used to remove the fluorescence background in the SERS spectra.37To perform E-SERS, an electrochemical potential was applied to the SERS substrate using a Gamry Potentiostat Interface 1010E and a three-electrode electrochemical cell which consisted of a leakless Ag/AgCl reference electrode, a platinum plate counter electrode, and the SERS substrate as the working electrode. 0.1 M NaF(aq) was used as the supporting electrolyte for all experiments.
All the E-SERS experiments were performed inside a custom-built cell. The cell was 3D printed from polylactic acid and contains a window made of quartz glass, which allows SERS measurements to be performed whilst applying an electrochemical potential to the substrate enabling the acquisition of E-SERS spectra.
During the E-SERS scans, the Gamry Framework Sequence Wizard was used to control the potential applied to the SERS substrate. The sequence wizard was programmed to perform successive chronoamperometry experiments, where the potential of the working electrode is stepped to a specific value (relative to the reference electrode) and the resulting current is recorded as a function of time. The potential was held for six minutes to allow multiple SERS spectra to be recorded before the next potential was applied. The spectra recorded in the first 75 seconds are discarded to allow the current to reach a stable value. When a Ag NP electrode was first placed in the electrolyte, a full potential scan (from 0 V to +0.4 V to −0.8 V) was performed to allow the electrode to equilibrate and remove adsorbed citrate ions from the electrode surface.
For some E-SERS experiments, spectra for multiple different analyte concentrations were recorded using the same electrode. To do this, a full E-SERS scan was performed at the lowest analyte concentration. Then, stock solution of the analyte was added to the electrolyte to increase the overall concentration, whilst keeping the concentration of the supporting electrolyte and other molecules the same. The electrolyte was mixed well, and the electrode was left in the solution to equilibrate before performing the next E-SERS scan.
Synthetic urine (SU) which did not contain UA or CRN was prepared according to the literature with modifications.38,39 For 200 mL of SU, 2 g of urea, 1.04 g of NaCl, 0.9 g of KCl, 0.96 g of NaH2PO4, 0.08 g of citric acid, and 10 mg of albumin were dissolved in 200 mL of deionized water.
Machine learning
The E-SERS dataset consisted of 2348 spectra of solutions containing UA (0–100 μM) and CRN (0–1000 μM) recorded at applied potentials between −0.8 V and 0.4 V, which were randomly split into training (80%) and test (20%) datasets. Three machine learning approaches were investigated: partial least squares regression (PLSR), a multilayer perceptron (MLP) and a two-step PLSR-MLP algorithm which combined the two approaches.PLSR is a well-established multivariate regression technique related to principal component analysis (PCA).40,41 It is a supervised machine learning approach which is particularly suited to noisy data that contains many collinear predictor variables and one or more response variables. In PLSR, the dimensionality of the predictor (X) variables is reduced by finding new latent variables which best describe the variation in the response (Y) variables.41 The new variables are linear functions of those in the original dataset, with each variable successively increasing the total variance explained by the latent variables.
MLPs are a simple class of feed-forward artificial neural networks. They consist of connected nodes called artificial neurons, which take in multiple inputs and compute a single output value. MLPs contain at least three layers of neurons: an input layer, one or more hidden layers and an output layer.42 Each neuron in one layer is connected to every neuron in the following layer.42 Initially, the connections between neurons are assigned random weights.43 When the network is presented with a training dataset, back-propagation is used to iteratively adjust the weights to reduce the difference between the output results and the actual results.42,43 This process is repeated until the error is below an acceptable level. The resulting trained network can then be used to determine the output for a new unseen input dataset.
In the two-step PLSR-MLP algorithm, PLSR is used to reduce the dimensionality of the SERS spectra, and then the new latent variables are combined with the applied potential to create the input layer for the MLP. For the PLSR, the dataset (excluding the applied potentials) is split into a m × n X matrix and a p × n Y matrix where n is the number of spectra, m is the number of wavenumber shifts in the SERS spectra after pre-processing (360, from 500–1800 cm−1, equally spaced) and p is the number of analytes, which is 2.41 The dimensionality of the X matrix is then reduced to a specified number of latent variables (k) which best describes the variance in the Y matrix. The result is a k × n T matrix. The T matrix is then combined with the applied potential to create a (k + 1) × n T + P matrix. The T + P matrix is the input layer for the MLP which is used to make the concentration predictions. Further details of the data processing and machine learning can be found in the ESI.†
Results and discussion
Ag NPs were synthesised in a scalable fashion (here, ca. 20 mg per batch) via a facile citrate reduction based on the Lee and Meisel method. The UV-visible (UV-vis) spectrum of the as-synthesised Ag NPs showed a LSPR peak at ca. 434 nm (Fig. 1b).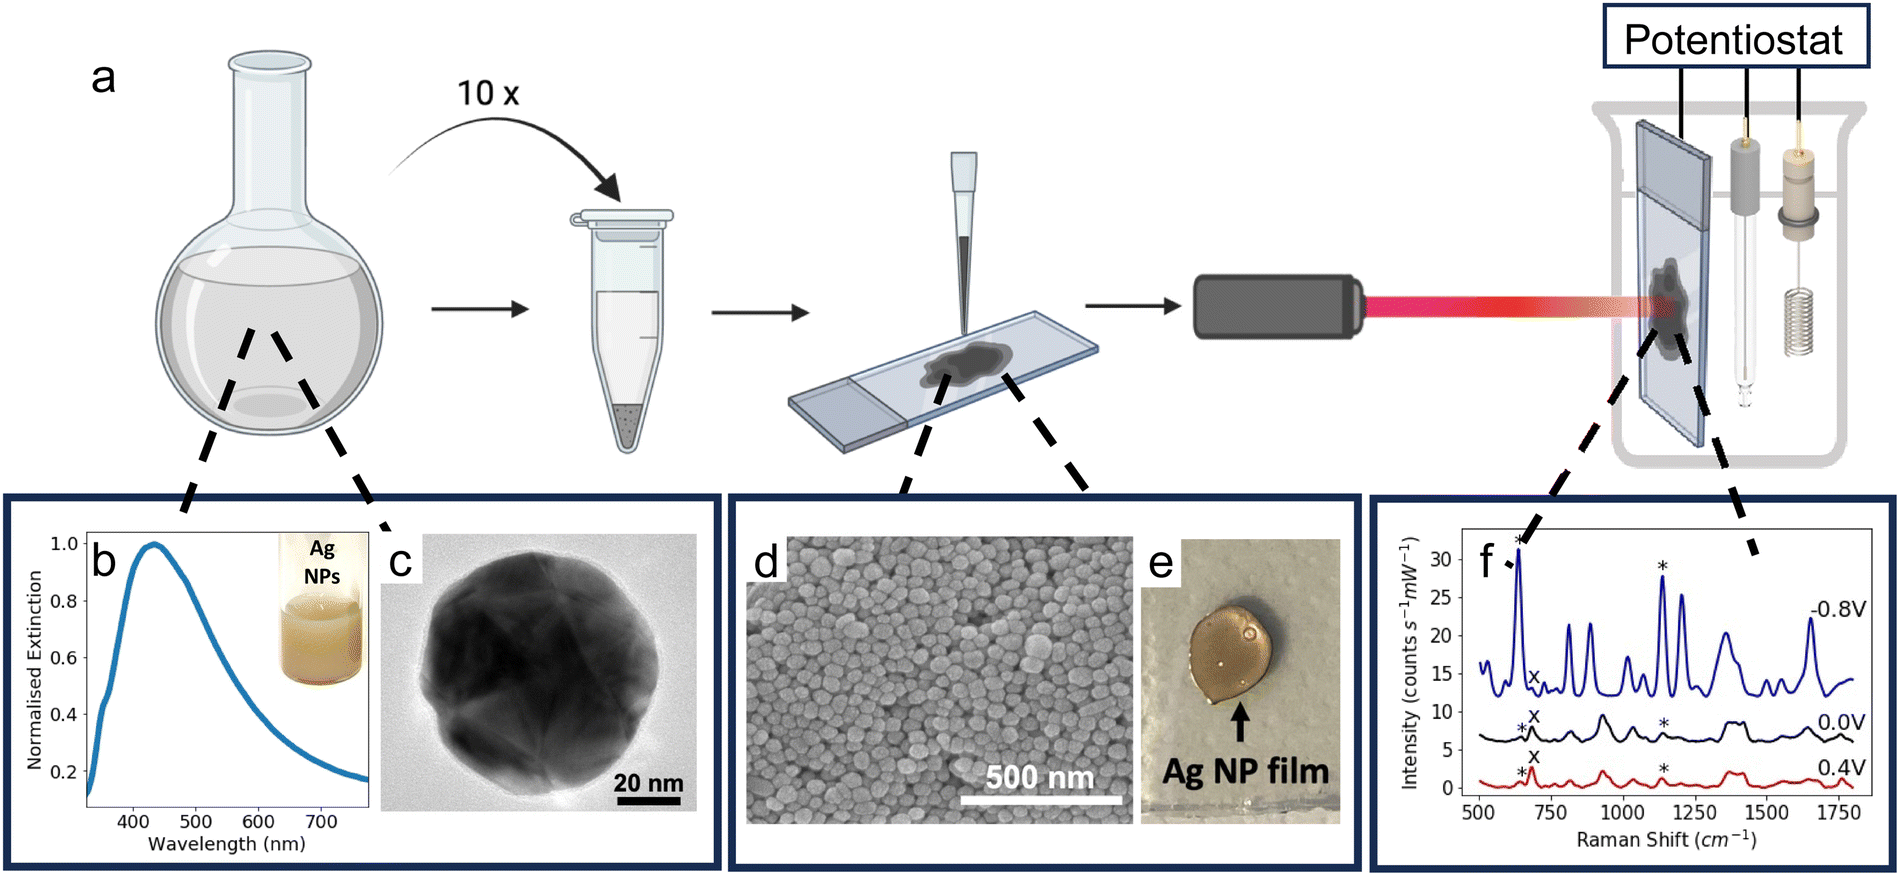 | ||
| Fig. 1 (a) Schematic diagram showing the fabrication process of the SERS-active electrodes. Colloidal Ag NPs are synthesised and then concentrated using centrifugation. The concentrated Ag NP solution is drop-cast onto APTES-coated FTO-coated electrodes. E-SERS measurements are performed inside a 3-electrode electrochemical cell with the Ag NP electrode acting as the working electrode and SERS substrate. (b) UV-vis spectra of Ag NPs plotted with normalised extinction. (Inset) Photograph of colloidal Ag NP solution. (c) TEM image of a Ag NP. (d) SEM image of Ag NP film on APTES-coated FTO-coated glass. (e) Photograph of Ag NP electrode. (f). Representative E-SERS spectra of a solution containing 0.05 mM UA and 0.1 mM CRN in 0.1 M NaF. The characteristic UA and CRN peaks are indicated with a* and × respectively. (RE: Ag/AgCl; WE: Ag NPs on FTO; CE: platinum plate; supporting electrolyte: 0.1 M NaF). | ||
Transmission electron microscopy (TEM) confirmed the formation of polydisperse Ag NPs (Fig. 1c). The NPs were quasi-spherical with some rods and trapeziums also present, which is typical for Ag NPs synthesised using the Lee and Meisel method (Fig. S1, ESI†).44 ImageJ was used to manually measure the area of 1026 particles from TEM images and the diameter of each particle was calculated by assuming the particles were spherical. The mean diameter calculated in this way was 79 ± 25 nm.
The Ag NP electrodes were fabricated by drop-casting a concentrated colloidal solution of Ag NPs (ca. 230 mg mL−1) onto conductive APTES-coated FTO-coated glass (Fig. 1a). The APTES coating improves the adhesion of the Ag NPs to the glass. The APTES molecules bond to the surface of the glass via their hydrolysable alkoxy groups and the exposed amino groups interact electrostatically with the surface of the Ag NPs.45 The coating also increases the hydrophobicity of the glass, resulting in more controlled drop-casting, yielding smaller, more uniform compact-layer NP films (Fig. 1e). Scanning electron microscope (SEM) images of the substrate showed a densely packed compact layer of NPs (Fig. 1d).
The Ag NP electrodes were used to record E-SERS spectra of an aqueous solution containing 0.5 mM UA and 0.1 M NaF. The SERS spectra were recorded using a 633 nm, 22 mW laser with an integration time of 7 s. The applied potential was stepped from 0 to 0.5 V and from 0 to −0.8 V in 100 mV increments. When the applied potential is more negative than −0.8 V, the Ag NP film becomes detached from the FTO-coated glass. The characteristic UA peaks at 636 cm−1 and 1138 cm−1, which are attributed to skeletal ring deformation and C–N deformation respectively, were identified in the initial spectra recorded at 0 V (Fig. 2a).17,46,47 As the applied potential becomes more negative, the magnitude of the SERS peaks increase, reaching a maximum at −0.8 V (Fig. 2a). In contrast, the magnitude of the SERS peaks decrease as the applied potential becomes more positive. Although the peak intensities change with potential, the position of the peaks remains constant, and no significant new peaks are observed (Fig. S4, ESI†).
 | ||
| Fig. 2 (a) E-SERS spectra of a 0.5 mM UA solution at 0 V and −0.8 V. The characteristic UA peaks are indicated with a*. (b) The height of the characteristic UA peak at 1138 cm−1 plotted against applied potential. (c) E-SERS spectra of a 0.5 mM CRN solution at 0 V and 0.4 V. The characteristic CRN peaks are indicated with an x. (d) The height of the characteristic CRN peak at 684 cm−1 plotted against applied potential. (RE: Ag/AgCl; WE: Ag NPs on FTO; CE: platinum plate; supporting electrolyte: 0.1 M NaF). | ||
The height of the characteristic UA peak at 1138 cm−1 is plotted against applied potential in Fig. 2b. The dramatic increase in the magnitude of the SERS peak with negative applied potential is clearly shown. The magnitude of the 1138 cm−1 peak increases by over 7 times from 3.7 to 26.7 counts s−1 mW−1 demonstrating the advantage offered by E-SERS over conventional SERS. The prominent peaks observed at −0.8 V likely result from a combination of factors, including increased surface adsorption of the UA molecules, increased electron density within the nanoparticles, and the desorption of citrate ions from the Ag NP surface facilitating additional UA adsorption.18,48
E-SERS spectra of a 0.5 mM CRN solution were recorded in the same way as the UA spectra (Fig. 2c). At 0 V, the characteristic CRN peak, attributed to N–H bending, is observed at 684 cm−1.49,50 As the applied potential becomes more positive, the magnitude of this SERS peak starts to increase, reaching a maximum at 0.4 V and then decreasing. During cathodic stepping, the magnitude of the 684 cm−1 peak, increases up until −0.3 V and then starts to decrease. At negative potentials, new peaks are recorded at 608 cm−1 and 863 cm−1 and the characteristic peak at 1421 cm−1 starts to move to higher Raman shifts (Fig. S5, ESI†).
The two maxima in Fig. 2d and additional peaks observed at the negative potentials illustrate the complex interaction between the different types of enhancement in the E-SERS system. At 0.4 V, the adsorption of the CRN molecules on the Ag NPs may be at its peak, which would account for the large SERS peaks. Conversely, the negative applied potentials increase the electron density, resulting in larger LSPR and potentially explaining the second maximum at −0.3 V. The additional peaks and peak shifts observed at the negative potentials could be due to changes in surface adsorption or tautomerism. CRN has two pKa values at 4.8 (imidazolidinone ring nitrogen) and 12.7 (amino group),51 and multiple tautomeric forms. The complex enhancement trend may result from changes in the orientation of the adsorbed CRN molecules due to the presence of functional groups with different dipole moments,11 and/or a shift in tautomeric position.52
To achieve our aim of quantitative multiplexed detection, the Ag NP electrodes must exhibit reliable SERS enhancements across and between electrodes. The drop-cast fabrication method is simple, quick, and cost-effective. However, the electrodes do exhibit some variability (Fig. S6, ESI†) due to the uncontrolled NP spacing, the polydispersity of the colloidal Ag NPs and the oxidation of the silver (Fig. S7, ESI†). To mitigate the issue of variability without increasing the complexity of the electrode fabrication method, an internal standard can be used. In this approach, a known concentration of a molecule is added to every sample that is analysed and the height of the characteristic peak of that molecule is used to normalise the spectra.7,53,54 The key requirements for SERS internal standards are that they are strong Raman scatterers, their SERS peaks do not overlap with the characteristic peaks of the target analytes and their adsorption does not interfere with the adsorption of the target analytes. For these reasons, Rhodamine 6G (R6G) was chosen which has been used successfully as an internal standard for SERS previously55 and has been studied extensively.54,56
The E-SERS spectra for a 10 μM R6G and 0.1 M NaF solution recorded using a Ag NP electrode are shown in Fig. S8 (ESI†). The R6G exhibits strong E-SERS peaks. The largest peak at 1362 cm−1 (assigned to C–C stretching in the xanthene ring15) was used as the reference peak for normalisation. The magnitude of the R6G peaks varies with applied potential (Fig. S9, ESI†), with the largest peaks being observed at 0 V and smaller peaks present at the greater applied potentials. This is likely due to the adsorption of the R6G molecules onto the charged surface. Since this behaviour is consistently observed, R6G can still serve as an effective internal standard for comparing spectra recorded at the same potentials in different solutions. For solutions containing UA, CRN and R6G, the analyte characteristic peaks are small relative to the R6G peaks but still clearly visible (Fig. S10, ESI†).
To assess whether the R6G has helped reduce the variability in the E-SERS measurements, the spectra from three electrodes were normalised using the 1362 cm−1 peak. The height of the characteristic UA peak at 636 cm−1 was extracted from each normalised spectra and the mean and standard deviation were calculated for the three electrodes. The standard deviation as a percentage of the mean peak height is significantly lower for the R6G normalised spectra than the original spectra at all potentials (Fig. S6, ESI†). This shows that using R6G as an internal standard can help reduce the variability of the E-SERS measurements without increasing the cost or complexity of the electrodes.
The R6G normalised characteristic peak heights are plotted against applied potential for a range of analyte concentrations, 1–100 μM for UA (Fig. 3a) and 1–1000 μM for CRN (Fig. 3b). It is significantly easier to detect and distinguish between the different concentrations at the optimal applied potentials, −0.8 V for UA and 0.4 V for CRN, than 0 V. Although in some cases, CRN exhibits larger peaks at −0.4 V than at 0.4 V, 0.4 V was chosen as the optimal potential as it is further from the UA optimal potential. The R6G normalised characteristic peak heights are plotted against analyte concentrations at the optimal applied potentials in Fig. S11 (ESI†). A linear relationship is fitted between the UA concentration and the 1138 cm−1 peak height for concentrations from 1 μM to 100 μM (R2 = 0.988) and the log(CRN concentration) and the 684 cm−1 peak height for concentrations from 1 μM to 1000 μM (R2 = 0.902). For both of these plots, the LoD was calculated as 3.3 times the standard error of the slope of the calibration line divided by the slope (i.e. 3.3 σ/S).57 This resulted in a LoD of 0.13 μM for UA and 0.35 μM for CRN. These results are compared to literature reported values in Tables S1 and S2 (ESI†). The LoDs are significantly lower than those reported for drop-cast colloidal Ag NPs previously and are comparable to many of the results achieved by more complex nanofabricated electrodes.
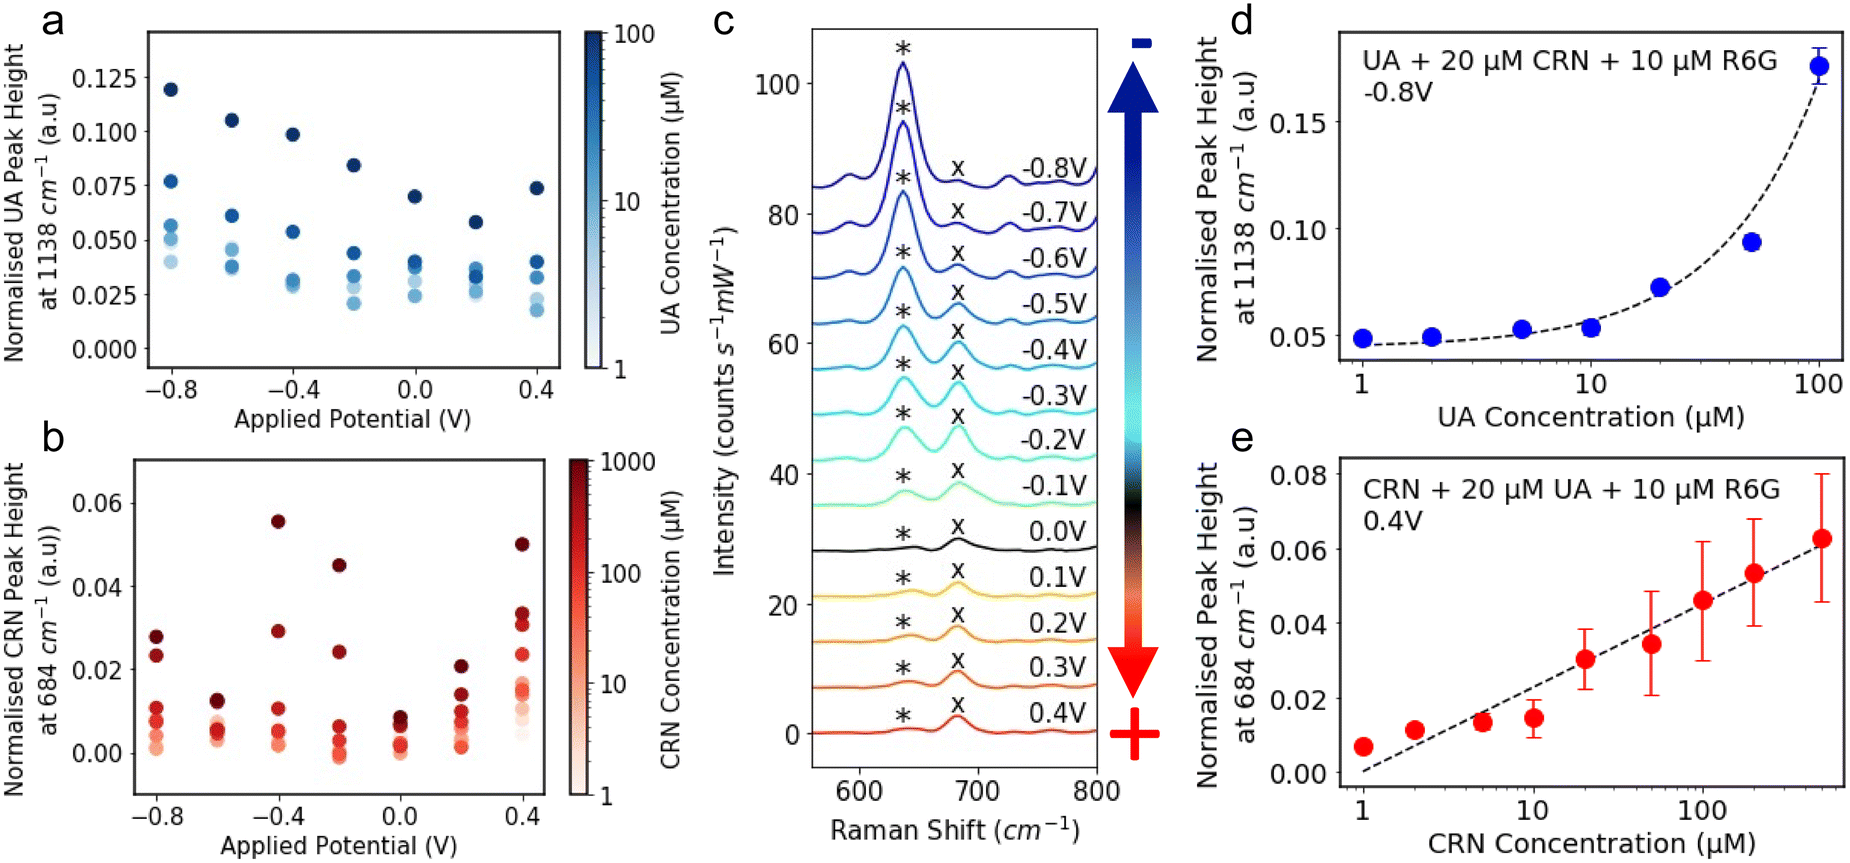 | ||
Fig. 3 The R6G normalised peak height of the characteristic (a) UA peak at 1138 cm−1 and (b) CRN peak at 684 cm−1 plotted against applied potential. The colour of the markers represents the analyte concentration in log-scale. (c) E-SERS spectra of a solution containing 0.05 mM UA, 0.1 mM CRN and 0.1 M NaF plotted between 550 and 800 cm−1. The characteristic UA and CRN peaks are indicated by a* and a× respectively. The applied potential was stepped in the anodic direction from 0 V to 0.4 V and then in the cathodic direction from −0.1 V to −0.8 V in 0.1 V increments. (d) The R6G normalised peak height at 1138 cm−1 plotted against UA concentration for the spectra recorded at −0.8 V for a solution containing 20 μM CRN and 10 μM R6G. A linear relationship is fitted between UA concentration and the peak height for concentrations from 1 μM to 100 μM (R2 = 0.987) and plotted on a log![[thin space (1/6-em)]](https://www.rsc.org/images/entities/char_2009.gif) x-axis for readability. Corresponding plots on a linear axis can be found in Fig. S12 (ESI†). (e) The R6G normalised peak height at 684 cm−1 plotted against CRN concentration for the spectra recorded at 0.4 V for a solution containing 20 μM UA and 10 μM R6G. A linear relationship is fitted between log(CRN concentration) and the peak height for concentrations from 1 μM to 1000 μM (R2 = 0.883) and plotted on a logx-axis for readability.(RE: Ag/AgCl; WE: Ag NPs on FTO; CE: platinum plate; supporting electrolyte: 0.1 M NaF). x-axis for readability. Corresponding plots on a linear axis can be found in Fig. S12 (ESI†). (e) The R6G normalised peak height at 684 cm−1 plotted against CRN concentration for the spectra recorded at 0.4 V for a solution containing 20 μM UA and 10 μM R6G. A linear relationship is fitted between log(CRN concentration) and the peak height for concentrations from 1 μM to 1000 μM (R2 = 0.883) and plotted on a logx-axis for readability.(RE: Ag/AgCl; WE: Ag NPs on FTO; CE: platinum plate; supporting electrolyte: 0.1 M NaF). | ||
To demonstrate multiplex detection using E-SERS, spectra were recorded for a 50 μM UA, 100 μM and 0.1 M NaF solution at applied potentials between 0.4 V and −0.8 V (Fig. 1f). In Fig. 3c, the spectra are plotted between 550 and 800 cm−1. This section of the spectra contains characteristic peaks for UA and CRN at 636 cm−1 and 684 cm−1, indicated by a * and a × respectively. The relative magnitudes of the peaks vary with the applied potential, with the CRN peak being dominant at positive and slightly negative potentials and the UA peak overtaking it at more negative potentials. This behaviour can be partly attributed to changes in the analyte adsorption at different applied potentials. In the presence of positive applied potential, the electron-rich basic amino group on CRN will be preferentially adsorbed onto the surface of the Ag NP electrode. In contrast, in the presence of negative applied potential, a UA molecule will preferentially bind onto the Ag NP electrode surface with its ionisable proton acting as a bridge. This showcases how particular analytes can be selectively enhanced through the application of potential, and illustrating the advantage E-SERS has over conventional SERS for multiplexed detection.
E-SERS scans were performed in a solution containing 20 μM CRN, 10 μM R6G and 0.1 M NaF. The UA concentration was increased from 0 μM to 100 μM. All the spectra recorded were normalised using the characteristic R6G peak at 1362 cm−1 and the peak height at 1138 cm−1 at −0.8 V is plotted against UA concentration in Fig. 3d. A linear relationship is fitted between UA concentration and the peak height for concentrations from 1 μM to 100 μM (R2 = 0.987). It is difficult to distinguish between concentrations up to 5 μM but concentrations above 10 μM can be clearly differentiated.
The same approach was used for a solution with 20 μM UA and CRN concentrations from 0 μM to 1000 μM. The peak height at 684 cm−1 at 0.4 V is plotted against CRN concentration in Fig. 3e. A linear relationship is fitted between log(CRN concentration) and the peak height for concentrations from 1 μM to 1000 μM (R2 = 0.883). The CRN peak is clearly identified for all solution concentrations down to 1 μM. However, these results were measured by varying the concentration of only one of the analytes. A much larger dataset is needed to evaluate the multiplex detection capability of the system.
To create the multiplexed E-SERS dataset, spectra were recorded for solutions containing between 0–100 μM UA and 0–1000 μM CRN. All solutions also contained 10 μM R6G and 0.1 M NaF and were recorded using the Ag NP electrodes. The applied potential was scanned from 0 V to 0.4 V to −0.8 V in increments of 0.2 V and the potential was held for 6 minutes to allow multiple SERS spectra to be recorded before the next potential was applied. Spectra were recorded using 20 different electrodes from 86 unique concentration combinations. In total, the dataset contained 2348 spectra.
Despite some encouraging results for the multiplexed detection, significant variation was observed when comparing the spectra recorded with different electrodes and concentration combinations. Conventional quantitative detection focuses on a single characteristic peak, disregarding valuable information present in the rest of the SERS spectra that can aid in identifying the analyte concentration. Machine learning algorithms, on the other hand, leverage the entire spectra to identify subtle patterns and make more accurate predictions. This is a particularly effective approach in complex, multi-analyte solutions. Using a simple linear regression model based on the normalised characteristic peaks at the optimal potentials, the prediction accuracies were 0.257 and 0.018 for UA and CRN respectively. Clearly, this is unacceptably low, and a different approach is needed to improve the prediction accuracy.
First, PLSR was investigated. When employing a PLSR model, it is important to choose the number of components carefully to avoid over or under-fitting. The optimal number of components was found by performing PLSR on the training dataset with 1 to 31 components, and the R2 was calculated using 5-fold cross-validation. The cross-validated R2 starts to plateau above 14 components, so to avoid overfitting, 14 components were used for the PLSR model. The overall R2 value for the predictions made by the 14-component PLSR model with the test dataset was 0.72. This is a significant improvement on the simple linear regression model and clearly shows the benefit of utilising the entire SERS spectra.
Next, an MLP algorithm was tested. A Bayesian optimiser using Gaussian processes was employed to determine the hidden layer architecture for the MLP (ESI,† Section S1.3). This was found to be 2 hidden layers with 16 and 32 nodes, respectively. This hidden layer architecture was used to build an MLP which was trained on the training set and then used to predict the analyte concentrations from the unseen spectra in the test dataset. The overall prediction accuracy (R2) for the two analytes was 0.75.
In an attempt to combine the merits of the PLSR and MLPs, a two-step algorithm was devised. In this approach, PLSR is used to reduce the dimensionality of the SERS spectra, and then the new latent variables are combined with the applied potential to create the input layer for the MLP. For the PLSR, the dataset (excluding the applied potentials) is split into a m × n X matrix and a p × n Y matrix where n is the number of spectra, m is the number of wavenumber shifts in the SERS spectra after pre-processing (360, from 500–1800 cm−1, equally spaced) and p is the number of analytes, which is 2.41,58 The dimensionality of the X matrix is then reduced to a specified number of latent variables (k) which best describes the variance in the Y matrix. The result is a k × n T matrix. The T matrix is then combined with the applied potential to create a (k + 1) × n T + P matrix. The T + P matrix is the input layer for the MLP which is used to make the concentration predictions. The two-step PLSR-MLP algorithm is illustrated in Fig. 4a.
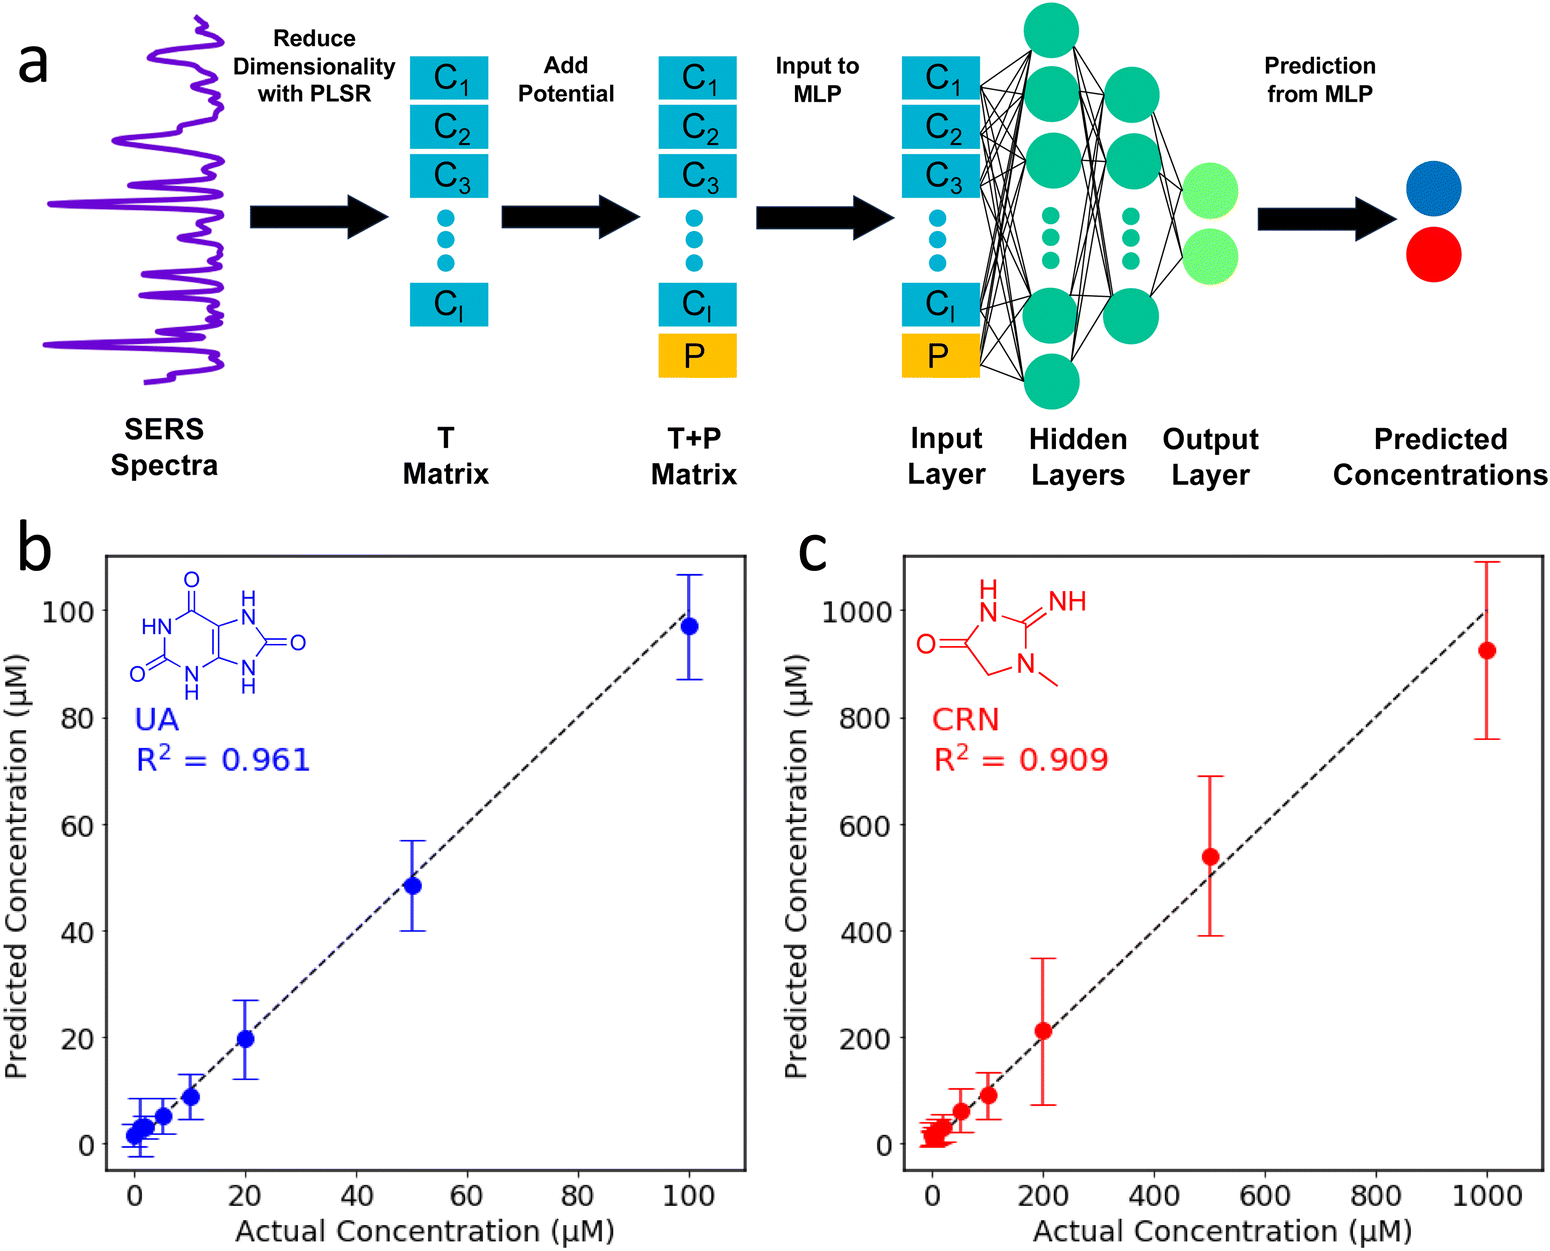 | ||
| Fig. 4 (a) Schematic diagram illustrating the two-step PLSR-MLP algorithm which was used to predict the UA and CRN concentrations from unseen E-SERS spectra. (b) A comparison of the actual concentrations and the concentrations predicted by the two-step PLSR-ANN model for the test dataset for (b) UA and (c) CRN. The dotted y = x line represents perfect agreement between the actual and predicted concentrations. | ||
As with the MLP, a Bayesian optimiser using Gaussian processes was employed to determine the number of latent variables for the PLSR and the hidden layer architecture for the MLP (ESI†). When selecting the hyperparameters for ML, it is important to avoid overfitting. The test dataset was selected and removed at the beginning, and then 5-fold cross-validation was used to find the optimal parameters using the remaining data. The optimal parameters identified by the Bayesian optimiser (44 PLSR components and an MLP hidden layer architecture of (32, 32, 32)) were used to construct the two-step PLSR-MLP algorithm. The prediction accuracy (R2) was 0.94. The predicted concentrations are plotted against the actual concentrations in Fig. 4b and c and the points are very close to the y = x line, indicating excellent prediction accuracy. The R2s for UA and CRN were 0.96 and 0.91, respectively (Fig. 4b and c). The prediction accuracies for the three ML algorithms tested are compared in Table S3 (ESI†).
To evaluate the effect of the applied potential, the same process was used to build a two-step PLSR-MLP algorithm using only the spectra recorded at 0 V. The prediction accuracy for this dataset was 0.50, which is significantly lower than the 0.94 achieved when all spectra recorded at different potentials are included (Fig. S13, ESI†). Indeed, the fact that the dataset has been shrunk significantly (482 vs. 2348 spectra) will influence the performance of the model, however, the same test was performed using only the spectra recorded at −0.8 V and 0.4 V and they achieved prediction accuracies of 0.92 and 0.86, respectively. This highlights that the benefits offered by E-SERS over SERS in standard spectral analysis also apply when machine learning is used.
The root mean square error of prediction (RMSEP) was also calculated for the two-step PLSR-MLP algorithm. This can be taken as an indication of the limit of detection of the system. The RMSEP was 5.93 μM for UA and 84.7 μM for CRN. These results are comparable to those reported in the literature for single analyte detection of UA and CRN using Ag NP SERS (Tables S1 and S2, ESI†). It is encouraging to see that by combining E-SERS with machine learning, it is possible to achieve similar levels of quantitative detection for multiple analytes. The concentration ranges studied in this work are well within the clinically relevant range for uric acid59,60 and creatinine.60,61 This is beneficial as it means samples could be diluted significantly before testing, minimising any disruption to the Raman signal caused by other analytes in the complex matrix.35
To assess the potential of E-SERS for the detection of UA and CRN in clinical settings, spectra were recorded in synthetic urine (SU). In addition to UA and CRN, the SU contained urea, NaCl, KCl, NaH2PO4, citric acid and albumin. The previous tests had established that the Ag NP electrode/E-SERS system could detect low concentrations of UA and CRN (LoDs of 0.13 μM and 0.35 μM respectively). Therefore, it was possible to dilute the synthetic urine and still record spectra for clinically relevant concentrations of UA and CRN, which reduces the potential for interference from the other molecules in the SU.59–62
In Fig. S14 (ESI†), E-SERS spectra for a 10% SU solution containing 20 μM UA, 1000 μM CRN, 10 μM R6G, and 0.1 M NaF are plotted. This corresponds to urinary UA and CRN concentrations of 0.2 mM and 10 mM, which are within the normal healthy ranges for adults. The characteristic UA and CRN peaks can be clearly identified in the diluted SU E-SERS spectra. There is no major interference from other molecules, although it is possible to identify a peak at 1013 cm−1 which can be attributed to urea. These results show that it is possible to detect clinically relevant concentrations of UA and CRN in dilute synthetic urine using the Ag NP electrode/E-SERS system. This implies that, if a sufficiently large dataset of E-SERS spectra was recorded, it could be possible to train the two-step PLSR-ANN algorithm to quantitively detect clinically relevant concentrations of UA and CRN in urine. However, it is important to note that real urine is significantly more complex than synthetic urine and contains a broader array of components. As a result, interpreting the E-SERS spectra will likely be more challenging, and substrate fouling may become a greater issue. This issue can be partly addressed by pretreatments of clinical samples. For instance, filtration using a common syringe filter (pore size < 0.2 μm) is known to significantly reduce the microbial load. Additionally, to account for the diversity within the general population, an extensive training dataset would be required to effectively train the algorithm.
Conclusion
To summarise, we have demonstrated the quantitative multiplexed detection of uric acid and creatinine through E-SERS and machine learning using Ag NP electrodes fabricated via a simple, scalable process. Applying a potential to the SERS electrodes resulted in significant enhancement of the Raman signal of these analytes and enabled lower concentrations to be detected compared to conventional SERS. The optimal applied potentials, which maximise the adsorption of the biomarkers on the electrode surface, were identified as −0.8 V and 0.4 V for UA and CRN, respectively. At these applied potentials, LoDs of 0.127 μM (UA) and 0.354 μM (CRN) were achieved, compared to 0.504 μM and 1.02 μM for conventional SERS (recorded at 0 V). These LoD are well within the clinically relevant ranges for these biomarkers and match or surpass the performance of more sophisticated SERS substrates that rely on complex nanofabrication techniques (Tables S1 and S2, ESI†). The peaks of both analytes were successfully identified in multiplexed solutions, with the applied potential effectively modulating the spectra and boosting the selectivity of the sensing system. To our knowledge, this is the first demonstration of quantitative, multiplexed detection using E-SERS.A two-step PLSR-MLP machine learning algorithm was developed to interpret the complex E-SERS dataset. This algorithm was able to predict the analyte concentrations of unseen spectra with a prediction accuracy of 0.94. The RMSEP, which can be taken as an indication of the LoD of the system, was 5.93 μM for UA and 84.7 μM for CRN. Finally, proof-of-concept experiments were performed in dilute synthetic urine to demonstrate the detection of clinically relevant concentrations of UA and CRN.
The approaches employed in this work could be used to generate similar E-SERS datasets for an array of biomarkers in urine (or other bodily fluids). These datasets could then be utilised to train two-step PLSR-MLP machine learning algorithms, enabling the precise prediction of analyte concentration in complex solutions. More broadly, this work demonstrates the potential that E-SERS and ML have in trace analyte detection and highlights the benefits they offer over conventional SERS analysis. Combining these advances with portable Raman spectrometers could bring SERS closer to a clinical reality as a fast, cost-effective tool for biomarker detection.
Author contributions
T. J. and T. C. L. conceptualized the study; T. J. and T. C. L. developed the methodology; T. J. conducted the investigation with input from D. Z. and J. L.; T. J. and T. C. L. drafted the original manuscript, while D. Z., J. L. and I. P. contributed to reviewing and editing; T. C. L. and I. P. P. supervised the project and secured funding.Data availability
The data supporting this article have been included as part of the ESI.†Conflicts of interest
The authors declare no competing interests.Acknowledgements
T. J. would like to thank the EPSRC M3S CDT (grant no. EP/L015862/1) for sponsoring her studentship. T. J. and T. C. L. acknowledge Camtech Innovations for their contribution to T. J.'s studentship.References
- R. Etzioni, N. Urban, S. Ramsey, M. McIntosh, S. Schwartz, B. Reid, J. Radich, G. Anderson and L. Hartwell, Nat. Rev. Cancer, 2003, 3, 243–252 CrossRef CAS.
- L. Bravo-Merodio, A. Acharjee, D. Russ, V. Bisht, J. A. Williams, L. G. Tsaprouni and G. V. Gkoutos, Advances in Clinical Chemistry, Elsevier, 2021, vol. 102, pp. 191–232 Search PubMed.
- L. Denoroy, L. Zimmer, B. Renaud and S. Parrot, J. Chromatogr. B, 2013, 927, 37–53 CrossRef CAS.
- C. A. Crutchfield, S. N. Thomas, L. J. Sokoll and D. W. Chan, Clin. Proteomics, 2016, 13, 1 CrossRef.
- P. Yager, G. J. Domingo and J. Gerdes, Annu. Rev. Biomed. Eng., 2008, 10, 107–144 CrossRef CAS.
- K. M. Koczula and A. Gallotta, Essays Biochem., 2016, 60, 111–120 CrossRef.
- J. Langer, D. Jimenez de Aberasturi, J. Aizpurua, R. A. Alvarez-Puebla, B. Auguié, J. J. Baumberg, G. C. Bazan, S. E. J. Bell, A. Boisen, A. G. Brolo, J. Choo, D. Cialla-May, V. Deckert, L. Fabris, K. Faulds, F. J. García de Abajo, R. Goodacre, D. Graham, A. J. Haes, C. L. Haynes, C. Huck, T. Itoh, M. Käll, J. Kneipp, N. A. Kotov, H. Kuang, E. C. Le Ru, H. K. Lee, J.-F. Li, X. Y. Ling, S. A. Maier, T. Mayerhöfer, M. Moskovits, K. Murakoshi, J.-M. Nam, S. Nie, Y. Ozaki, I. Pastoriza-Santos, J. Perez-Juste, J. Popp, A. Pucci, S. Reich, B. Ren, G. C. Schatz, T. Shegai, S. Schlücker, L.-L. Tay, K. G. Thomas, Z.-Q. Tian, R. P. Van Duyne, T. Vo-Dinh, Y. Wang, K. A. Willets, C. Xu, H. Xu, Y. Xu, Y. S. Yamamoto, B. Zhao and L. M. Liz-Marzán, ACS Nano, 2019, acsnano.9b04224 Search PubMed.
- E. C. Le Ru and P. G. Etchegoin, Principles of surface-enhanced Raman spectroscopy: and related plasmonic effects, Elsevier, Amsterdam; Boston, 1st ed., 2009 Search PubMed.
- D.-Y. Wu, J.-F. Li, B. Ren and Z.-Q. Tian, Chem. Soc. Rev., 2008, 37, 1025 RSC.
- T. Jones, Mater. Sci. Technol., 2023, 1–15 Search PubMed.
- K. A. Willets, Curr. Opin. Electrochem., 2019, 13, 18–24 CrossRef CAS.
- N. Oyamada, H. Minamimoto and K. Murakoshi, J. Phys. Chem. C, 2019, 123, 24740–24745 CrossRef CAS.
- L. Zhou, X. Chen, G. Ren, L. Chen, W. Xu, C. Gu, W. Zhang, Y. Li, Z. Tian, J. Zhou and J. Han, Carbon, 2022, 187, 425–431 CrossRef CAS.
- S. Schlücker, Angew. Chem., Int. Ed., 2014, 53, 4756–4795 CrossRef.
- S. Zaleski, K. A. Clark, M. M. Smith, J. Y. Eilert, M. Doty and R. P. Van Duyne, Anal. Chem., 2017, 89, 2497–2504 CrossRef CAS.
- B. H. C. Greene, D. S. Alhatab, C. C. Pye and C. L. Brosseau, J. Phys. Chem. C, 2017, 121, 8084–8090 CrossRef CAS.
- B. L. Goodall, A. M. Robinson and C. L. Brosseau, Phys. Chem. Chem. Phys., 2013, 15, 1382–1388 RSC.
- L. Zhao, J. Blackburn and C. L. Brosseau, Anal. Chem., 2015, 87, 441–447 CrossRef CAS PubMed.
- D. Ibáñez, A. Pérez-Junquera, M. B. González-García, D. Hernández-Santos and P. Fanjul-Bolado, Talanta, 2020, 206, 120190 CrossRef.
- R. Moldovan, K. Milenko, E. Vereshchagina, B.-C. Iacob, K. Schneider, C. Farcău and E. Bodoki, Food Chem., 2022, 134713 Search PubMed.
- D. Li, D.-W. Li, J. S. Fossey and Y.-T. Long, Anal. Chem., 2010, 82, 9299–9305 CrossRef CAS PubMed.
- L. Chen, R.-Q. Peng, W. Deng, J.-A. Huang and D. Li, Anal. Chem., 2024, 96, 9834–9841 CrossRef CAS.
- Y. Xie, X. Su, Y. Wen, C. Zheng and M. Li, Nano Lett., 2022, 22, 7910–7918 CrossRef CAS PubMed.
- G. Davison, T. Jones, J. Liu, J. Kim, Y. Yin, D. Kim, W. K. Chio, I. P. Parkin, H. Jeong and T.-C. Lee, Adv. Mater. Technol., 2023, 2201400 CrossRef CAS.
- S. M. Sibug-Torres, D.-B. Grys, G. Kang, M. Niihori, E. Wyatt, N. Spiesshofer, A. Ruane, B. De Nijs and J. J. Baumberg, Nat. Commun., 2024, 15, 2022 CrossRef CAS PubMed.
- C.-S. Ho, N. Jean, C. A. Hogan, L. Blackmon, S. S. Jeffrey, M. Holodniy, N. Banaei, A. A. E. Saleh, S. Ermon and J. Dionne, Nat. Commun., 2019, 10, 4927 CrossRef PubMed.
- C. Q. Nguyen, W. J. Thrift, A. Bhattacharjee, S. Ranjbar, T. Gallagher, M. Darvishzadeh-Varcheie, R. N. Sanderson, F. Capolino, K. Whiteson, P. Baldi, A. I. Hochbaum and R. Ragan, ACS Appl. Mater. Interfaces, 2018, 10, 12364–12373 CrossRef CAS.
- W.-I. K. Chio, J. Liu, T. Jones, J. Perumal, U. S. Dinish, I. P. Parkin, M. Olivo and T.-C. Lee, J. Mater. Chem. C, 2021, 9, 12624–12632 RSC.
- O. Alharbi, Y. Xu and R. Goodacre, Anal. Bioanal. Chem., 2015, 407, 8253–8261 CrossRef CAS PubMed.
- T. Cooman, C. E. Ott and L. E. Arroyo, J. Forensic Sci., 2023, 68, 1520–1526 CrossRef CAS PubMed.
- R. J. Johnson, M. Kanbay, D.-H. Kang, L. G.-S. Lozada and D. Feig, Hypertension, 2011, 58, 548–549 CrossRef CAS.
- J. M. Roberts, L. M. Bodnar, K. Y. Lain, C. A. Hubel, N. Markovic, R. B. Ness and R. W. Powers, Hypertension, 2005, 46, 1263–1269 CrossRef CAS PubMed.
- D. I. Feig, D.-H. Kang and R. J. Johnson, N. Engl. J. Med., 2008, 359, 1811–1821 CrossRef CAS PubMed.
- J. M. Fraile, J. G. Puig, R. J. Torres, E. de Miguel, P. Martínez and J. J. Vázquez, Nucleosides, Nucleotides Nucleic Acids, 2010, 29, 330–334 CrossRef CAS.
- W.-I. K. Chio, S. Moorthy, J. Perumal, U. S. Dinish, I. P. Parkin, M. Olivo and T.-C. Lee, J. Mater. Chem. C, 2020, 8, 7051–7058 RSC.
- C. J. Saatkamp, M. L. de Almeida, J. A. M. Bispo, A. L. B. Pinheiro, A. B. Fernandes and L. Silveira, J. Biomed. Opt., 2016, 21, 037001 CrossRef.
- P. H. C. Eilers, Anal. Chem., 2003, 75, 3631–3636 CrossRef CAS.
- J. E. L. Villa and R. J. Poppi, Analyst, 2016, 141, 1966–1972 RSC.
- B. R. Shmaefsky, Am. Biol. Teacher, 1990, 52, 170–172 CrossRef.
- S. Wold, M. Sjöström and L. Eriksson, Chemom. Intell. Lab. Syst., 2001, 58, 109–130 CrossRef CAS.
- P. K. Kreeger, Sci. Signal., 2013, 6, tr7–tr7 Search PubMed.
- F. Lussier, V. Thibault, B. Charron, G. Q. Wallace and J.-F. Masson, TrAC, Trends Anal. Chem., 2020, 124, 115796 CrossRef CAS.
- S. Kasera, L. O. Herrmann, J. del Barrio, J. J. Baumberg and O. A. Scherman, Sci. Rep., 2015, 4, 6785 CrossRef.
- P. C. Lee and D. Meisel, J. Phys. Chem., 1982, 86, 3391–3395 CrossRef CAS.
- R. A. Masitas, I. V. Khachian, B. L. Bill and F. P. Zamborini, Langmuir, 2014, 30, 13075–13084 CrossRef CAS.
- W.-I. K. Chio, G. Davison, T. Jones, J. Liu, I. P. Parkin and T.-C. Lee, JoVE, 2020, 61682 Search PubMed.
- C. Westley, Y. Xu, B. Thilaganathan, A. J. Carnell, N. J. Turner and R. Goodacre, Anal. Chem., 2017, 89, 2472–2477 CrossRef CAS PubMed.
- T. P. Lynk, C. S. Sit and C. L. Brosseau, Anal. Chem., 2018, 90, 12639–12646 CrossRef CAS PubMed.
- K. Karn-orachai and A. Ngamaroonchote, Appl. Surf. Sci., 2021, 546, 149092 CrossRef CAS.
- K. Vikram, S. Mishra, S. K. Srivastava and R. K. Singh, J. Mol. Struct., 2012, 1012, 141–150 CrossRef CAS.
- A. Varshney, M. Rehan, N. Subbarao, G. Rabbani and R. H. Khan, PLoS One, 2011, 6, e17230 CrossRef CAS PubMed.
- J. Gao, Y. Hu, S. Li, Y. Zhang and X. Chen, Chem. Phys., 2013, 410, 81–89 CrossRef CAS.
- S. E. J. Bell and N. M. S. Sirimuthu, Chem. Soc. Rev., 2008, 37, 1012–1024 RSC.
- A. Lorén, J. Engelbrektsson, C. Eliasson, M. Josefson, J. Abrahamsson, M. Johansson and K. Abrahamsson, Anal. Chem., 2004, 76, 7391–7395 CrossRef.
- D. Zhang, Y. Xie, S. K. Deb, V. J. Davison and D. Ben-Amotz, Anal. Chem., 2005, 77, 3563–3569 CrossRef CAS.
- S. Zaleski, M. F. Cardinal, D. V. Chulhai, A. J. Wilson, K. A. Willets, L. Jensen and R. P. Van Duyne, J. Phys. Chem. C, 2016, 120, 24982–24991 CrossRef CAS.
- M. E. Swartz and I. S. Krull, Handbook of Analytical Validation, CRC Press, 2012 Search PubMed.
- L. Eriksson, T. Byrne, E. Johansson, J. Trygg and C. Vikström, Multi- and Megavariate Data Analysis Basic Principles and Applications, Umetrics Academy, 2013 Search PubMed.
- C. S. Buhimschi, E. R. Norwitz, E. Funai, S. Richman, S. Guller, C. J. Lockwood and I. A. Buhimschi, Am. J. Obstet. Gynecol., 2005, 192, 734–741 CrossRef CAS PubMed.
- N. Sarigul, F. Korkmaz and İ. Kurultak, Sci. Rep., 2019, 9, 20159 CrossRef CAS.
- J. Krämer, R. Kang, L. M. Grimm, L. De Cola, P. Picchetti and F. Biedermann, Chem. Rev., 2022, acs.chemrev.1c00746 Search PubMed.
- D. F. Putnam, Composition and concentrative properties of human urine, NASA, 1971 Search PubMed.
Footnote |
| † Electronic supplementary information (ESI) available. See DOI: https://doi.org/10.1039/d4tb01552e |
| This journal is © The Royal Society of Chemistry 2024 |