 Open Access Article
Creative Commons Attribution 3.0 Unported Licence
The influence of PEGylated gold nanoparticles on the solidification of alcohols†
Camino
Martín-Sánchez
 *ab,
Ana
Sánchez-Iglesias
cd,
José Antonio
Barreda-Argüeso
a,
Jesús
González
a and
Fernando
Rodríguez
 a
a
aMALTA Consolider, DCITIMAC, Facultad de Ciencias, University of Cantabria, Av. Los Castros 48, Santander, 39005, Spain. E-mail: Camino.Martinsanchez@unige.ch
bFaculté des Sciences, Départment de Chimie Physique, Université de Genève, 30 Quai Ernest-Ansermet, CH-1211 Genève, Switzerland
cCIC biomaGUNE, Basque Research and Technology Alliance (BRTA), Paseo de Miramón 194, Donostia-San Sebastián, 20014, Spain
dCentro de Física de Materiales (CSIC-UPV/EHU), Paseo Manuel de Lardizabal 5, 20018 Donostia-San Sebastián, Spain
First published on 5th April 2024
Abstract
The effects of PEGylated gold nanoparticles (AuNP) colloidally dispersed in ethanol and methanol–ethanol 4![[thin space (1/6-em)]](https://www.rsc.org/images/entities/char_2009.gif) :
:![[thin space (1/6-em)]](https://www.rsc.org/images/entities/char_2009.gif) 1 on solvent solidification induced by hydrostatic pressure are investigated. We have determined the colloid solidification pressure as a function of gold molar concentration in the 0–12 mM range for three nanoparticle sizes. We show that the solvent solidification pressure does not depend on the AuNP size or its specific surface area. It decreases linearly with the total amount of gold up to a 25% reduction of its initial value. Its dependence on the molar concentration of gold in the colloid correlates with the concentration of PEG-SH molecules. On the other hand, Raman spectroscopy shows that the crystalline solid into which AuNP colloids transform under pressure is the same as that into which pure alcohols transform. In addition, the variation of the AuNP plasmonic resonance with pressure allows us to determine the pressure dependence of the density of ethanol in both its liquid and crystalline phases.
1 on solvent solidification induced by hydrostatic pressure are investigated. We have determined the colloid solidification pressure as a function of gold molar concentration in the 0–12 mM range for three nanoparticle sizes. We show that the solvent solidification pressure does not depend on the AuNP size or its specific surface area. It decreases linearly with the total amount of gold up to a 25% reduction of its initial value. Its dependence on the molar concentration of gold in the colloid correlates with the concentration of PEG-SH molecules. On the other hand, Raman spectroscopy shows that the crystalline solid into which AuNP colloids transform under pressure is the same as that into which pure alcohols transform. In addition, the variation of the AuNP plasmonic resonance with pressure allows us to determine the pressure dependence of the density of ethanol in both its liquid and crystalline phases.
1 Introduction
The ability of gold nanoparticles (AuNP) to be used as nanosensors has been recently probed to investigate the physical properties of the solvent and the AuNP itself under high-pressure conditions.1–6 These studies have shown that the localized surface plasmon resonance (LSPR) spectral shift in gold nanorods (AuNR) and nanospheres (AuNS) colloids can be used to infer the mechanical stiffness of the particles2 and to obtain the variation of the solvent refractive index with pressure.3,4 In addition, AuNP have been proposed as phase transition sensors, in particular, to determine the solidification pressure and solid–solid phase-transition pressures in water, urea, and thiourea.4 However, as pointed out elsewhere,3,6 it is essential to work with diluted AuNP solutions when determining the pressure dependences of the refractive index of a solvent by plasmonic sensing. Within a moderate range of AuNP concentration ([Au] ∼ 1011 cm−3 for AuNR and 1014 cm−3 for AuNS for particle size diameters smaller than about 30 nm), the inferred solvent refractive index is not affected by the presence of AuNP. However, at higher concentrations, nanoparticle aggregation may make them unsuitable for refractive index sensing, even under hydrostatic conditions. Nevertheless, to the best of our knowledge, this discussion has yet to be extended to the influence of AuNP on the solidification point of solvents, although there is experimental evidence2,3 that the AuNP colloids solidify at a different pressure than the pure solvent. Through this work, we demonstrate the unsuitability of AuNP as high-pressure phase transition sensors by showing that the solidification pressure of the solvent is directly affected by the presence of PEGylated AuNP.Here, we report a systematic study of the influence of AuNS on the solidification point of ethanol (EtOH) and methanol–ethanol (MeOH–EtOH) 4![[thin space (1/6-em)]](https://www.rsc.org/images/entities/char_2009.gif) :
:![[thin space (1/6-em)]](https://www.rsc.org/images/entities/char_2009.gif) 1. We chose these alcoholic solvents because the mixed alcohol has the highest solidification pressure among ambient-pressure liquids (ca. 11 GPa),7–10 whereas ethanol has a lower solidification pressure (ca. 2–3 GPa).11 Moreover, these two alcohols allow us to explore the influence of AuNS on two different solidification phenomena: crystallization (EtOH) and vitrification (MeOH–EtOH 4
1. We chose these alcoholic solvents because the mixed alcohol has the highest solidification pressure among ambient-pressure liquids (ca. 11 GPa),7–10 whereas ethanol has a lower solidification pressure (ca. 2–3 GPa).11 Moreover, these two alcohols allow us to explore the influence of AuNS on two different solidification phenomena: crystallization (EtOH) and vitrification (MeOH–EtOH 4![[thin space (1/6-em)]](https://www.rsc.org/images/entities/char_2009.gif) :
:![[thin space (1/6-em)]](https://www.rsc.org/images/entities/char_2009.gif) 1). AuNS colloids with three different particle sizes – diameters of 12, 20, and 28 nm – were investigated in order to determine whether size, specific surface or volume of the AuNP have a relevant effect on the solvent solidification pressure. The solidification pressure (liquid–solid transition) of the three AuNS alcoholic colloids, as determined by the ruby fluorescence lines,10 was studied as a function of the molar concentration of gold along different pressure runs. In addition, we have performed Raman spectroscopy measurements to investigate whether AuNP affect the high-pressure solid phase of alcohols. Here we show that the presence of the AuNP reduces the solidification pressure of the alcohol linearly with the molar concentration of gold up to a 25% reduction of the initial value. Conversely, the crystalline solid into which AuNP colloids transform under high-pressure conditions is the same as that into which pure alcohols transform. These results show that pressure-induced phase transitions (i.e., solidification) can be determined from the variations of the AuNP LSPR, provided that a thorough correction to the solidification point is made using the linear dependencies of Psol with the molar concentration of gold found in this work. Moreover, it confirms the suitability of AuNP as refractive index sensors even in crystallised alcohols obtained by solidification under the application of pressure.
1). AuNS colloids with three different particle sizes – diameters of 12, 20, and 28 nm – were investigated in order to determine whether size, specific surface or volume of the AuNP have a relevant effect on the solvent solidification pressure. The solidification pressure (liquid–solid transition) of the three AuNS alcoholic colloids, as determined by the ruby fluorescence lines,10 was studied as a function of the molar concentration of gold along different pressure runs. In addition, we have performed Raman spectroscopy measurements to investigate whether AuNP affect the high-pressure solid phase of alcohols. Here we show that the presence of the AuNP reduces the solidification pressure of the alcohol linearly with the molar concentration of gold up to a 25% reduction of the initial value. Conversely, the crystalline solid into which AuNP colloids transform under high-pressure conditions is the same as that into which pure alcohols transform. These results show that pressure-induced phase transitions (i.e., solidification) can be determined from the variations of the AuNP LSPR, provided that a thorough correction to the solidification point is made using the linear dependencies of Psol with the molar concentration of gold found in this work. Moreover, it confirms the suitability of AuNP as refractive index sensors even in crystallised alcohols obtained by solidification under the application of pressure.
These structural effects have also been studied through the plasmonic resonances of AuNP using optical extinction spectroscopy. This allowed us to determine the variation of the refractive index and density of ethanol beyond the previously studied pressure limits, which are restricted to the liquid state. Interestingly, the specific volume reduction – the jump in density – obtained at the liquid–solid transition in ethanol is consistent with previous X-ray diffraction data.12,13
2 Methods
2.1 Nanoparticle synthesis
To grow 12 nm gold nanospheres up to 28 nm diameter, an aliquot of 12 nm AuNS solution (2.14 mL, 1 mM) was added under magnetic stirring to a growth solution (100 mL) containing benzyldimethylhexadecylammonium chloride (BDAC, 100 mM), HAuCl4 (0.25 mM), and ascorbic acid (0.5 mM). The mixture was left undisturbed for 30 min at 30 °C, and then washed twice by centrifugation (8000 rpm for 1 h). The particles were finally dispersed in 1 mM CTAB to a final gold concentration equal to 1 mM.
![[thin space (1/6-em)]](https://www.rsc.org/images/entities/char_2009.gif) :
:![[thin space (1/6-em)]](https://www.rsc.org/images/entities/char_2009.gif) 1. PEGylated gold nanoparticles were finally dispersed in the alcoholic solution.
1. PEGylated gold nanoparticles were finally dispersed in the alcoholic solution.
Transmission electron microscopy (TEM) images were obtained with a JEOL JEM-1400PLUS transmission electron microscope operating at an acceleration voltage of 120 kV using carbon-coated 400 square mesh copper grids. UV-Vis optical extinction spectra were recorded using an Agilent 8453 UV-Vis diode-array spectrophotometer. The gold concentration in the colloids was determined by the absorbance at 400 nm, which is assumed to have a size and shape-independent absorption coefficient.17,18 Therefore, a 1.2 value for the absorbance, or equivalently α = 2.76 cm−1 for the absorption coefficient, at 400 nm corresponds to a metallic gold concentration of 0.5 mM.
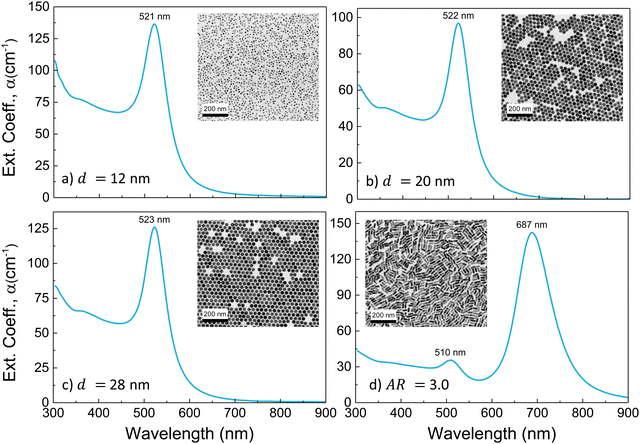
Representative TEM images and extinction spectra of the AuNP colloids employed in the experiments are shown in Fig. 1(a)–(d). The investigated AuNS have average diameters and standard deviations of 12.3 ± 0.3, 19.9 ± 0.3, and 28.2 ± 0.4 nm, and their extinction spectrum shows the characteristic LSPR band centred at 521, 522, and 523 nm, respectively. AuNR have a mean length of l = 39.1 ± 2.3 nm, a mean diameter of d = 13.1 ± 0.5 nm, and an aspect ratio AR = 3.0 ± 0.2 distribution, and the optical spectrum shows the characteristic band structure associated with a transversal LSPR at 510 nm and a longitudinal LSPR (LLSPR) at 687 nm.
2.2 High-pressure measurements
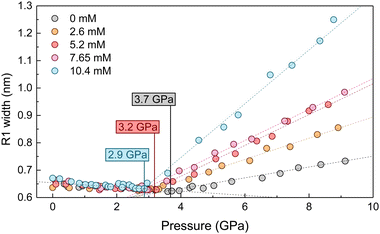
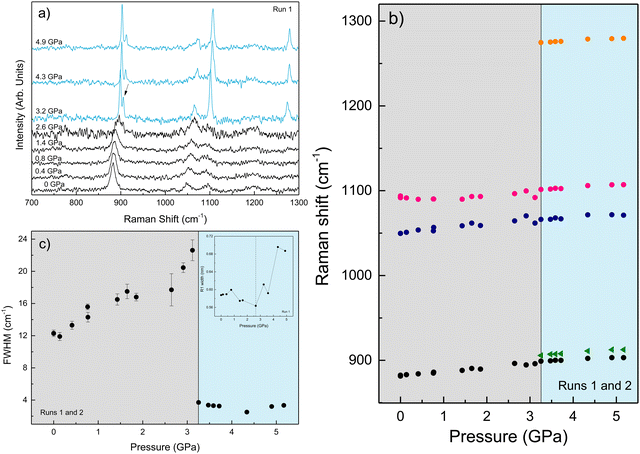
High-pressure experiments were performed in a Boehler-Almax (ruby fluorescence and optical extinction spectroscopy measurements) and a membrane (Raman spectroscopy measurements) diamond anvil cell (DAC) with 350 and 400 μm diamond culet diameters, respectively. The 200 μm thick Inconel 301 gaskets were preindented to 60 μm. The cylindrical pressure chamber was made by perforating a 150 μm diameter hole in the indented gasket using a BETSA motorized electric discharge machine. The diameter of the hydrostatic cavity remained stable in size and shape within 10 μm throughout all pressure runs. The DAC was loaded with high-purity ethanol and methanol mixtures (99.9%) or alcoholic AuNP colloids and several ruby microspheres (≥3 ruby spheres randomly distributed in the pressure cavity) as pressure probes.10 The solution itself acted as the pressure-transmitting medium. The pressure was determined through the ruby R-line emission, the spectral position of which is well calibrated with the pressure, using the recently revised pressure scale.19 In all of the high-pressure experiments carried out, the hydrostatic range, i.e., the determination of the liquid–solid transition pressure of the pressure-transmitting media, was studied by the variation of the ruby photoluminescence spectrum with pressure using two different methods:(1) The pressure-dependence of the ruby R-line broadening, the full width at half maximum (FWHM) of which decreases slightly with pressure in the hydrostatic range.10,20,21 However, it broadens abruptly with increasing pressure in the solidified pressure-transmitting medium (see Fig. 2), where the FWHM increases with pressure and is proportional to the pressure inhomogeneity within the cavity.
(2) The standard deviation σ of the pressures determined from the ruby luminescence of each ruby sphere introduced in the pressure cavity.10 In the hydrostatic range, σ is zero because all rubies are subjected to the same pressure. Once the liquid has solidified, σ increases significantly and is proportional to the pressure inhomogeneity within the cavity. This criterion is more sensitive than the one based on the variation of the FWHM since the line width sometimes shows a smoother variation, thus reducing the pressure accuracy of the solidification point. However, the standard deviation method requires several ruby microspheres in the pressure cavity, which in some cases may interfere with the measurement due to the small size of conventional high-pressure cells. In contrast, the FWHM method can be applied to a single ruby sphere placed outside the center of the cavity.
To determine the variation of the solidification pressure with the AuNS concentration, we have measured the pressure dependence of the ruby photoluminescence in AuNS colloidal dispersions – AuNS diameter of 12, 20, and 28 nm – at five different gold molar concentrations for each colloid. We performed three measurement runs for each concentration (see Tables S1–S3 in the ESI†).
The ruby photoluminescence spectra were obtained in a prototype spectrometer described elsewhere.22 The ruby was excited with a 405 nm diode laser, keeping the incident laser power below 0.5 mW. The ruby emission was detected with an Ocean Optics HR2000+ spectrometer glazed at 700 nm (spectral resolution of 0.1 nm) and a silicon CCD detector.
Raman spectra under high-pressure conditions were obtained with a Horiba T64000 triple monochromator spectrometer using the 647 nm line of a Coherent Innova Spectrum 70C Ar+–Kr+ laser. This wavelength is significantly distant from the LSPR, thereby preventing its absorption by AuNS. The laser beam was focused on the samples with 20× objectives, keeping the laser power at 2 mW to reduce heating effects. A liquid nitrogen-cooled CCD (Jobin-Yvon Symphony) coupled to a confocal microscope was used for detection.
Optical extinction spectra under high-pressure conditions were collected on a home-built fibre-optic-based microscope,22 equipped with two Cassegrain 20× reflecting objectives mounted on two independent x–y–z translational stages for the microfocus beam, the objective lens, and a third independent x–y translation stage for the DAC holder. Spectra in the ultraviolet-visible and near-infrared ranges were recorded with two spectrometers, an Ocean Optics USB 2000 and a NIRQUEST 512, employing Si- and InGaAs-CCD detectors, respectively. The I and I0 transmitted intensities were measured in two separate experiments with the same DAC by loading it first with the AuNP solutions (I) and then with the corresponding solvent (I0), covering the same pressure range.
3 Results & discussion
3.1 Ruby fluorescence
The variation of the hydrostaticity limit of the three colloids studied, d = 20 nm AuNS in EtOH and d = 12 and 28 nm AuNS in MeOH–EtOH 4![[thin space (1/6-em)]](https://www.rsc.org/images/entities/char_2009.gif) :
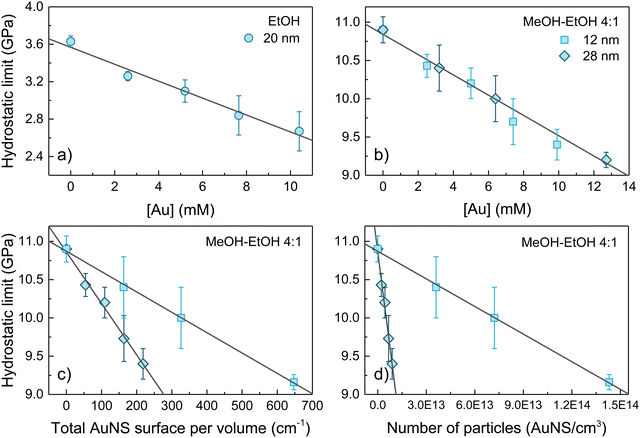
:![[thin space (1/6-em)]](https://www.rsc.org/images/entities/char_2009.gif) 1, as a function of the gold molar concentration, the total number of particles and the total gold surface is shown in Fig. 3(a)–(d). A linear decrease in the hydrostatic pressure limit with gold molar concentration is observed for all three colloids analysed. Within the same range of gold molar concentrations 0–10 mM (equivalent to around 10 nmol of nanoparticles), the hydrostatic limit of AuNS EtOH colloid decreases by 0.9 GPa (from 3.6 to 2.7 GPa, about a 25%) and by 1.5 GPa (from 10.9 GPa to 9.4 GPa, about a 14%) in the AuNS MeOH–EtOH 4
1, as a function of the gold molar concentration, the total number of particles and the total gold surface is shown in Fig. 3(a)–(d). A linear decrease in the hydrostatic pressure limit with gold molar concentration is observed for all three colloids analysed. Within the same range of gold molar concentrations 0–10 mM (equivalent to around 10 nmol of nanoparticles), the hydrostatic limit of AuNS EtOH colloid decreases by 0.9 GPa (from 3.6 to 2.7 GPa, about a 25%) and by 1.5 GPa (from 10.9 GPa to 9.4 GPa, about a 14%) in the AuNS MeOH–EtOH 4![[thin space (1/6-em)]](https://www.rsc.org/images/entities/char_2009.gif) :
:![[thin space (1/6-em)]](https://www.rsc.org/images/entities/char_2009.gif) 1 colloid. Thus, considering the relative change in the hydrostatic limit, EtOH is more affected by the presence of AuNS than MeOH–EtOH 4
1 colloid. Thus, considering the relative change in the hydrostatic limit, EtOH is more affected by the presence of AuNS than MeOH–EtOH 4![[thin space (1/6-em)]](https://www.rsc.org/images/entities/char_2009.gif) :
:![[thin space (1/6-em)]](https://www.rsc.org/images/entities/char_2009.gif) 1. It is worth noting that the non-hydrostaticity of the solvent – the inhomogeneous stress field – increases after solidification. The higher the gold concentration, the larger the broadening of the ruby R1 line after solidification (see Fig. 2). According to Fig. 3(b), we do not observe a measurable effect of AuNS size in reducing the hydrostatic limit of MeOH–EtOH 4
1. It is worth noting that the non-hydrostaticity of the solvent – the inhomogeneous stress field – increases after solidification. The higher the gold concentration, the larger the broadening of the ruby R1 line after solidification (see Fig. 2). According to Fig. 3(b), we do not observe a measurable effect of AuNS size in reducing the hydrostatic limit of MeOH–EtOH 4![[thin space (1/6-em)]](https://www.rsc.org/images/entities/char_2009.gif) :
:![[thin space (1/6-em)]](https://www.rsc.org/images/entities/char_2009.gif) 1 for the two studied sizes d = 12 and 28 nm, but their gold concentration. Furthermore, after studying the dependence of the hydrostatic limit on the total number of AuNS or the total specific surface area of the nanoparticles, we observe that the reduction of the hydrostatic limit is neither related to the specific surface area of the AuNS nor the nanoparticle concentration. It scales with the molar concentration of gold, i.e., with the relative volume (or mass) of gold to solvent.
1 for the two studied sizes d = 12 and 28 nm, but their gold concentration. Furthermore, after studying the dependence of the hydrostatic limit on the total number of AuNS or the total specific surface area of the nanoparticles, we observe that the reduction of the hydrostatic limit is neither related to the specific surface area of the AuNS nor the nanoparticle concentration. It scales with the molar concentration of gold, i.e., with the relative volume (or mass) of gold to solvent.
From these results, explaining the thermodynamic processes underlying this phenomenon is not trivial. Neither a reduction in entropy associated with local interactions between solvent molecules and nanoparticles nor an increase in the nucleation sites due to the presence of nanoparticles can be claimed to explain this phenomenon. In fact, contrary to our observations, these effects should be scaled to the total nanoparticle surface area or the total number of nanoparticles. The fact that the solidification pressure scales with the molar concentration of gold suggests that PEG-SH molecules, rather than AuNP, play a critical role in enhancing the solidification process. Although it can be assumed that the PEG-SH concentration scales with the AuNP total surface area, this assumption is based on the premise that the density of PEG-SH at the AuNP surface is size-independent. However, observations in AuNS indicate that the surface density of PEG-SH changes with curvature, i.e., sphere diameter. The shorter the AuNS diameter, the lower the surface PEG-SH density. A recent study23 shows that the surface PEG-SH density in AuNS is proportional to the AuNS diameter over a 10–100 nm range. From these data, we show that the number of adsorbed PEG-SH molecules at the AuNS surface depends on the AuNS diameter as d3 rather than d2 (see Fig. S1 in the ESI†), thus proving that the PEG-SH concentration scales with the molar gold concentration in the colloid. Notably, it has recently been shown elsewhere24 that the pressure-induced phase transition of the 1-dodecanethiol, a common AuNP ligand, is modified by interactions with solvent molecules, i.e., toluene, emphasizing the importance of ligand–solvent interactions in the structural evolution of these colloids with pressure.
3.2 Raman spectroscopy
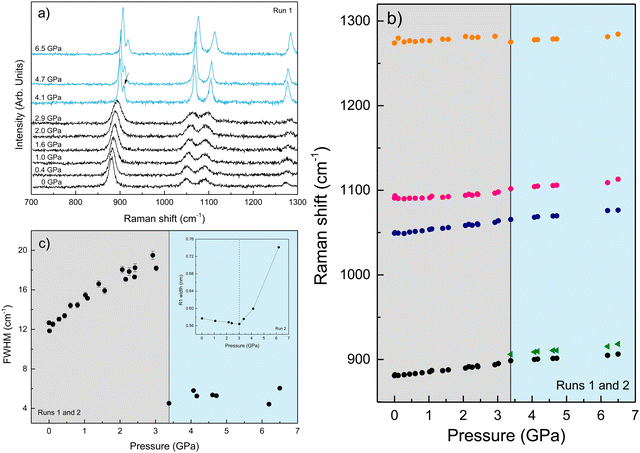
We performed Raman spectroscopy measurements in pure EtOH and in 28 nm AuNS EtOH colloids with a molar concentration [Au] = 12 mM to verify whether the presence of nanoparticles only changes the solidification pressure or also modifies the solid phase of the alcohols after crystallizing. In both cases, we performed two different pressure experiments at room temperature. Fig. 4(a)–(c) show the variation of the Raman spectrum of EtOH with pressure up to 6.5 GPa. The peak frequency, pressure derivative of the frequency, and mode assignment of each peak25,26 are summarized in Table 1. It must be noted from Fig. 4(a) and (b) that an abrupt peak narrowing and splitting of the C–C stretching mode at ω0 = 898 cm−1 indicates that EtOH crystallization occurs at 3.4 GPa. Notably, different studies on pressure-induced ethanol crystallization yielded different crystallization pressures. For example, Mammone et al.11 and Shimizu et al.27 reported similar values for the crystallization pressures of 1.8 and 1.9 GPa, respectively. Conversely, Ko et al.28 measured the acoustic properties of liquid ethanol at 2.3 GPa, in agreement with Bull et al.,29 who reported that crystallization of ethanol occurs at 2.5 GPa. Even in this work, we find differences between the results obtained through the ruby luminescence, P = 3.6 GPa (see Table S1 in the ESI†), and those obtained by Raman spectroscopy, P = 3.4 GPa. It must be noted that, when dealing with discrete measurements of a crystallization process, ruby fluorescence systematically provides a lower pressure value than Raman spectroscopy. We explain this difference by the different sensitivities of the two methods. While ruby fluorescence determines the hydrostatic limit of the system in its liquid phase, Raman spectroscopy unveils the complete crystallization process in its solid phase. Besides, heating effects due to the higher intensity of the laser beam in Raman (20 W mm−2) with respect to the excitation intensity of the ruby (1 W mm−2) might also influence the solidification pressure. The solidification pressure dependence measured by dielectric spectroscopy reveals a variation of the critical pressure with temperature of 0.01 GPa K−1.30 In this way, a local temperature variation between 10 and 20 K can explain the observed differences between Raman and ruby luminescence results. , where P0 is the crystallization pressure, which is 3.2 and 3.4 GPa for the pure EtOH and the AuNS EtOH colloid, respectively
| Assignment | EtOH | 28 nm AuNS EtOH | ||||||
|---|---|---|---|---|---|---|---|---|
| Liquid | Crystalline (P21/c) | Liquid | Crystalline (P21/c) | |||||
| ω 0 (cm−1) | ω 0 (cm−1) | ω 0 (cm−1) | ω 0 (cm−1) | |||||
| C–C stretching | 880.9(2) | 4.6(1) | 898.4(2) | 2.4(1) | 882.0(4) | 4.6(2) | 898.9(2) | 2.4(2) |
| — | — | 906.4(4) | 3.6(2) | — | — | 906.0(3) | 3.7(3) | |
| C–O stretching | 1048.7(3) | 4.7(2) | 1065.6(3) | 3.6(2) | 1050(1) | 5.2(7) | 1066.1(7) | 3.1(6) |
| 1089.5(3) | 2.4(2) | 1102.0(6) | 3.1(4) | 1091(2) | 3.1(4) | 1101.3(3) | 3.2(3) | |
| CH2 twisting | 1275.5(7) | 2.2(5) | 1275.6(5) | 2.5(3) | — | — | 1274.7(3) | 2.7(3) |
These results show the ethanol crystallization's strong dependence on pressure application dynamics. Increasing the pressure in large steps favours early crystallization pressures. Allowing the system to evolve and adapt by applying short steps of about 0.3 GPa (see Fig. 2) and ensuring delays between steps of about 10 minutes provides an ethanol crystallization of up to 3.6 GPa. Indeed, in one of our Raman spectroscopy initial trial runs in which we applied pressure in quick, short pressure steps, we observed the crystallization of EtOH at 2.8 GPa (see Fig. S2 in the ESI†). This dynamic pressure dependence of the liquid–solid transition is not new to alcohols, as a similar behaviour was observed in the pressure-induced vitrification process of methanol.31
Fig. 5(a)–(c) show the variation of the Raman spectrum of the AuNS EtOH colloids with pressure up to 5.2 GPa. According to the onset of the splitting of the C–C stretching mode in the AuNS EtOH colloids, crystallization occurs at 3.2 GPa. Interestingly, by Raman measurements, we observe a decrease in the crystallization pressure of EtOH in the presence of AuNS – from 3.4 GPa to 3.2 GPa. Notably, the Raman spectrum at 2.6 GPa in AuNS colloid in EtOH shows slight traces of crystallization, which is complete at 3.2 GPa, in agreement with observations from ruby R1-line broadening. According to the ruby fluorescence measurements performed during the Raman measurements (see Fig. 5(c)), the R1 line begins to broaden at 2.6 GPa, although crystallization is observed at 3.2 GPa through the Raman modes. Nevertheless, due to undetectable heating effects during Raman measurements, quantitative results from Raman spectroscopy are less accurate than from ruby fluorescence measurements, where the working laser power is in the tenth of a milliwatt. In addition, the hydrostatic limits obtained by the ruby fluorescence in the three runs carried out for each gold concentration in AuNS EtOH colloids agree within the experimental accuracy of data (see Tables S1–S3 in the ESI†). This shows that hydrostaticity measurements with multiple rubies throughout the pressure chamber and with lower working laser powers provide a more accurate measure of the crystallization pressure.
According to the Raman data collected in Table 1, the peak frequencies and their pressure derivatives are within the experimental accuracy the same in pure EtOH and AuNS EtOH colloid crystalline phases, showing that the presence of nanoparticles in alcohols only changes the phase transition pressure, but not the crystalline phase to which it transits. This finding holds significant importance. While our study establishes that AuNP are unsuitable for phase transition sensing, it remarkably highlights the suitability of AuNS for refractive index sensing in crystalline phases, as previously proposed.5,32
3.3 Optical extinction spectroscopy
The variations in the LSPR wavelength of 13 nm-diameter and AR = 3.0 AuNR ([Au] = 5.8 mM) and 28 nm AuNS ([Au] = 12 mM) in EtOH with pressure in the range of 0–6 GPa are shown in Fig. 6(a) and (b). It is worth noting that the hydrostatic limit of the [Au] = 5.8 mM AuNR EtOH colloid, obtained through the ruby photoluminescence spectrum pressure variation, is reached at 3.0 GPa. This value agrees with the variation of the hydrostatic limit with the molar concentration of gold for AuNS in EtOH shown in Fig. 3. Interestingly, this result confirms that the reduction of the freezing point of alcoholic AuNP colloids is solely related to the total amount of gold present in the colloid, regardless of nanoparticle size, geometry, or specific surface area.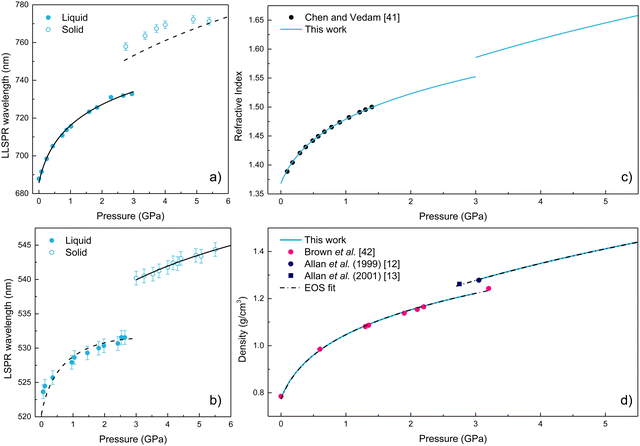 | ||
| Fig. 6 (a) and (b) Pressure dependence of the LSPR wavelength for AuNR and AuNS, respectively. The plots include experimental and calculated values of λLSPR(P). Filled circles correspond to experimental data, solid lines represent the fitted LSPR wavelength, and dashed lines indicate the equivalent LSPR wavelength calculation from rods to spheres and vice versa. (c) Pressure dependence of the refractive index of ethanol. Filled circles correspond to previously reported experimental data by Chen and Vedam.41 The solid line represents the experimental refractive index values obtained in this work. (d) Pressure dependence of the density of ethanol. Filled circles correspond to experimental data from (pink) Brown et al.,42 (blue) Allan et al.12,13 The solid blue line represents the values obtained in this work by fitting the plasmonic data. The dashed black line corresponds to a third-order Murnaghan EOS and a third-order Birch–Murnaghan EOS fit to our plasmonic-derived ρ(P) data in the liquid and crystalline phases, respectively. | ||
We observed a redshift of the LSPR wavelength with pressure in AuNR and AuNS. In addition, an abrupt LSPR jump towards longer wavelengths is observed, which is associated with the crystallization. We have verified that these results are reversible upon pressure release for AuNS. However, in AuNR, there is a broadening of the LSPR band, and the resonance is not fully recovered due to pressure-induced partial aggregation of AuNR and deformations in the non-hydrostatic range, i.e., after pressure solidification.32,33 Notably, we could use the LSPR wavelength variation with pressure to obtain the pressure dependence of the EtOH refractive index n(P), following the procedure already established elsewhere.3 Since AuNR have a higher spectral sensitivity than AuNS to variations of the refractive index of the surrounding medium, we used the pressure variation of their LLSPR wavelength to obtain the variation of EtOH refractive index with pressure in the hydrostatic regime, from 0 to 3 GPa. However, as already mentioned, AuNR undergo aggregation and plastic deformation under non-hydrostatic pressure conditions.32,33 In this way, we used the plasmonic response of AuNS to obtain the information of n(P) in the non-hydrostatic regime, from 3 to 5.5 GPa, where AuNR are no longer valid for this purpose.
We describe the pressure dependence of the EtOH refractive index using the Lorentz–Lorentz relation:
 | (1) |
 . Here NA is the Avogadro's number, V0 the zero-pressure molar volume, and αp the molecular polarizability at P, which can be described phenomenologically by the equation
  , α0 being the ambient pressure polarizability and φ the exponent related to the volume dependence of the polarizability.34 Using a third-order Murnaghan equation of state (EOS)35 to describe the EtOH compressibility, we obtain a precise description of the refractive index of the solvent as a function of pressure by fitting the n(P) contribution to the equation:
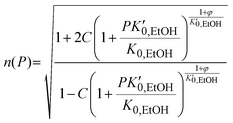 | (2) |
 , and K0,EtOH and
  are the EtOH bulk modulus and its pressure derivative at zero pressure, respectively. The change in AuNP volume was described by a Vinet EOS,36 employing a gold bulk modulus K0,AuNP = 171 GPa with a pressure derivative value of
  .37 For the liquid phase of EtOH, using a bulk modulus of K0,EtOH = 1.06 GPa38,39 and a refractive index of n0 = 1.3636 at λ = 700 nm at ambient pressure,40 we obtain values of
  and φ = −0.26 over the 0–3 GPa range. Fig. 6(c) compares the n(P) data obtained in this work with the experimental data reported by Chen and Vedam.41 Our results agree with those reported in ref. 41 in the 0–1.4 GPa pressure range. For the P21/c crystalline phase, from 3 to 5.5 GPa, we obtain K0,EtOH = 5.8 GPa and
  , using n0 = 1.433 for the refractive index at ambient pressure.12,13
Likewise, we can use the optical data to model the changes of density in EtOH under increasing pressure using the Lorentz–Lorentz relation relating its density to the refractive index as:
 | (3) |
Fig. 6(d) compares our plasmonic-derived density values against experimental data reported by Brown et al.42 and Allan et al.12,13 Our model provides very similar values to those previously found through sound velocity42 and X-ray diffraction12,13 measurements. In addition, Fig. 6(d) shows the fit of the plasmonic-derived density data obtained through EosFit7-GUI,43 using a third-order Murnaghan EOS35 and third-order Birch–Murnaghan EOS44 for the liquid and crystalline phases, respectively. The obtained values of the bulk modulus, its pressure derivative, and the density at zero pressure for the two investigated phases are given in Table 2. The K0,EtOH and  confidence ellipses for the two phases are shown in Fig. S3 in the ESI.† Noteworthily, our plasmonic-derived density data for liquid ethanol agree with those previously found elsewhere38,39 and reveal the crystalline ethanol density's behaviour under the application of pressure up to 5.5 GPa. Furthermore, the present data provide a direct measurement of EtOH's volume collapse, i.e., density jump, at the liquid–solid phase transition. The EtOH density abruptly changes from ρ = 1.224 (liquid) to 1.278 (P21/c crystal) g cm−3 at 3 GPa, representing a relative density increase – or equivalent volume reduction – of 4.3%.
4 Conclusions
We have demonstrated that the presence of PEGylated gold nanoparticles in alcohols changes the solvent solidification pressure proportionally to the gold concentration down to 25% with respect to the pure solvent. This finding highlights the need to study the solidification pressure variations using PEGylated AuNP as a high-pressure phase transition sensor of the solvent, as recently proposed,4 in order to make appropriate corrections to the pure solvent. While AuNP are well suited to study the variations of the refractive index with pressure through the pressure-induced shift of the LSPR, the solidification pressure of the solvent is shifted by the presence of PEGylated AuNP.We have shown that the solidification pressure is not related to the number of AuNS or the specific surface area of AuNS but to the relative volume of nanoparticles to solvent, as the solidification pressure scales with the molar concentration of gold which, in turn, we show it is proportional to the PEG-SH concentration in the colloid. The decrease in the solidification pressure of the alcohols is likely related to an increase in the colloid viscosity by the presence of PEG-SH rather than a decrease in the entropy or an increase in the nucleation sites induced by the presence of nanoparticles. We conclude that in future studies of physicochemical properties of solvents or surrounding media using AuNS as probes, results must be taken with caution, as some of these properties, e.g., melting, viscosity, etc., can be modified by the presence of the PEGylated AuNP themselves. Although these effects are well known in nanofluids due to the high concentration of nanoparticles (above 0.1%), this work demonstrates that dispersions with low nanoparticle concentrations (0.0001%) can significantly change solvent properties.
As a final conclusion, we have demonstrated that the plasmonics of AuNP are well suited to determine the pressure dependence of the EtOH refractive index and density in the 0–5.5 GPa range, including both the liquid and the crystalline phases. Our results were validated against previous experimental data reported elsewhere12,13,42 at lower pressures. Thus, it provides a method for measuring refractive index, hence the density, in a wider pressure range beyond the liquid state for future studies. A critical requirement of the method is to ensure colloid dispersion to avoid additional LSPR shifts due to AuNP aggregation.
Conflicts of interest
There are no conflicts to declare.Acknowledgements
We thank Prof. Luis. M. Liz-Marzán for helpful discussions and for the experimental facilities at CIC biomaGUNE in San Sebastián, used in this study. Financial support from Projects PID2021-127656NB-I00 and MALTA-Consolider Team (RED2018-102612-T) from the State Research Agency of Spain, Ministry of Science and Innovation is acknowledged. C. M.-S. acknowledges funding from the Spanish Ministry of Universities and the European Union-NextGeneration EU through the Margarita Salas research grant (C21.I4.P1).References
- F. Medeghini, M. Hettich, R. R. Rouxel, S. D. S. Santos, S. Hermelin, E. Pertreux, A. T. Dias, F. Legrand, P. Maioli and A. Crut, et al. , ACS Nano, 2018, 12, 10310–10316 CrossRef CAS PubMed.
- C. Martín-Sánchez, J. A. Barreda-Argüeso, S. Seibt, P. Mulvaney and F. Rodríguez, ACS Nano, 2019, 13, 498–504 CrossRef PubMed.
- C. Martín-Sánchez, G. González-Rubio, P. Mulvaney, A. Guerrero-Martínez, L. M. Liz-Marzán and F. Rodríguez, J. Phys. Chem. Lett., 2019, 10, 1587–1593 CrossRef PubMed.
- M. Runowski, S. Sobczak, J. Marciniak, I. Bukalska, S. Lis and A. Katrusiak, Nanoscale, 2019, 11, 8718–8726 RSC.
- C. Martín-Sánchez, A. Sánchez-Iglesias, P. Mulvaney, L. M. Liz-Marzán and F. Rodríguez, J. Phys. Chem. C, 2020, 124, 8978–8983 CrossRef.
- C. Martín-Sánchez, S. Seibt, J. A. Barreda-Argüeso and F. Rodríguez, J. Phys. Conf. Ser., 2020, 1609, 012009 CrossRef.
- R. Iizuka, H. Kagi and K. Komatsu, J. Phys. Conf. Ser., 2010, 215, 012177 CrossRef.
- B. Anis, F. Börrnert, M. H. Rümmeli and C. A. Kuntscher, Phys. Status Solidi B, 2013, 250, 2616–2621 CrossRef CAS.
- J. M. Recio, J. M. Menendez and A. Otero De la Roza, An Introduction to High-Pressure Science and Technology, CRC Press, 2013 Search PubMed.
- S. Klotz, J. C. Chervin, P. Munsch and G. Le Marchand, J. Phys. D: Appl. Phys., 2009, 42, 075413 CrossRef.
- J. F. Mammone, S. K. Sharma and M. Nicol, J. Phys. Chem., 1980, 84, 3130–3134 CrossRef CAS.
- D. R. Allan and S. J. Clark, Phys. Rev. B: Condens. Matter Mater. Phys., 1999, 60, 6328 CrossRef CAS.
- D. R. Allan, S. Parsons and S. J. Teat, J. Synchrotron Radiat., 2001, 8, 10–17 CrossRef CAS PubMed.
- Y. Zheng, X. Zhong, Z. Li and Y. Xia, Part. Part. Syst. Charact., 2014, 31, 266–273 CrossRef CAS.
- L. Vigderman and E. R. Zubarev, Chem. Mater., 2013, 25, 1450–1457 CrossRef CAS.
- C. Fernández-López, C. Mateo-Mateo, A. A. Alvarez-Puebla, J. Pérez-Juste, I. Pastoriza-Santos and L. M. Liz-Marzán, Langmuir, 2009, 25, 13894–13899 CrossRef PubMed.
- J. Rodríguez-Fernández, J. Pérez-Juste, P. Mulvaney and L. M. Liz-Marzán, J. Phys. Chem. B, 2005, 109, 14257–14261 CrossRef PubMed.
- T. Hendel, M. Wuithschick, F. Kettemann, A. Birnbaum, K. Rademann and J. Polte, Anal. Chem., 2014, 86, 11115–11124 CrossRef CAS PubMed.
- G. Shen, Y. Wang, A. Dewaele, C. Wu, D. E. Fratanduono, J. Eggert, S. Klotz, K. F. Dziubek, P. Loubeyre and O. V. Fat’yanov, et al. , High Pressure Res., 2020, 40, 299–314 CrossRef.
- K. Syassen, High Pressure Res., 2008, 28, 75–126 CrossRef CAS.
- S. Klotz, K. Takemura, T. Strässle and T. Hansen, J. Phys.: Condens. Matter, 2012, 24, 1–6 CrossRef PubMed.
- J. A. Barreda-Argüeso and F. Rodríguez, ES Pat., ES2461015B2, 2013 Search PubMed.
- K. Rahme, L. Chen, R. G. Hobbs, M. A. Morris, C. O'Driscoll and J. D. Holmes, RSC Adv., 2013, 3, 6085–6094 RSC.
- S. S. Sanabria and L. A. Hanson, J. Phys. Chem. B, 2024, 128, 841–848 CrossRef PubMed.
- V. Lemos and F. Camargo, J. Raman Spectrosc., 1990, 21, 123–126 CrossRef CAS.
- G. Socrates, Infrared and Raman Characteristic Group Frequencies: Tables and Charts, John Wiley & Sons, 2004 Search PubMed.
- H. Shimizu, Y. Nakamichi and S. Sasaki, J. Raman Spectrosc., 1990, 21, 703–704 CrossRef CAS.
- J. H. Ko, M. S. Jeong, B. W. Lee, J. H. Kim, Y. H. Ko, K. J. Kim, T. H. Kim, S. Kojima and M. Ahart, Korean J. Opt., 2013, 24, 279–286 CrossRef CAS.
- C. L. Bull, S. A. Barnett, D. R. Allan and W. G. Marshall, High Pressure Res., 2019, 39, 179–184 CrossRef CAS.
- M. V. Kondrin, A. A. Pronin and V. V. Brazhkin, J. Chem. Phys., 2014, 141, 194504 CrossRef CAS PubMed.
- M. J. P. Brugmans and W. L. Vos, J. Chem. Phys., 1995, 103, 2661–2669 CrossRef CAS.
- C. Martín-Sánchez, A. Sánchez-Iglesias, J. A. Barreda-Argüeso, A. Polian, L. M. Liz-Marzán and F. Rodríguez, ACS Nano, 2023, 17, 743–751 CrossRef PubMed.
- C. Martín-Sánchez, A. Sánchez-Iglesias, P. Mulvaney, L. M. Liz-Marzán and F. Rodríguez, J. Phys. Chem. C, 2022, 126, 1982–1990 CrossRef.
- J. H. Eggert, L. Xu, R. Che, L. Chen and J. Wang, J. Appl. Phys., 1992, 72, 2453 CrossRef CAS.
- F. D. Murnaghan, Proc. Natl. Acad. Sci. U. S. A., 1944, 30, 244–247 CrossRef CAS PubMed.
- P. Vinet, J. Ferrante, J. R. Smith and J. H. Rose, J. Phys. C: Solid State Phys., 1986, 19, L467 CrossRef CAS.
- C. Martín-Sánchez, A. Sánchez-Iglesias, J. A. Barreda-Argüeso, A. Polian, J. P. Itié, J. Pérez, P. Mulvaney, L. M. Liz-Marzán and F. Rodríguez, ACS Nano, 2021, 15, 19128–19137 CrossRef PubMed.
- S. G. Bruun, P. G. Sørensen, A. A. S. E. Hvidt, A. Kjekshus, B. Klewe and D. L. Powell, Acta Chem. Scand., Ser. A, 1974, 28, 1047–1054 CrossRef.
- A. Giacomini, J. Acoust. Soc. Am., 1947, 19, 701–702 CrossRef CAS.
- I. Z. Kozma, P. Krok and E. Riedle, J. Opt. Soc. Am. B, 2005, 22, 1479–1485 CrossRef CAS.
- C. C. Chen and K. Vedam, J. Chem. Phys., 1980, 73, 4577 CrossRef CAS.
- J. M. Brown, L. J. Slutsky, K. A. Nelson and L. T. Cheng, Science, 1988, 241, 65–67 CrossRef CAS PubMed.
- J. Gonzalez-Platas, M. Alvaro, F. Nestola and R. Angel, J. Appl. Crystallogr., 2016, 49, 1377–1382 CrossRef CAS.
- F. Birch, Phys. Rev., 1947, 71, 809 CrossRef CAS.
Footnote |
| † Electronic supplementary information (ESI) available. See DOI: https://doi.org/10.1039/d4tc00358f |
| This journal is © The Royal Society of Chemistry 2024 |

