 Open Access Article
Creative Commons Attribution 3.0 Unported Licence
Surface chemistry in atomic layer deposition of AlN thin films from Al(CH3)3 and NH3 studied by mass spectrometry†
Pamburayi
Mpofu
 a,
Houyem
Hafdi
 a,
Pentti
Niiranen
 a,
Jonas
Lauridsen
b,
Oscar
Alm
b,
Tommy
Larsson
b and
Henrik
Pedersen
 *a
*a
aDepartment of Physics, Chemistry and Biology, Linköping University, SE-581 83, Linköping, Sweden. E-mail: henrik.pedersen@liu.se
bSeco Tools AB, SE-737 82, Fagersta, Sweden
First published on 17th July 2024
Abstract
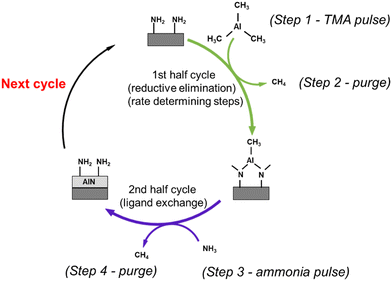
Aluminum nitride (AlN) is a semiconductor with a very wide band gap and a potential dielectric material. Deposition of thin AlN films is routinely done by several techniques, including atomic layer deposition (ALD). In this study, we deposited AlN using ALD with trimethylaluminum (TMA) as the Al precursor and ammonia (NH3) with and without plasma activation as the N precursor in the temperature range from 100 to 400 °C while monitoring the surface reactions using mass spectrometry. Our results, combined with recent quantum chemical modelling, suggest that the surface chemistry of the deposition process is chemisorption of TMA followed by reductive elimination of the methyl groups to render mono methyl aluminum species. The NH3 chemisorption is done by ligand exchange to form CH4 and an –NH2 terminated surface.
1. Introduction
The properties of aluminum nitride (AlN), including a wide bandgap (6.2 eV), high dielectric constant (k ∼ 9), high electrical resistivity (ρ ∼ 1011–1013 Ω cm), and high thermal conductivity (2.85 W K−1 cm−1)1 make it an important material in microelectronics and optoelectronics. AlN is also used in microelectromechanical systems (MEMS devices) due to its piezoelectric properties.2 Amorphous AlN finds uses e.g., as passivation and dielectric layers.3 Thin films of AlN are routinely deposited by reactive sputtering,4 chemical vapor deposition (CVD),5 reactive molecular beam epitaxy (MBE),6 and atomic layer deposition (ALD). ALD of AlN has garnered significant attention for applications demanding robust protective layers, such as the development of corrosion–resistant, insulating and protective coatings.7ALD is based on sequential, self-limiting surface chemical reactions, enabled by carefully tuned deposition chemistry and an alternating precursor supply onto the substrate. This leads to the hallmark of ALD: conformal deposition on topologically complex surfaces. The alternating surface chemistry also facilitates studies of the surface chemistry and reaction mechanisms as the surface is only exposed to one type of precursor molecule at a time. Puurunen et al.8–10 have explored the surface chemistry of AlN using trimethylaluminum (TMA) and ammonia (NH3) by infrared (IR) spectroscopy and nuclear magnetic resonance (NMR) spectroscopy on porous silica and alumina. They found that the amount of hydrogen in amino (–NHx) groups increased with the number of reaction cycles on both alumina (Al2O3) and silica (SiO2) substrates, suggesting that more NHx groups were formed on the Al2O3 and SiO2 surfaces as the reactions progressed. The interaction of TMA with dehydroxylated SiO2 involved ligand exchange with surface hydroxyl (–OH) groups and dissociation in siloxane (–Si–O–Si–) bridges, leading to surface saturation with methyl (CH3) groups, followed by the replacement of these CH3 groups by NHx groups upon reaction with NH3, indicating a stepwise transformation of the surface chemistry. Additionally, upon reacting with silica, TMA generated –Si–CH3 groups on the surface, and the subsequent interaction with NH3, particularly at higher temperatures, led to the removal of over 90% of the initial CH3 groups, which aligned with the proposed reaction pathway for this process.
A recent modelling study of the surface reconstruction after the NH3 pulse in ALD of AlN, GaN and InN,11 suggests that, at typical ALD temperatures and pressures, the AlN surface is predominantly covered by –NH2 species at thermal equilibrium. The surface chemistry of TMA and NH3 in ALD of AlN was also recently mapped out using density functional theory (DFT),12 suggesting that the decomposition pathways of TMA are crucial for determining film growth rates. Three distinct decomposition pathways for TMA molecules on the surface were observed: (i) TMA undergoes reductive elimination to produce monomethyl aluminum on the surface and ethane gas; this pathway does not involve the removal of surface hydrogen atoms, (ii) methyl protonation followed by reductive elimination where TMA interacts with two surface hydrogen atoms, leading to the formation of monomethyl aluminum on the surface, along with methane and ethane gas, surface hydrogen atoms are transferred to the methyl groups during this decomposition pathway, and (iii) methyl protonation twice where TMA reacts with a surface hydrogen atom to generate an aluminum adatom, methane and ethane gas, this process involves the removal of hydrogen atoms from the surface during decomposition.
These pathways were found to be pivotal in determining surface coverage, hydrogen removal, and the overall AlN film-growth efficiency. The DFT study found that TMA would most likely adsorb as a Lewis adduct on the –NH2 covered surface and decompose via reductive elimination or methyl protonation pathways, with the proximity to previously adsorbed TMA molecules influencing the decomposition pathway. The ratio of the different decomposition pathways was suggested to affect the growth per cycle (GPC) by influencing the saturation coverage of the surface. The relative concentrations of TMA molecules decomposing via the three pathways determine the availability of surface sites for TMA adsorption. If the dominant pathway is methyl protonation, which removes surface hydrogen and allows for additional TMA adsorption sites, the GPC may increase due to higher surface saturation coverage. On the other hand, if the dominant pathway is reductive elimination, which does not involve hydrogen removal, the GPC may be lower as the surface may become saturated with hydrogen atoms, limiting additional TMA adsorption sites.
Herein, we use mass spectrometry to investigate the surface reactions in both thermal and plasma ALD of AlN, using TMA as the Al precursor and NH3, with and without plasma activation, as the N co-reactant. The use of in situ mass spectrometry for real-time analysis of gas-phase species during the reactions of this precursor combination has not been reported hence it is not fully understood. Our results add to the previous DFT study to form a surface chemical mechanism of ALD of AlN using TMA.
2. Experimental details
A hot-wall Picosun R-200 Advanced ALD reactor, equipped with a Litmas remote inductively coupled plasma (ICP) source, was used for deposition. The reactor operated at 4 mbar with a continuous flow of 400 sccm high-purity N2 (99.999% with further drying using a getter filter) into the chamber, which was also used as the purge gas. TMA (Epivalence, electronic grade) was kept at 22 °C and vapor was drawn by opening a valve to the low-pressure reactor. The thermal processes used NH3 (AGA/Linde, 99.999% and further purified by a getter filter) as the nitrogen precursor whereas the plasma ALD processes used a plasma discharge in a mixture of 75 sccm NH3 and 100 sccm Ar (99.999% and further purified by a getter filter). The ICP plasma source was located approximately 75 cm above the substrate and ignited the plasma with a 2800 W plasma power. Prior to deposition, Si(100) substrates were cleaned with acetone and isopropanol for 10 minutes each to remove surface contaminants before blow-drying them with N2 gas.Film thicknesses were measured by spectroscopic ellipsometry (SE) that uses CompleteEASE software for data analysis and reporting of results. Ellipsometric spectra were recorded in the wavelength range of 210–1690 nm at four angles of incidence (45°, 55°, 65°and 75°) using a variable angle a J.A. Wollam RC2 Mueller matrix spectroscopic ellipsometer. The thicknesses of the films were then obtained by modeling the measured data using Cauchy dispersion function. Lower film thicknesses (e.g., below 100 nm) were measured by X-ray reflectivity (XRR) with the software PANalytical X’Pert reflectivity and a two-layer model to fit the data and calculate the film thickness. Crystallinity was measured in both θ–2θ and grazing incidence X-ray diffraction (GIXRD) geometries using a PANalytical EMPYREAN MRD diffractometer with a Cu X-ray tube, wavelength of 1.54 Å, operating at 45 kV and 40 mA.
X-ray photoelectron spectroscopy (XPS) was used to obtain elemental compositions and chemical bonding. The results were obtained using Kratos AXIS Ultra DLD, equipped with an Ar+ sputtering source. During acquisition, a monochromatic Al Kα X-ray radiation, wavelength 8.35 Å, with 150 W power (anode current = 10 mA and anode voltage = 15 kV) was used. The recorded photoelectron spectra were analyzed using the CasaXPS software package. By quantitative analysis in Casa XPS, the signals originating from the thin films could be de-convoluted and the chemical composition could be quantified. Gaussian–Lorentz functions and Shirley background were used to fit the experimental XPS data.
Optical emission spectroscopy (OES) utilized the Mechelle 900 Spectrometer with a cooled digital 12-bit SensiCam CCD camera system, covering a wavelength range from ultraviolet (UV) to near infrared (NIR), i.e., 200–1100 nm. Positioned perpendicular to the plasma source, the spectrometer captured light emitted from the NH3 plasma, directing it to a monochromator through an optical fiber cable. Measurements were conducted immediately after the ICP source in the gas flow direction, before reaching the substrate which is located approximately 65 cm further down which is the only available view port where we can observe the plasma in our reactor set up. Data analysis considered the spectrometer's consistent spectral resolution of 900, enabling the resolution of wavelengths separated by 1/900 of the wavelength.
Gaseous species in the exhaust from the ALD chamber were measured using a Hiden Analytical HPR-30 residual gas analysis (RGA) vacuum process sampling system that includes a HAL 201 RC mass spectrometer (MS) with a Faraday cup detector. The RGA system was connected approximately 80 cm from the substrate stage, with gas lines maintained at room temperature since no residue condensation along the lines was noted. The MS analysis involved collecting both scan spectra and multiple ion detection (MID) of specific ions with electron impact ionization set at 70 eV to ensure efficient reactant molecule fragmentation, enabling the detection and analysis of gas-phase reaction products. The system was differentially pumped and the operating pressure during typical measurements is kept in the order of 10−6 mbar to enable mean free paths that allow collisionless particle transport of the ions from the orifice to the detector. The obtained data was analysed using MASsoft 10 (Hidden Analytical) software.
3. Results
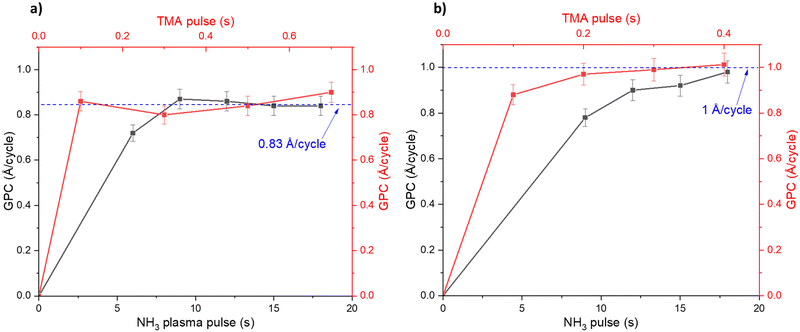
Fig. 1 shows how the GPC varies with the TMA pulse time and NH3 pulse time: for the plasma (Fig. 1a) and thermal (Fig. 1b) ALD processes. The TMA pulse shows a self-limiting surface chemistry, about 0.2 s pulse is needed to reach saturation in the GPC for both the plasma and thermal processes. The NH3 plasma shows a saturating surface chemistry with exposure times higher than 7 seconds (Fig. 1a). The thermal NH3 pulse required 12 seconds or longer for self-limiting surface chemistry, albeit less clear than the plasma process (Fig. 1b). It can be noted that the plasma process saturates at 0.83 Å per cycle while the thermal process saturates at approximately 1 Å per cycle.The plasma process showed a temperature window where the GPC is not affected significantly by temperature between 250 and 325 °C (Fig. 2a). We therefore carried out saturation growth experiments for this process at 300 °C which is within this temperature window. The thermal process showed no clear temperature window where the GPC is not affected by the temperature (Fig. 2b) and very little films were deposited at temperatures below 300 °C. From this, we used 350 °C for studies of the thermal process. Nearly stoichiometric and polycrystalline films were deposited at 300 °C and 350 °C for the plasma and thermal processes respectively, see ESI,† Table S1 and Fig. S1, S2.
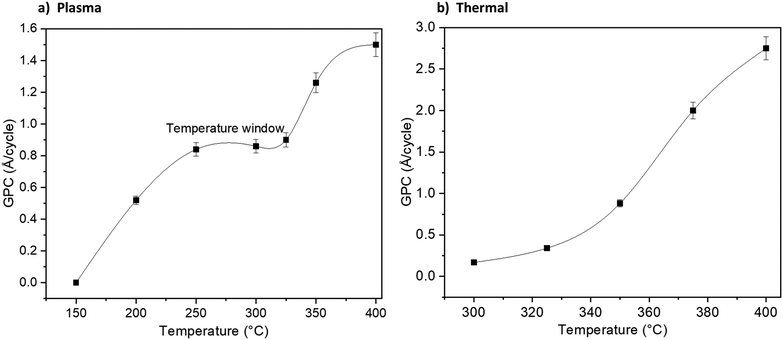 | ||
| Fig. 2 Growth dependence on process temperature for the plasma (a) and thermal (b) processes using 0.2 s TMA and 12 s NH3 pulse times. Lines are a guide for the eyes. | ||
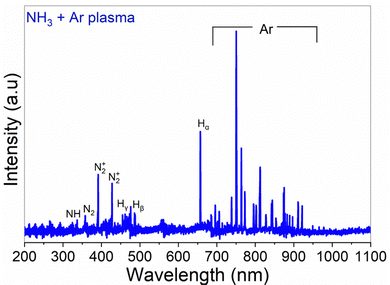
The optically active plasma species were studied by OES (Fig. 3), collected when the reactor walls were 300 °C, with a plasma power of 2800 W, and NH3 and Ar flow rates of 100 sccm each. Although the information obtained from OES is limited, relying on excitation processes and radiative transitions, it can give qualitative insight into the species produced in the plasma. The plasma emission lines from OES included NH at 336.1 nm, N2 at 357.1 nm, and N2+ at 391.4 nm and 427.6 nm.13,14 Additionally, the emission peaks at around 336–337 nm indicated the presence of excited NH and N2 radicals,14 corresponding to specific transitions, supporting the existence of NHx and N2 species.
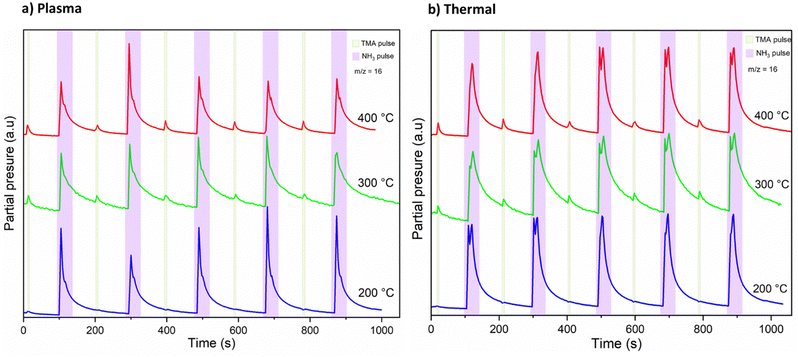
A mass spectrometric survey scan was carried out to see the residual reaction species and byproducts leaving the reactor (Fig. 4). The main residual gases from the ALD reactor are H2, N, CH4, NH3, Ar, N2 and Al(CH3), while CH3 and C2H6 are detected as minor species. No other species were detected beyond m/z = 60. From these species, CH4 is neither a molecule delivered into the reactor nor a direct fragment of the dosed molecules (TMA and NH3) but is expected to be a product of surface chemical reactions. Hence, we studied and monitored its evolution with temperature over time as illustrated in Fig. 5. It can be noted that the signal from m/z = 16 increases rapidly with the NH3 pulse for both the thermal and the plasma process. As the temperature increases, the m/z = 16 signal is also detected with the TMA pulse. We note that the m/z = 16 signal could also emanate from NH2+, formed by decomposition of NH3 in the QMS. This is likely the explanation for the double peaks observed at the NH3 pulses, the first peak is the NH2+ from the NH3 pulse, the second is the CH4+ from the surface reactions.
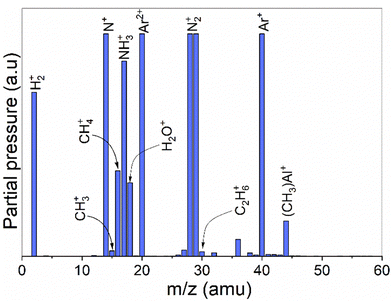 | ||
| Fig. 4 A survey scan showing average intensities of all detected masses during 5 ALD cycles of the TMA-NH3 process. No other species were detected beyond m/z 60. | ||
From Fig. 5, activation barriers were calculated using the Arrhenius equation, which relates the rate constant of a reaction to temperature and activation energy. The Arrhenius equation is given by:
| k = A·e−(Ea/RT) |
![[thin space (1/6-em)]](https://www.rsc.org/images/entities/char_2009.gif) k) against the inverse temperature (1/T), a linear relationship was obtained, and the activation energy was calculated from the slope of the resulting Arrhenius plot. The pre-exponential factor can be determined from the intercept of the plot as well. Therefore, the activation barriers were extracted by fitting experimental data to the Arrhenius equation and analyzing the resulting plots to determine the activation energy that best describes the temperature dependence of the reaction rate.
k) against the inverse temperature (1/T), a linear relationship was obtained, and the activation energy was calculated from the slope of the resulting Arrhenius plot. The pre-exponential factor can be determined from the intercept of the plot as well. Therefore, the activation barriers were extracted by fitting experimental data to the Arrhenius equation and analyzing the resulting plots to determine the activation energy that best describes the temperature dependence of the reaction rate.
From the slope of the tangent of the decay of the m/z = 16 signal, in Fig. 5, we extracted an approximation for the rate constants for the methane evolution from the surface reactions. By doing this for all three studied temperatures, we could approximate the activation energies (Ea) for the methane evolution, using Arrhenius plots shown in ESI,† Fig. S3. The extracted activation energies for methane evolution were 19–20 kJ mol−1 during the TMA pulse, 14 kJ mol−1 during the plasma activated NH3 pulse, and 17 kJ mol−1 during the thermally activated NH3 pulse. The shape of the Arrhenius plots suggests that the NH3 pulses are in a mass transport limited regime at T ≥ 300 °C, while the TMA pulses seem to be in a surface kinetics limited regime at all temperatures studied. However, considering the small differences in the mentioned activation energies, a comparison between the thermal and plasma processes could possibly show that the surface reactions may not be that different.
4. Discussion
From our observations, we will now discuss the growth mechanisms that were initially proposed in the previous modelling work.12TMA pulse
DFT suggested that a surface chemistry fully dominated by ligand exchange, render a GPC on the (001) surface of AlN of 2.49 Å per cycle, while a surface chemistry dominated by reductive elimination render a third of that GPC, i.e., 0.83 Å per cycle.12 Our experiments, with growth on the (100); (002); and (101) AlN surfaces, with increasing TMA and NH3 plasma exposure times show a self-limiting surface chemistry for both half reactions (Fig. 1) with 0.83 and ∼1 Å per cycle at saturation for the plasma and thermal processes, respectively. This suggests that, during the TMA pulse, the surface chemistry is highly dominated by reductive elimination of methyl groups as methane, rendering monomethyl aluminum on the surface. Methane was also detected by mass spectrometry. The change in CH4 evolution with temperature, Fig. 5, suggests that thermal activation is stronger from the TMA pulse than the NH3 pulse. Our estimated activation energies are in line with this, with the highest activation energy for the methane evolution during the TMA pulse. The much lower intensity of the unprotonated methyl ligand, CH3 at m/z = 15 and its possible recombination product C2H6 at m/z = 30 (two methyls can combine and produce ethane in a ‘termination’ type of reaction), compared to methane at m/z = 16 in Fig. 4, aligns with the anticipated reaction mechanism where the adduct ligand participates in the reaction, forming CH4, rather than separating independently as ˙CH3.We thus suggest that the TMA molecules adsorb to the surface through their interaction with -NH2 surface groups, and this initial half-cycle can be defined by reaction (1):
| ‖– NH2 + Al(CH3)3 → ‖– NH2−xAl(CH3)3−x + xCH4(g) | (1) |
NH3 pulse
Based on the mass spectrometry measurements, where a very sharp m/z = 16 signal was observed during each NH3 pulse for both the plasma and thermal processes (Fig. 5), the reaction mechanism for the interaction between NH3 and the –Al(CH3)x covered surface produces methane. Therefore, we suggest that ammonia molecules, or possibly NHx species in the plasma process, undergo a ligand exchange with surface-bound Al centers to eliminate methane and form an Al–N bond. During the co-reactant half-cycle with NH3, the continued, and even higher intensity compared to that during the TMA pulse, detection of CH4+ ions reaching the mass spectrometer, suggests that more methane is produced in the NH3 pulse than in the TMA pulse. This could support the stepwise ligand exchange or methyl protonation mechanism. It is worthwhile to note that during the NH3 pulse, especially in the thermal process, some double peaks were observed, which we attribute to either a contribution from NH2+, formed by decomposition of NH3 in the QMS, or instrument artifacts.15 Instrumental factors such as detector saturation, electronic noise, or ion suppression can possibly affect the shape and resolution of peaks thereby introducing distortions in the mass spectrum, leading to the appearance of forked peaks.The saturation curve for the plasma NH3 pulse (Fig. 1a) shows differences to the thermal NH3 pulse (Fig. 1b), suggesting that the thermal reaction is not as strictly self-limited as the plasma reaction. However, such differences are not shown by the residual gas analysis, as both processes show the same pattern of evolution of methane with temperature (Fig. 5). The observation that no reaction occurs below 300 °C in the thermal process agrees with previous studies that showed that the NH3 surface reactions with TMA in thermal ALD only occur with reasonable rates at temperatures close to where decomposition of TMA takes place.16 The presence of hydrogen radicals in the NH3 plasma (Fig. 3), suggests that hydrogenation processes of the surface species could play a role in plasma ALD of AlN, which would limit TMA adsorption. This could explain why the plasma process has slightly lower GPCs than the thermal process. The difference in the saturation curves could also be a sign of difference in reaction activity. This is further supported by a higher nucleation delay in the thermal process compared to that in the plasma process (Fig. S4, ESI†).
As the NH3 plasma ALD process is expected to be further from thermal equilibrium, the surface termination may not be the same for the plasma process. The detection of NH radicals in the OES spectra (Fig. 3) indicates the presence of more reactive nitrogen species in the plasma.
If we assume that both the thermal and plasma process renders –NH2 surface species in the NH3 pulse, in accordance with recent modelling,11 the elimination of the –CH3 ligands is facilitated by protonation reactions, resulting in the generation of CH4 as follows:
| ‖– Al(CH3)x + x(NH3) (g) → ‖– Al–(NH2)x + xCH4(g) | (2) |
5. Conclusions
AlN films were grown by both plasma and thermal ALD from TMA and NH3, while the effects of process temperature on precursor reaction mechanisms were studied in situ by mass spectrometry. The surface chemical reactions were monitored at m/z = 16, corresponding to CH4+, which was produced in both the TMA and NH3 pulses. The results from mass spectrometry and the obtained GPC support recent DFT modelling that the reaction pathway for TMA chemisorption on AlN is reductive elimination. From mass spectrometry results, we suggest that the NH3 chemisorption pathway involved ligand exchange to produce CH4. Our results also indicated that the reaction activities were much slower for the TMA half-cycle, making it the rate-limiting step.Data availability
The data that support the findings of this study are available from the corresponding author upon a reasonable request.Conflicts of interest
The authors declare no conflict of interest.Acknowledgements
Seco Tools and the Swedish foundation for Strategic Research through the project ‘‘Time-resolved low temperature CVD for III-nitrides’’ (SSF-RMA 15-0018) are gratefully acknowledged for financial support. HP acknowledge financial support from the Swedish Government Strategic Research Area in Materials Science on Advanced Functional Materials at Linköping University (Faculty Grant SFO-Mat-LiU No. 2009-00971). The authors would like to thank Seán T Barry for fruitful discussions and helpful comments on our manuscript.References
- M. Kot, K. Henkel, F. Naumann, H. Gargouri, L. Lupina, V. Wilker, P. Kus, E. Pozárowska, S. Garain, Z. Rouissi and D. Schmeißer, Comparison of plasma-enhanced atomic layer deposition AlN films prepared with different plasma sources, J. Vac. Sci. Technol., A, 2019, 37, 020913 CrossRef.
- E. Iborra, J. Olivares, M. Clement, L. Vergara, A. Sanz-Hervás and J. Sangrador, piezoelectric properties and residual stress of sputtered AlN thin films for MEMS applications, Sens. Actuators, A, 2004, 115, 501–507 CrossRef CAS.
- M. Bosund, T. Sajavaara, M. Laitinen, T. Huhtio, M. Putkonen, V. M. Airaksinen and H. Lipsanen, properties of AlN grown by plasma enhanced atomic layer deposition, Appl. Surf. Sci., 2011, 257, 7827–7830 CrossRef CAS.
- U. Zaghloul and G. Piazza, Synthesis and characterization of 10 nm thick piezoelectric AIN Films with High C-axis orientation for miniaturized nanoelectromechanical devices, Appl. Phys. Lett., 2014, 104, 253101 CrossRef.
- Y. Yang, T. Schulz, M. John, A. Ringe, H. W. Roesky, D. Stalke, J. Magull and H. Ye, Synthesis, characterization, and reaction of aluminum halide amides supported by a bulky β-diketiminato ligand, Inorg. Chem., 2008, 47, 2585–2592 CrossRef CAS PubMed.
- S. Tamariz, D. Martin and N. Grandjean, AlN grown on Si(1 1 1) by Ammonia-molecular beam epitaxy in the 900–1200 °C temperature range, J. Cryst. Growth, 2017, 476, 58–63 CrossRef CAS.
- E. Y. Yun, W. J. Lee, Q. M. Wang and S. H. Kwon, Electrical and corrosion properties of titanium aluminum nitride thin films prepared by plasma-enhanced atomic layer deposition, J. Mater. Sci. Technol., 2017, 33, 295–299 CrossRef CAS.
- R. L. Puurunen, M. Lindblad, A. Rootc and A. O. I. Krausea, Successive reactions of gaseous trimethylaluminium and ammonia on porous alumina, Phys. Chem. Chem. Phys., 2001, 3, 1093–1102 RSC.
- R. L. Puurunen, A. Root, P. Sarv, M. M. Viitanen, H. H. Brongersma, M. Lindblad and A. O. I. Krause, Growth of aluminum nitride on porous alumina and silica through separate saturated gas-solid reactions of trimethylaluminum and ammonia, Chem. Mater., 2002, 14, 720–729 CrossRef CAS.
- R. L. Puurunen, A. Root, P. Sarv, S. Haukka, E. I. Iiskola, M. Lindblad and A. O. I. Krause, Growth of aluminum nitride on porous silica by atomic layer chemical vapour deposition, Appl. Surf. Sci., 2000, 165, 193–202 CrossRef CAS.
- K. Rönnby, H. Pedersen and L. Ojamäe, Surface structures from NH 3 chemisorption in CVD and ALD of AlN, GaN, and InN films, J. Phys. Chem. C, 2022, 126, 5885–5895 CrossRef.
- K. Rönnby, H. Pedersen and L. Ojamäe, Surface chemical mechanisms of trimethyl aluminum in atomic layer deposition of AlN, J. Mater. Chem. C, 2023, 11, 13935–13945 RSC.
- A. J. M. Mackus, S. B. S. Heil, E. Langereis, H. C. M. Knoops, M. C. M. van de Sanden and W. M. M. Kessels, Optical emission spectroscopy as a tool for studying, optimizing, and monitoring plasma-assisted atomic layer deposition processes, J. Vac. Sci. Technol., A, 2010, 28, 77–87 CrossRef CAS.
- P. Deminskyi, P. Rouf, I. G. Ivanov and H. Pedersen, Atomic layer deposition of InN using trimethylindium and ammonia plasma, J. Vac. Sci. Technol., A, 2019, 37, 020926 CrossRef.
- A. A. J. Wei, A. Joshi, Y. Chen and J. S. McIndoe, Strategies for avoiding saturation effects in ESI-MS, Int. J. Mass Spectrom., 2020, 450, 116306 CrossRef CAS.
- D. Riihelä, M. Ritala, R. Matero, M. Leskelä, J. Jokinen and P. Haussalo, Low Temperature deposition of AlN films by an alternate supply of trimethyl aluminum and ammonia, Chem. Vap. Deposition, 1996, 2, 277–283 CrossRef.
- P. Rouf, P. Sukkaew, L. Ojamäe and H. Pedersen, Reduction of carbon impurities in aluminum nitride from time-resolved chemical vapor deposition using trimethylaluminum, J. Phys. Chem. C, 2020, 124, 14176–14181 CrossRef CAS.
Footnote |
| † Electronic supplementary information (ESI) available. See DOI: https://doi.org/10.1039/d4tc01867b |
| This journal is © The Royal Society of Chemistry 2024 |

