 Open Access Article
Surface properties and corrosion protection study of a poly(N-ethyl-4-vinylpyridine) polyelectrolyte-based coating on an electrochemically formed Ti|TiO2 surface
Jozefina
Katić
 *a,
Juraj
Nikolić
 *b,
Tea
Juračić
 b,
Tin
Klačić
 b,
Danijel
Namjesnik
 b and
Tajana
Begović
 b
b
aDepartment of Electrochemistry, Faculty of Chemical Engineering and Technology, University of Zagreb, Trg Marka Marulića 19, HR-10000 Zagreb, Croatia. E-mail: jkatic@fkit.unizg.hr
bDepartment of Chemistry, Faculty of Science, University of Zagreb, Horvatovac 102A, HR-10000 Zagreb, Croatia. E-mail: jnikolic@chem.pmf.hr
First published on 24th September 2024
Abstract
In this study, the surface properties and corrosion behavior of a titanium sample modified with an electrochemically formed oxide layer (Ti|TiO2) and Ti|TiO2 sample coated with poly(N-ethyl-4-vinylpyridinium) cations (PE4VP) were studied. It was shown, by means of atomic force microscopy and ellipsometry, that the Ti|TiO2 surface is very flat with an average roughness of only 3.4 nm and an oxide layer thickness of 16.1 nm. The inner surface potential of the Ti|TiO2 sample as a function of pH and concentration of sodium chloride was measured using the constructed Ti|TiO2 electrode. In order to improve the corrosion protective effectiveness of the surface coating, the process parameter conditions for strong poly(N-ethyl-4-vinylpyridinium) cation optimal adsorption on the electrochemically formed TiO2 oxide layer were determined using ellipsometry, tensiometry, and atomic force microscopy. The effect of adsorption of PE4VP cations on the inner surface potential and corrosion protection effectiveness of the TiO2 and TiO2-PE4VP coatings was examined. The electrochemical behaviour and corrosion properties of an unmodified titanium surface, titanium surface modified with an electrochemically formed TiO2 and subsequently modified with a PE4VP polyelectrolyte-based coating were examined by means of electrochemical impedance spectroscopy. Increased polarization resistance values and high corrosion protection effectiveness after surface modification with the PE4VP coating indicate the formation of a highly protective coating with high corrosion resistance imparted to the underlying titanium. The results presented here provide an insight into the optimization of strong polyelectrolyte cation adsorption process parameters and demonstrate that application of a PE4VP coating is a suitable method for surface modification of titanium to enhance corrosion protection in an aggressive environment.
Introduction
Titanium, a non-toxic, biocompatible metal, with low density, low thermal conductivity, and high specific strength has a wide range of applications in industries and medicine.1,2 It is used as a corrosion-resistant material. When titanium is exposed to oxidizing conditions (e.g. air, water or other oxygen-containing fluids), a thin oxide film is formed spontaneously on its surface. This oxide film determines the corrosion behaviour of the underlying metal. The formed passive oxide film mostly consists of TiO2 with small amounts of titanium oxides of lower valence, Ti2O3 and TiO.1–4 However, long-term contact with an aggressive (bio)environment, which contains a high concentration of corrosively aggressive chloride ions, may result in partial local destruction of the film and occurrence of material degradation, i.e. corrosion. Therefore, surface modification of titanium is necessary.5–7Anodic oxidation is a suitable electrochemical method for surface modification due to its simplicity and cost-effectiveness. It is an in situ electrochemical method for the formation of an oxide film on the metal sample serving as an anode. This method utilizes an electric field to facilitate the ionization of elements in the aqueous electrolyte and their diffusion to the metal.8 Adjusting the electrochemical process parameters (film formation potential, anodization time, current density, electrolyte composition and concentration, bath temperature, etc.) leads to the formation of a thick TiO2 layer possessing unique properties.8,9 Obtaining a thicker layer of oxide protective film is usually done potentiostatically at an appropriate voltage and current density,10 since the potentiostatically grown film is thicker, rougher, and more crystalline than the films formed under galvanostatic or potentiodynamic conditions and in combined modes.11,12 During oxide film growth, metal ions react with oxygen (or oxygen-containing) anions from the electrolyte forming an oxide film on the metal surface. For subsequent growth, the metal cations, produced at the metal|film interface, need to react with the oxygen-containing anions, injected in the film at the film|electrolyte interface.8,9 Hence, the oxide film growth mechanism involves both inward and outward growth (transport of metal cations and/or O2− anions with some possible contribution of OH− ions as well across the film) because of field-assisted ion migration.8,9 The oxide film formed possesses a duplex structure, i.e., a bi-layered structure of oxide film is a well-established description of the oxide films formed on valve metals, including titanium.9,12–14 The duplex structure is confirmed by XPS measurements showing that oxide films on titanium consist predominantly of TiO2 with small amounts of suboxides TiO and Ti2O3 closer to the metal|oxide interface, while the outer part of the film is hydrated.9,10,12,15,16
Due to the presence of oxide film defects and non-uniform oxide thickness, the additional corrosion protection of titanium can be improved by coating the formed Ti|TiO2 surface with polyelectrolytes.17 The polyelectrolytes form an adherent and low porosity nanofilm limiting access of oxidants and inhibiting metal corrosion. The determined upgraded anticorrosion properties were ascribed to polyion adsorption on metal surfaces, including titanium.17–22
In this paper, we distinguish between the surface of titanium covered with a spontaneously formed TiO2 layer, the electrochemically formed TiO2 layer on the titanium surface, and surface coated by poly(N-ethyl-4-vinylpyridinium) layer, PE4VP.
Processes at metal oxide surfaces in aqueous electrolyte solution are complex. The atomic-scale structure of the interface between a metal oxide and aqueous electrolyte controls the interfacial chemical reactions, formation of a charged electrical interfacial layer (EIL),23 ion distribution within the interface and the surface phenomena such as adsorption, catalysis and surface transformation, dissolution and many others. Metal oxide surfaces in the aqueous electrolyte solution could be positively or negatively charged due to the interactions with potential determining ions.24 For metal oxide surfaces, surface charge is developed by protonating or deprotonating the amphoteric surface sites:
 | (1) |
 | (2) |
![[triple bond, length as m-dash]](https://www.rsc.org/images/entities/char_e002.gif) MOHz,
MOHz, ![[triple bond, length as m-dash]](https://www.rsc.org/images/entities/char_e002.gif) MOHz+12 and
MOHz+12 and ![[triple bond, length as m-dash]](https://www.rsc.org/images/entities/char_e002.gif) MOz−1 denote the surface sites of charge number z, z + 1, and z − 1, respectively. The charge numbers of surface groups are related to the coordination of metal atoms in the crystal structure of the metal oxide.25 The charged surface sites are located at the 0-plane, which is characterized by the inner surface potential, Ψ0. The inner surface potential, Ψ0, is an important property of the EIL, which depends on the metal oxide crystal structure as well on the composition of the electrolyte solution. The hydronium ion is a potential determining ion for metal oxide surfaces. Due to surface protonation or deprotonation, the surface concentration of the positive {
MOz−1 denote the surface sites of charge number z, z + 1, and z − 1, respectively. The charge numbers of surface groups are related to the coordination of metal atoms in the crystal structure of the metal oxide.25 The charged surface sites are located at the 0-plane, which is characterized by the inner surface potential, Ψ0. The inner surface potential, Ψ0, is an important property of the EIL, which depends on the metal oxide crystal structure as well on the composition of the electrolyte solution. The hydronium ion is a potential determining ion for metal oxide surfaces. Due to surface protonation or deprotonation, the surface concentration of the positive {![[triple bond, length as m-dash]](https://www.rsc.org/images/entities/char_e002.gif) MOHz+12} or negative {
MOHz+12} or negative {![[triple bond, length as m-dash]](https://www.rsc.org/images/entities/char_e002.gif) MOz−1} groups change, and thus the value of the inner surface potential:
MOz−1} groups change, and thus the value of the inner surface potential: | (3) |
The pH at which the surface is uncharged and all electrical properties diminish (surface potentials and surface charge densities) is the electroneutrality point (pHeln). In the case of no preferential, or symmetrical, association of cations or anions, the electroneutrality point corresponds to the isoelectric point and point of zero charge (pHeln = pHiep = pHpzc).26 The Ψ0(pH) function (eqn (3)) is often approximated as a linear function defined analogously to a Nernstian equation:
 | (4) |
![[thin space (1/6-em)]](https://www.rsc.org/images/entities/char_2009.gif) ln
ln![[thin space (1/6-em)]](https://www.rsc.org/images/entities/char_2009.gif) 10/F), and it is usually less than 1 since the ratio of surface concentrations of positive to negative surface groups is pH dependent and different from 1.
10/F), and it is usually less than 1 since the ratio of surface concentrations of positive to negative surface groups is pH dependent and different from 1.
The inner surface potential could be determined experimentally27 by measuring the open circuit potential (OCP) of the electrode potential of the metal oxide electrode with respect to the reference electrode.28 The response of the metal oxide electrode is determined using surface reactions (1) and (2). Knowing the electroneutrality point (pHeln), and measuring the OCP (E) at pHeln, one can evaluate the value of the inner surface potential,
| Ψ0 = E − E(Ψ0 = 0) = E − E(pHeln) | (5) |
As mentioned before, the electroneutrality point could be approximated by the isoelectric point if the counterion association is negligible or symmetric. Using the OCP method, the inner surface potential was determined for different metal oxide surfaces.28–31 An additional benefit of determining the surface potential using a crystal electrode and the OCP technique is the possibility of determination of the influence of ion or polyion adsorption on the properties of the observed metal oxide surface.17,32,33 Adsorbed ions that are located in the inner part of the EIL, affect the measured value of the inner surface potential, unlike ions in the diffuse part of the EIL, which do not affect the inner surface potential but greatly affect the electrokinetic potential.
This study was conducted to determine the process parameter conditions for optimal adsorption of poly(N-ethyl-4-vinylpyridinium) cations on the electrochemically formed TiO2 oxide layer on titanium to achieve enhanced corrosion protection effectiveness.
N-heterocycle compounds, such as polyvinylimidazoles, polyvinylpyrrolidone, polyvinylpyridine, and quinoxaline, have been tested as corrosion inhibitors due to the fast adsorption on the metal surface connected to their coordination and contribution of N-atoms in heterocyclic rings to electron density.34–39 Poly(4-vinyl pyridine) and its derivatives, linear vinyl polymers containing polar substituent pyridine, were previously tested as corrosion inhibitors under acidic conditions for metallic materials, such as Fe and steels,40–45 or as a polymer matrix for corrosion inhibitor systems.46–48 Poly(4-vinyl pyridine) and its derivatives can also be used in electrochemical sensors, production of antibacterial surfaces, and development of pH-sensitive systems.49–53 Rarely published studies include the adsorption of PE4VP on negatively charged liposomes,54 formation of PE4VP-sodium dodecyl sulfate complexes,55 and stabilization of palladium nanoparticles with PE4VP.56 Adsorption of PE4VP on a solid surface is primarily achieved by electrostatic interactions between the quaternized nitrogen atom and oppositely charged surface. PE4VP adsorption on a TiO2 surface is generally poorly investigated.
The aim of this study was to deposit poly(N-ethyl-4-vinylpyridinium) cations on the electrochemically formed TiO2 oxide layer, characterize the TiO2 layer and PE4VP coating, and estimate the corrosion protection effectiveness after surface modification. Our intention was to compare the adsorption properties and corrosion protection effectiveness with our previous studies.17,32 In this work, the TiO2 layer was formed potentiostatically on titanium in phosphate buffer solution. The thickness of the oxide and polyelectrolyte layers, surface roughness, and contact angle were measured. The influence of sodium chloride concentration on the inner surface potential of the oxide TiO2 layer on titanium was also investigated by means of the open circuit potential measurement using the constructed Ti|TiO2 electrode. As part of this research, the influence of the adsorbed poly(N-ethyl-4-vinylpyridinium) cations on the Ti|TiO2 surface potential was examined. The results of surface potential measurements support the other findings.
Materials and methods
In all performed experiments, MilliQ water was used.Ti|TiO2 sample preparation
Titanium samples for surface modification by TiO2 oxide film and PE4VP coating were prepared by slicing a titanium sheet (99.9%, Alfa Aesar, Germany) into round disks. Prior to surface modification, the titanium samples were abraded using wet SiC emery papers (#240–#1200 grit), and were successively polished with Al2O3 suspensions (particle size: 1, 0.3 and 0.05 μm), degreased in acetone and doubly distilled water in an ultrasonic bath, and thereafter dried in a nitrogen flow (99.999%, Messer, Germany). The samples obtained accordingly were labelled as Ti|TiO2(spn) (as shown in Table 1).| Description of system | Term | Symbol | |
|---|---|---|---|
| 1 | Surface of titanium coated with a spontaneously formed TiO2 layer | Unmodified Ti surface | Ti|TiO2(spn) |
| 2 | Surface of titanium coated with an electrochemically formed TiO2 layer | Electrochemically formed TiO2 layer | Ti|TiO2 |
| 3 | Polyelectrolyte-coated TiO2 layer that was electrochemically formed on titanium | PE4VP-coated electrochemically formed TiO2 layer | Ti|TiO2|PE4VP |
The titanium samples coated with a spontaneously formed TiO2 layer were electrochemically treated to thicken an oxide layer (oxide layer thickening by potentiostatic anodization).
For anodic oxidation Solartron 1287 potentiostat/galvanostat (Solartron Analytical, UK) was employed with a 3-electrode cell K47 (PAR/Ametek, USA). The samples were mounted in a Teflon holder with a surface of 1 cm2 and subjected to an electrolyte solution acting as the working electrode. The reference electrode utilized was Ag|AgCl|3 mol dm−3 KCl (E = 0.210 V vs. SHE) and 2 graphite rods were used as the counter electrode. The oxide film on the Ti was potentiostatically formed at 2.5 V for 24 hours in a phosphate buffer solution (pH = 7.4; mixture of 75 mmol dm−3 Na2HPO4 × 7H2O and 25 mmol dm−3 NaH2PO4 × 2H2O). After film formation, the samples were rinsed in doubly distilled water, and then dried in a nitrogen flow and labelled as Ti|TiO2.
Adsorption of poly(N-ethyl-4-vinylpyridinium) cations on Ti|TiO2
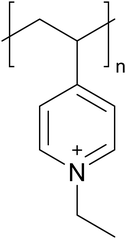
Poly(N-ethyl-4-vinylpyridinium) bromide was synthesized by ethylating the commercially available poly(4-vinylpyridine) (Mw ≈ 60![[thin space (1/6-em)]](https://www.rsc.org/images/entities/char_2009.gif) 000 g mol−1, Sigma Aldrich, USA) as described by Jukić et al.57 The PE4VP functionalization degree f (number of ionically charged monomers divided by the total number of monomers) was determined by potentiometric titration with a standardized AgNO3 solution to be 0.91. The estimated number of repeating monomeric units (Fig. 1) in one PE4VP chain is 450, and the maximum chain length in flat conformation is around 138 nm.
000 g mol−1, Sigma Aldrich, USA) as described by Jukić et al.57 The PE4VP functionalization degree f (number of ionically charged monomers divided by the total number of monomers) was determined by potentiometric titration with a standardized AgNO3 solution to be 0.91. The estimated number of repeating monomeric units (Fig. 1) in one PE4VP chain is 450, and the maximum chain length in flat conformation is around 138 nm.
The polyelectrolyte aqueous solution was prepared by dissolution of solid PE4VP in sodium chloride solution. The polyelectrolyte solution concentration was corrected according to the f-value and calculated with respect to the monomer repeating unit. The pH values of the polyelectrolyte solutions were adjusted using 0.1 mol dm−3 hydrochloric acid (Merck, Germany) and 0.1 mol dm−3 sodium hydroxide solution (Merck, Germany).
The Ti|TiO2|PE4VP sample was prepared by immersing the Ti|TiO2 sample in PE4VP solution at pH = 10 for 10 minutes. After adsorption of the polycation, the prepared Ti|TiO2|PE4VP sample was rinsed by immersion in water three times for two minutes.
Construction of the Ti|TiO2 electrode
The Ti|TiO2 electrode for OCP measurements was assembled as previously outlined.28,58 The polished sample of pure titanium, 1 cm × 1 cm × 0.1 cm (Ti, 99.9%, Alfa Aesar, Germany) with an electrochemically formed TiO2 oxide layer (Ti|TiO2) was fixed on a plexiglas holder. The electrode potential (OCP) of the Ti|TiO2 electrode, with respect to the reference Ag|AgCl electrode, in the aqueous electrolyte (or polyelectrolyte) solution was measured:| Cu(s)|conduct. glue|Ti|TiO2|aq. electrol. sol.|ref. electr. |
After construction, the Ti|TiO2 electrode was kept in a dry environment.
Methods
The Ti|TiO2 and Ti|TiO2|PE4VP systems were characterized by means of ellipsometry, tensiometry, and atomic force microscopy (AFM). The barrier properties of the TiO2 layer and TiO2-PE4VP coating were studied by electrochemical impedance spectroscopy (EIS). The pH-dependency of the inner surface potential and the effect of the ionic strength and concentration of PE4VP on the inner surface potential of the Ti|TiO2 were investigated by means of the constructed Ti|TiO2 electrode measuring the open circuit potential.Electric/dielectric properties were investigated by EIS experiments carried out in 0.1 mol dm−3 sodium chloride (p.a., Gram-Mol, Croatia) at the open circuit potential (EOC) in the frequency range from 100 kHz to 5 mHz with a 5 mV ac amplitude. Prior to EIS measurements, the electrodes were stabilized for 1 hour at EOC. The obtained EIS results were modelled in the framework of the electrical equivalent circuit (EEC) approach using ZView (Scribner, USA) for complex non-linear least-squares (CNLS) fitting procedure software.65 The obtained errors in particular EEC element values below 5% and the overall χ2 values below 0.005 indicate the good accordance between the experimental data and modelled data and justify the use of the proposed EEC for EIS data modelling.
Initially the inner surface potential of Ti|TiO2 as a function of pH at three concentrations of sodium chloride was measured.
In the second stage, the effect of PE4VP on the Ti|TiO2 electrode was measured. The electrode was immersed in measuring solution with a certain pH, PE4VP and NaCl concentrations, and the electrode potential was recorded. Open circuit potential measurements were carried out at pH values from pH = 3 to pH = 11. Additionally, the influence of NaCl and PE4VP concentration on the inner surface potential at pH = 10 was tested.
After each OCP measurement, polycation was desorbed from the Ti|TiO2 electrode by keeping the electrode in saturated sodium chloride solution for 10 minutes, rinsing with deionized water, and wiping.
Results and discussion
Characterization of the Ti|TiO2 surface
After the electrochemical formation of the TiO2 layer, the surface was characterized by AFM, tensiometry, and ellipsometry to determine its morphology, surface roughness, wettability, and TiO2 layer thickness. Fig. 2 summarizes the results.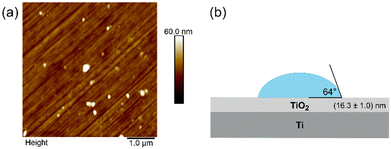 | ||
| Fig. 2 Surface characterisation of the Ti|TiO2 sample: (a) AFM image and (b) results of contact angle and ellipsometry measurements. | ||
Fig. 2a shows the AFM image of the PE4VP uncoated Ti|TiO2 surface. There are two prominent features on the image. The first feature is straight, parallel lines of a certain depth, that run through the entire surface. These are most likely the bores left after the sample was mechanically polished (see the materials and methods section) which also brings us to the second most prominent feature on the image, spherical protrusions. This feature is also most likely related to the process of polishing, i.e., the residues of the polishing material (alumina). As alumina is a much harder material on a Mohr scale, its nanoparticles can easily be imprinted to the softer Ti|TiO2 surface. The surface roughness determined from the AFM measurements was found to be (4.30 ± 0.6) nm. Fig. 2b shows the results of ellipsometry and tensiometry measurements. The thickness of the TiO2 oxide layer, determined by ellipsometry, was found to be (16.3 ± 1.0) nm. For comparison, the spontaneously formed Ti|TiO2(spn) layer, determined previously by our research team,17 was found to be about four times thinner with an oxide layer thickness of 3.8 nm and surface roughness of 3.5 nm. The measured contact angle of the Ti|TiO2 sample was (64.0 ± 2.0)°, indicating that the surface is moderately hydrophilic. This contact angle value is slightly lower than the value determined for a thin anatase TiO2 polycrystalline film on a glass surface.67 The reason for the difference may be due to the different surface roughness.
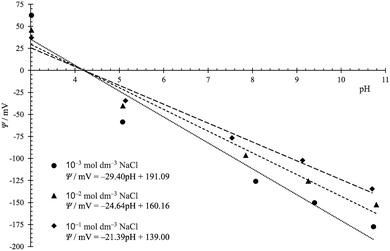
Afterwards, prepared titanium samples with an electrochemically deposited TiO2 layer were embedded and a Ti|TiO2 electrode was constructed. The open circuit potential was measured and the inner surface potential of the TiO2 layer was calculated assuming that the value of pHeln is equal to the isoelectric point obtained for the TiO2 oxide layer formed on the titanium surface, pHpzp = pHiep = 4.2.66 The inner surface potential of the TiO2 layer, as a function of the pH of the solution, was determined for three different sodium chloride concentrations. The results are presented in Fig. 3.
In acidic solutions, at pH < 4.2, the Ti|TiO2 surface is positively charged, while at higher pH values, the number of negatively charged ![[triple bond, length as m-dash]](https://www.rsc.org/images/entities/char_e002.gif) MOz−1 surface groups increases, and the surface potential is negative. The dependence of the surface potential on pH deviates from linearity, which indicates a limited number of surface sites and a relatively large difference in equilibrium constants for surface reactions shown by eqn (1) and (2).
MOz−1 surface groups increases, and the surface potential is negative. The dependence of the surface potential on pH deviates from linearity, which indicates a limited number of surface sites and a relatively large difference in equilibrium constants for surface reactions shown by eqn (1) and (2).
Considering the results presented in Fig. 3 it can be noticed that the slope/response of the Ti|TiO2 electrode is higher at the lower ionic strength. This behaviour is typical for the inner surface and electrokinetic potential and is consistent with the EIL models that describe the dependence of the interfacial potential on the concentration of ions in the solution. Increasing the concentration of ions in the bulk of the solution, and thus in the interfacial layer, leads to shading of the surface charge and a decrease in the inner surface potential.
The inner surface potential of Ti|TiO2 can be compared with the inner surface potential obtained for the unmodified Ti|TiO2(spn), i.e. the TiO2 layer spontaneously formed on titanium,17 and the inner surface potential of various rutile crystal planes.32 The measured inner surface potential is always lower in magnitude compared to the Nernstian potential ΨN, i.e. the parameter α defined in eqn (4) is less than 1. The values of parameter α for different TiO2 surfaces and sodium chloride concentrations are shown in Fig. 4. The surface potentials of the well-defined crystallographic planes of rutile differ from each other and depend on the concentration of sodium chloride. The surface potential values for the Ti|TiO2 surface lie between the values obtained for rutile. This finding can be explained by the fact that the surface of the electrochemically formed TiO2 layer on the titanium surface is amorphous, that is, it consists of particles with different crystal faces, and the measured surface potential is an average value. Interestingly, the α value obtained for the spontaneously formed TiO2 layer on the Ti surface is significantly lower. A significantly thinner oxide layer and a lower surface concentration of charged surface groups can explain this finding.
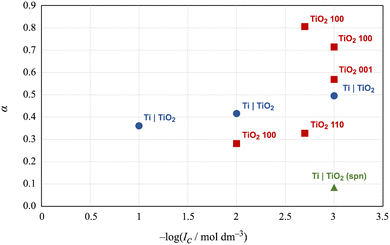 | ||
Fig. 4 Comparison of the α parameter for different TiO2 surfaces obtained by means of TiO2 electrodes and the OCP method: ( ) Ti|TiO2(spn);17 ( ) Ti|TiO2(spn);17 ( ) Ti|TiO2 and ( ) Ti|TiO2 and ( ) rutile (100), (001), and (110) planes.28 ) rutile (100), (001), and (110) planes.28 | ||
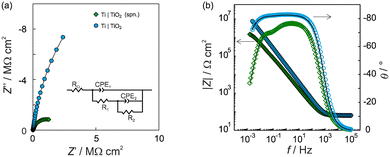
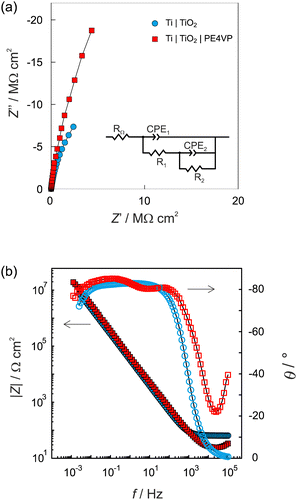
The barrier properties and corrosion behaviour of unmodified Ti, Ti|TiO2(spn), and electrochemically modified Ti|TiO2 samples were tested using electrochemical impedance spectroscopy. The impedance spectra recorded in 0.1 mol dm−3 NaCl electrolyte solution at the open circuit potential, Eoc after 1 hour of stabilization, are presented in the form of Bode and Nyquist plots (Fig. 5).
The TiO2 modified electrode exhibited higher impedance component values and a wider unfinished semi-circle in the Nyquist plot compared to the unmodified titanium electrode covered with a spontaneously formed surface oxide film (Fig. 5a). In the given Bode plot one range higher impedance magnitude values up to 107 Ω cm2 accompanied with phase angle values of approximately −80° over four frequency decades can be observed pointing to what can be attributed to upgraded corrosion behaviour in saline solution compared to an unmodified titanium surface (Fig. 5b).
The obtained EIS data were modelled using EEC, given as an inset in Fig. 5a. Because of the existence of surface microscopic irregularities or surface heterogeneity leading to complex and non-uniform capacitive behaviour (capacitance dispersion), a capacitor, as an impedance ideal element, was depicted by a constant phase element, CPE. The impedance of CPE is equivalent to ZCPE = [Q(jω)n]−1 where Q is the constant of the CPE, n is the CPE exponent determining the degree of non-ideality of the capacitor behavior and ω is the angular frequency.68,69 Taking into account RΩ as the ohmic (electrolyte) resistance, the interfacial capacitance, C, was determined using the relationship according to Brug et al.:70
 | (6) |
Table 2 presents the EIS parameter values determined by EEC model fitting. Both electrified interfaces, Ti|TiO2(spn) and Ti|TiO2 were modelled by employing EEC with two time constants (Fig. 5a). The model applied is consistent with the model of a bi-layered TiO2 film, characterized with a high/medium frequency time constant (R1-CPE1) and low-frequency time constant (R2-CPE2) corresponding to the outer and inner part of the surface TiO2 oxide layer.12,71–74
| Sample | R Ω/Ω cm2 | 106 × Q1/Ω−1 cm−2 sn | n 1 | R 1/MΩ cm2 | C 1/μF cm−2 | 106 × Q2/Ω−1 cm−2 sn | n 2 | R 2/MΩ cm2 | C 2/μF cm−2 |
|---|---|---|---|---|---|---|---|---|---|
| Ti|TiO2(spn) | 62.9 | 16.97 | 0.866 | 0.424 | 5.89 | 6.75 | 0.907 | 1.682 | 3.04 |
| Ti|TiO2 | 64.0 | 5.68 | 0.924 | 12.54 | 2.96 | 0.23 | 0.986 | 27.10 | 0.20 |
The EIS results indicate that both TiO2 oxide layers on the Ti surface (spontaneously and electrochemically formed) consist of two layers, an inner barrier layer associated with higher impedance values and responsible for corrosion protection, and an outer porous layer characterized by lower impedance values and lower compactness.72,73 In more detail, the resistance values of the R2 component are higher than the resistance values of the R1 component ascribed to the inner and outer part of the layer, respectively, so it can be concluded that the inner layer imparts anticorrosion properties. Also, the capacitance C2 values are lower and n2 values are higher than the corresponding capacitance C1 and n1 values corroborating the higher influence of the inner oxide layer to the anticorrosion properties in comparison to the outer oxide layer. The bi-layered film structure was previously reported for the TiO2 oxide film.9,12–14
However, the electrochemically formed TiO2 layer shows one order of range higher resistance component values (R1 and R2) compared to the unmodified titanium covered with a spontaneously formed TiO2 layer. The higher n2 values compared to the unmodified titanium can also be observed, suggesting the formation of a film with a higher compactness level. A lower C2 value points to the formation of a thicker oxide layer as was confirmed by the ellipsometry results previously discussed.
Total corrosion protection of Ti material in the electrolyte medium of interest is governed by polarization resistance, Rp, as the combined result of the resistance components (R1 + R2).75 The Rp values of unmodified (Ti|TiO2(spn)) and modified (Ti|TiO2) samples are equal to 2.106 and 39.640 MΩ cm2, respectively.
The corrosion protection effectiveness of the TiO2 coated Ti surface, η, was determined by:
 | (7) |
The corrosion protection effectiveness value of 94.7% for the electrochemically formed TiO2 coating indicates that the corrosion (barrier) properties were greatly enhanced upon titanium surface modification by the TiO2 oxide layer electrochemically formed by potentiostatic anodization in phosphate buffer solution. In summary, based on the results of electrochemical impedance spectroscopy (increased corrosion resistance and very high protection efficiency), it can be concluded that anodic polarization forms a compact barrier layer with a high charge transfer resistance over the oxide layer|electrolyte solution interface.
Adsorption of PE4VP on the Ti|TiO2 sample
Metallic materials, including titanium and its alloys, are often used in the field of biomedical engineering to produce implants and biomedical devices.2,4,76 Biocompatibility and good corrosion resistance are based on the passive oxide film formed on metal surfaces. However, during long-term exposure to an aggressive environment the film's degradation and corrosion processes can occur, therefore the additional surface modification with organic coatings, such as polyelectrolyte layers, is desirable. Such layers, if oppositely charged compared to the surface itself, are electrostatically bound. In our previous research, we examined a titanium sample coated with poly(diallyldimethylammonium) cation (PDADMA) and poly(4-styrenesulfonate) anion (PSS).17 Both these polymers are strong polyelectrolytes, meaning their degree of ionization is not affected by pH values, and both are used as model polyelectrolytes. The formation of PDADMA and PSS coating on the titanium surface did not significantly influence the surface roughness of the underlying titanium sample but the presence of such a nanofilm increases the corrosion protection effectiveness values, meaning the corrosion properties were improved with the use of the polyelectrolyte coating.In this work, we examined the adsorption of the less investigated poly(N-ethyl-4-vinylpyridinium) bromide onto the Ti|TiO2 surface. The PE4VP was adsorbed on the electrochemically formed Ti|TiO2 surface in the presence of three different concentrations of sodium chloride. Ellipsometry was used to determine the thickness of the PE4VP coating, while tensiometry was used to determine the contact angle of PE4VP-coated Ti|TiO2 samples. The results of these measurements are summarized in Table 3.
| Sample | c(NaCl)/mol dm−3 | d/nm | θ/° |
|---|---|---|---|
| Ti|TiO2 | — | 16.3 ± 1.0 | 64.0 ± 1.1 |
| Ti|TiO2|PE4VP | 0.5 | 1.3 ± 0.1 | 62.4 ± 3.1 |
| 1.0 | 2.3 ± 0.5 | 69.2 ± 1.6 | |
| 2.0 | 0.9 ± 0.1 | 73.4 ± 1.9 |
Deposition of PE4VP on the Ti|TiO2 surface yielded different results depending on the addition of NaCl. At 0.5 mol dm−3 NaCl the adsorbed monolayer had a thickness of (1.3 ± 0.1) nm. Increasing the concentration of NaCl to 1.0 mol dm−3 produced a thicker layer of PE4VP (d = 2.3 nm). Finally, increasing the NaCl concentration to 2.0 mol dm−3 produced a barely detectable layer of PE4VP with a thickness of <1 nm. This result indicates that increasing the NaCl concentration over 1.0 mol dm−3 produces a detrimental effect for successful adsorption of PE4VP.77–79 Most recently, this effect was described on multiple oxide surfaces by Akintola et al.80 They have shown that the adsorption of a polyelectrolyte to an oxide surface can be enhanced by the addition of salt but only up to a certain salt concentration where a maximal amount of adsorbed polyelectrolyte can be detected. After passing the critical salt concentration, the polyelectrolytes desorb from the surface. The severity of this effect depends on the polyelectrolyte, the surface and background salt themselves, but the real cause of this effect is still uncertain.
As the deposited PE4VP coating is only a nanometre to two thick, the effect of the Ti|TiO2 surface on the values of the contact angle is not surprising (Table 3). This explains the very slight deviation in contact angle measurements from the value of the contact angle of the Ti|TiO2 sample itself (θ ≈ 65°), meaning the wettability properties after the addition of PE4VP do not significantly change. This finding is in accordance to the low overall coating's coverage determined from AFM measurements, as described in the following paragraphs.
Fig. 6 presents the Ti|TiO2 surface after the deposition of PE4VP out of 0.05 mol dm−3 solution with different amounts of NaCl added to the polyelectrolyte solution. In Fig. 6a, one can observe no differences between the PE4VP-coated and uncoated titanium sample with the electrochemically formed TiO2 layer presented in Fig. 2. That is in slight disagreement with the ellipsometry results where a 1.3 nm thick film was detected, and will be discussed later. A pronounced change in topography and morphology of the surface was detected for the sample which was dipped in PE4VP solution with 1.0 mol dm−3 NaCl, Fig. 6b. In this case, the Ti|TiO2 surface was covered with specks of different sizes which cover the already mentioned features of the Ti|TiO2 sample itself. This indicates that in these conditions the PE4VP coating was successfully deposited on the surface of the Ti|TiO2 sample. Going to the last image, Fig. 6c, its features are similar to Fig. 6a, and by extent to Fig. 2, which would indicate that no polyelectrolyte was adsorbed on the surface. Furthermore, to confirm our assumptions we analysed the surface roughness by means of AFM (Fig. 7) and correlated the obtained values to the ellipsometry and tensiometry results.
 | ||
| Fig. 6 AFM images of the electrochemically modified Ti|TiO2 surface after adsorption of PE4VP on it in the presence of (a) 0.5 mol dm−3, (b) 1.0 mol dm−3, and (c) 2.0 mol dm−3 NaCl. | ||
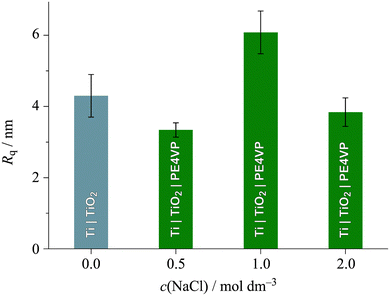 | ||
| Fig. 7 Surface roughness of the unmodified Ti|TiO2 sample and Ti|TiO2 sample coated with PE4VP in the presence of different NaCl concentrations. | ||
As one can see from Fig. 7, the Ti|TiO2 sample and the samples on which PE4VP was deposited from 0.5 and 2.0 mol dm−3 NaCl solutions have similar values of surface roughness, while the 1.0 mol dm−3 NaCl solution gave a coating with more pronounced roughness. Combining these results, surface morphology, Fig. 6, and the fact that ellipsometry results showed a PE4VP thickness <1.5 nm for deposition out of 0.5 and 2.0 mol dm−3 NaCl solutions, one can conclude that the amount of PE4VP deposited to the Ti|TiO2 surface under these conditions is very low. The outlier, deposition of PE4VP in the presence of 1.0 mol dm−3 NaCl solution, has shown the change in surface morphology, Fig. 6b, the increase in value of surface roughness (≈6 nm compared to ≈4 nm of the other samples, including the bare Ti|TiO2 sample) and increased film thickness, Table 3. Furthermore, the calculation of PE4VP coverage of the Ti|TiO2 surface was possible using the bearing analysis in NanoScope Scan 9.7. software, and it was determined to be (23.4 ± 7.0)%. Hence, the polyelectrolyte-coating prepared under these experimental conditions was selected for further EIS measurements.
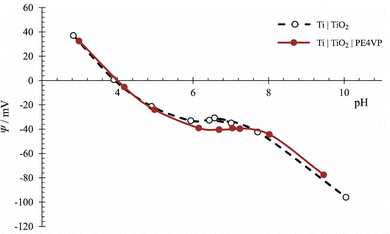
The adsorption and the impact of PE4VP on Ti|TiO2 surface properties was investigated using the OCP method. First, the influence of PE4VP added to the solution in a wide pH range on the measured electrode potential of the Ti|TiO2 electrode was determined. The measurement was done in 0.1 mol dm−3 NaCl aqueous solution because at higher salt concentrations the response of the Ti|TiO2 electrode was reduced. The results are presented in Fig. 8. As can be seen, the polyelectrolyte has an influence on the measured electrode signal in the neutral pH range. To explain these results, it is necessary to consider what happens to polyelectrolyte ions under the measurement conditions. The polyelectrolyte chains are positively charged throughout the pH range. At this ionic strength, as can be speculated from the ellipsometric and AFM measurements, the polymer chains are still partially stretched and do not completely cover the TiO2 surface, but they are not in the conformation to be able to approach the surface and significantly change the inner surface potential. Various reasons can lead to this result. It is possible that PE4VP chains are far from the Ti|TiO2 surface and do not affect significantly the value and sign of the inner surface potential. Another possibility is that the adsorption level of the polyelectrolyte is low, which was also confirmed by AFM measurements. Therefore, in the following experiments, the concentration of PE4VP was increased five times.
Thereby we performed a batch experiment at pH = 10.0 by varying the PE4VP and NaCl concentrations. At this pH, the surface of the Ti|TiO2 sample is negatively charged,66 PE4VP is positively charged, following this, the greatest influence of polyelectrolyte adsorption on the surface potential is expected. The surface potential decreases by increasing the ionic strength, but the effect is even greater on the shape of the polyelectrolyte chains, which aggregate at higher ionic strengths due to weakened electrostatic interactions. The results are presented in Fig. 9.
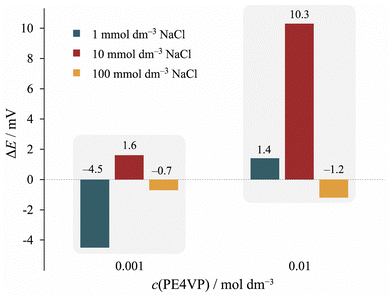 | ||
| Fig. 9 The difference in the measured open circuit potential of uncoated Ti|TiO2 and PE4VP coated Ti|TiO2|PE4VP electrode for different concentrations of sodium chloride and PE4VP at 25 °C. | ||
Again, it should be stressed that the OCP measurements at higher salt concentrations are less sensitive due to reducing the surface potential values. The results presented in Fig. 9 suggest that the surface potential of Ti|TiO2 is affected by the polyelectrolyte concentration as well as the background electrolyte concentration. The greatest effect was obtained at the NaCl concentration of 0.01 mol dm−3 and PE4VP concentration of 0.01 mol dm−3. Under these conditions, there are enough polyelectrolyte chains in a favourable conformation located near the surface.
Corrosion protection effectiveness of the PE4VP coating
The greatest perspective for corrosion protection of Ti|TiO2 was shown by the PE4VP-coating prepared from 1.0 mol dm−3 NaCl. Among the investigated PE4VP coatings, the coating prepared in the presence of 1.0 mol dm−3 NaCl was the thickest and had the highest surface coverage. Therefore, the barrier properties and corrosion behaviour of the Ti|TiO2 sample covered with PE4VP at 1.0 mol dm−3 NaCl were studied by EIS in 0.1 mol dm−3 NaCl electrolyte solution. The impedance data in the form of Bode and Nyquist plots are given in Fig. 10.The PE4VP coating affected the impedance response of the electrified Ti|TiO2 interface. Higher impedance component values in the Nyquist plot (Fig. 10a) and higher impedance magnitude values in the Bode plot (Fig. 10b) can be observed in comparison to the Ti|TiO2 system. The phase angle vs. frequency dependence shows the influence of PE4VP coating formation visible in a wider frequency range of phase angle value over –80°. The phase angle values, impedance parameter sensitive to structural changes, indicate the microstructural transformation of the Ti|TiO2|PE4VP interface after the PE4VP modification of the Ti|TiO2 system also pointing to the improved corrosion behaviour of titanium material in saline electrolyte solution.
As before, the obtained EIS data were modelled employing EEC with two time constants, given in Fig. 10a. Table 4 presents the EIS parameter values determined by EEC model fitting.
| R Ω/Ω cm2 | 106 × Q1/Ω−1 cm−2 sn | n 1 | R 1/MΩ cm2 | C 1/μF cm−2 | 106 × Q2/Ω−1 cm−2 sn | n 2 | R 2/MΩ cm2 | C 2/μF cm−2 | |
|---|---|---|---|---|---|---|---|---|---|
| Ti|TiO2 | 64.0 | 5.68 | 0.924 | 12.54 | 2.96 | 0.23 | 0.986 | 27.10 | 0.20 |
| Ti|TiO2|PE4VP | 57.1 | 3.90 | 0.929 | 0.062 | 2.05 | 0.43 | 0.998 | 139.0 | 0.42 |
The electrochemical behavior of the Ti|TiO2|PE4VP system is governed by the surface coating consisting of PE4VP polyelectrolyte deposited over the electrochemically formed TiO2 layer on the titanium surface. The impedance parameter values determined correspond to the outer and the inner part of the surface film, i.e. high/medium frequency time constant (R1-CPE1) and low-frequency time constant (R2-CPE2) are attributed to the outer and inner part of the surface coating, respectively. The same EEC model approach was utilized previously for titanium materials covered by organic coatings.17,81,82 Since changes were observed in both time constant parameter values, the obtained impedance response is from the surface film. If the PE4VP influence would be reflected only in the high/medium time constant (R1-CPE1), then the outer layer of the film would be assigned to the PE4VP coating itself. According to the resistant component R1 and R2 values it can be concluded that the inner part of the coating formed determines the corrosion resistance of the titanium in the saline electrolyte solution. The Ti|TiO2|PE4VP system shows higher n2 values (close to 1) compared to the Ti|TiO2 system indicating a higher level of compactness of the PE4VP polyelectrolyte-based coating.
The polarization (corrosion) resistance, Rp for Ti|TiO2|PE4VP, determined from R1 and R2 resistance contributions, is equal to 139.06 MΩ cm2. It represents a higher value in comparison to Rp values of Ti|TiO2(spn) and Ti|TiO2 samples equal to 2.106 and 39.640 MΩ cm2, respectively (Table 2). The corrosion protection effectiveness of the PE4VP coating, obtained by using the equations given in Table 5, is 98.5% in reference to unmodified Ti and 71.5% in reference to electrochemically prepared TiO2 coating. Based on the impedance results, the PE4VP coating formation on the TiO2 surface yielded improved barrier properties to the underlying titanium sample.
Conclusions
In this study a titanium sample modified by an electrochemically formed oxide layer (Ti|TiO2) and a Ti|TiO2 sample coated with poly(N-ethyl-4-vinylpyridinium) cations (PE4VP) were studied by means of ellipsometry, tensiometry, and atomic force microscopy. For the purpose of determining the electrical properties of the surface and corrosion protection effectiveness of the electrochemically formed TiO2 layer and TiO2|PE4VP coatings, we applied electrochemical impedance spectroscopy and measurement of the inner surface potential of the Ti|TiO2 electrode.It was shown that the Ti|TiO2 surface is very flat with an average roughness of only 3.4 nm and an oxide layer thickness of 16.1 nm. The inner surface potential for the Ti|TiO2 surface was found to be between the values obtained for the different rutile crystallographic planes, which indicates that the surface of the electrochemically formed TiO2 layer is amorphous, consisting of particles with different crystal faces. The EIS results indicate that spontaneously and electrochemically formed TiO2 layers on the Ti surface consist of two layers, an inner barrier layer associated with higher impedance values and responsible for corrosion protection, and an outer porous layer characterized by lower impedance values and lower compactness. The corrosion protection effectiveness value of 94.7% for electrochemically formed TiO2 coating compared to spontaneously formed TiO2 layers on the Ti surface indicates that anodic polarization forms a compact barrier layer with a high charge transfer resistance at the oxide layer|electrolyte solution interface.
The adsorption of PE4VP on the Ti|TiO2 surface is affected by the polyelectrolyte concentration as well as the background electrolyte concentration. Surface characterization (AFM, ellipsometry, and tensiometry) showed that the best coating was obtained for a NaCl concentration of 1.0 mol dm−3 and a PE4VP concentration of 0.05 mol dm−3.
Because the sensitivity of electrochemical measurements is reduced at higher concentrations of sodium chloride, the effect of NaCl concentration on the inner surface potential of the Ti|TiO2 electrode in the presence of PE4VP was examined at lower NaCl concentrations. The greatest effect was obtained for a NaCl concentration of 0.01 mol dm−3 and a PE4VP concentration of 0.01 mol dm−3. Under these conditions, there are enough polyelectrolyte chains in a favourable conformation located near the surface.
The electrochemical behavior of the Ti|TiO2|PE4VP system is governed by the surface coating consisting of PE4VP and the electrochemically formed TiO2 layer on the titanium surface. Based on the impedance results, the PE4VP coating formation on the TiO2 surface yielded improved barrier properties to the underlying titanium sample. The corrosion protection effectiveness of the PE4VP coating was found to be 71.5% in reference to the electrochemically prepared TiO2 coating.
Surface modification of titanium, first by electrochemically thickening the oxide layer and then by adsorption of PE4VP, facilitates the formation of a stable surface coating consisting of an oxide film and polyelectrolyte-based coating. The PE4VP coating participates in the electron transfer reactions, hindering the corrosion process and protecting the metal from corrosive environments. The results presented provide insight into the optimization of the strong polyelectrolyte cation adsorption process parameters and demonstrate that applying PE4VP coating is a suitable method for surface modification of titanium to enhance corrosion protection in an aggressive environment.
Author contributions
Jozefina Katić: conceptualization, investigation, methodology, writing – original draft; Juraj Nikolić: investigation, methodology, writing – original draft; Tea Juračić: investigation, writing – review & editing; Tin Klačić: investigation, methodology, writing – review & editing; Danijel Namjesnik: software, visualization, writing – review & editing; Tajana Begović: conceptualization, methodology, supervision, writing – original draft.Data availability
Data for this article, including measured values and atomic force microscopy images, are available at the Repository of the Faculty of Science University of Zagreb (Croatia) at https://repozitorij.pmf.unizg.hr/islandora/object/pmf:13001. Additionally, all experimental data are available upon request from the authors.Conflicts of interest
There are no conflicts to declare.Acknowledgements
This study was supported by the Croatian Science Foundation (project POLYMIN2, IP-2020-02-9571) and the European Regional Development Fund (infrastructural project CIuK, KK.01.1.1.02.0016). The authors thank Nikola Cindro for the help with the synthesis of PE4VP as well as Jasmina Jukić, Davor Kovačević, and Karla Korade for valuable discussions and suggestions.References
- M. Geetha, A. K. Singh, R. Asokamani and A. K. Gogia, Prog. Mater. Sci., 2009, 54, 397–425 CrossRef CAS.
- Q. Chen and G. A. Thouas, Mater. Sci. Eng., R, 2015, 87, 1–57 CrossRef.
- X. Liu, P. Chu and C. Ding, Mater. Sci. Eng., R, 2004, 47, 49–121 CrossRef.
- N. Eliaz, Materials, 2019, 12, 407 CrossRef CAS PubMed.
- L. Zhang and L. Chen, Adv. Eng. Mater., 2019, 21, 1801215 CrossRef.
- A. Gao, R. Hang, L. Bai, B. Tang and P. K. Chu, Electrochim. Acta, 2018, 271, 699–718 CrossRef CAS.
- L.-C. Zhang, L.-Y. Chen and L. Wang, Adv. Eng. Mater., 2020, 22, 1901258 CrossRef CAS.
- J. Alipal, T. C. Lee, P. Koshy, H. Z. Abdullah and M. I. Idris, Heliyon, 2021, 7, e07408 CrossRef CAS.
- J.-F. Vanhumbeeck and J. Proost, Corros. Rev., 2009, 27, 117–204 CAS.
- J. Pouilleau, D. Devilliers, F. Garrido, S. Durand-Vidal and E. Mahé, Mater. Sci. Eng. B, 1997, 47, 235–243 CrossRef.
- S. Kudelka, A. Michaelis and J. W. Schultze, Electrochim. Acta, 1996, 41, 863–870 CrossRef CAS.
- J.-H. Xing, Z.-B. Xia, J.-F. Hu, Y.-H. Zhang and L. Zhong, J. Electrochem. Soc., 2013, 160, C239–C246 CrossRef CAS.
- R. Menini, M.-J. Dion, S. K. V. So, M. Gauthier and L.-P. Lefebvre, J. Electrochem. Soc., 2006, 153, B13 CrossRef CAS.
- Z. Jiang, X. Dai and H. Middleton, Mater. Chem. Phys., 2011, 126, 859–865 CrossRef CAS.
- E. McCafferty and J. Wightman, Appl. Surf. Sci., 1999, 143, 92–100 CrossRef CAS.
- Y. Z. Huang and D. J. Blackwood, Electrochim. Acta, 2005, 51, 1099–1107 CrossRef CAS.
- T. Klačić, J. Katić, D. Namjesnik, J. Jukić, D. Kovačević and T. Begović, Minerals, 2021, 11, 1164 CrossRef.
- T. R. Farhat and J. B. Schlenoff, Electrochem. Solid-State Lett., 2002, 5, B13 CrossRef CAS.
- D. V. Andreeva, E. V. Skorb and D. G. Shchukin, ACS Appl. Mater. Interfaces, 2010, 2, 1954–1962 CrossRef CAS.
- M. Khaled, B. Abu-Sharkh, E. Amr, B. S. Yilbas, A. Manda and A. Abulkibash, Corros. Eng. Sci. Technol., 2007, 42, 356–362 CrossRef CAS.
- D. V. Andreeva, D. Fix, H. Möhwald and D. G. Shchukin, J. Mater. Chem., 2008, 18, 1738 RSC.
- Y. Duan, Y. Wu, R. Yan, M. Lin, S. Sun and H. Ma, Prog. Org. Coatings, 2021, 155, 106232 CrossRef CAS.
- Surface Complexation Modelling, ed. J. Lützenkirchen, Academic Press, Amsterdam, London, 1st edn, 2006, vol. 11 Search PubMed.
- M. Szekeres and E. Tombácz, Colloids Surf., A, 2012, 414, 302–313 CrossRef CAS.
- W. H. Van Riemsdijk, G. H. Bolt, L. K. Koopal and J. Blaakmeer, J. Colloid Interface Sci., 1986, 109, 219–228 CrossRef CAS.
- N. Kallay, T. Preočanin, D. Kovačević, J. Lützenkirchen and E. Chibowski, Croat. Chem. Acta, 2010, 83, 357–370 CAS.
- G. Gonella, E. H. G. Backus, Y. Nagata, D. J. Bonthuis, P. Loche, A. Schlaich, R. R. Netz, A. Kühnle, I. T. McCrum, M. T. M. Koper, M. Wolf, B. Winter, G. Meijer, R. K. Campen and M. Bonn, Nat. Rev. Chem., 2021, 5, 466–485 CrossRef CAS PubMed.
- T. Preočanin, D. Namjesnik, M. A. Brown and J. Lützenkirchen, Environ. Chem., 2017, 14, 295 CrossRef.
- K. Shimizu and J.-F. Boily, J. Phys. Chem. C, 2015, 119, 5988–5994 CrossRef CAS.
- N. Kallay and T. Preočanin, J. Colloid Interface Sci., 2008, 318, 290–295 CrossRef CAS.
- J. Lützenkirchen, F. Heberling, F. Šupljika, T. Preočanin, N. Kallay, F. Johann, L. Weisser and P. J. Eng, Faraday Discuss., 2015, 180, 55–79 RSC.
- J. Jukić, T. Juračić, E. Josić, D. Namjesnik and T. Begović, Adsorption, 2024, 30, 251–264 CrossRef.
- T. Klačić, A. Sadžak, J. Jukić, T. Preočanin and D. Kovačević, Colloids Surf., A, 2019, 570, 32–38 CrossRef.
- J. Saranya, M. Sowmiya, P. Sounthari, K. Parameswari, S. Chitra and K. Senthilkumar, J. Mol. Liq., 2016, 216, 42–52 CrossRef CAS.
- C. Verma, E. E. Ebenso and M. A. Quraishi, J. Mol. Liq., 2017, 248, 927–942 CrossRef CAS.
- C. Verma, M. H. Abdellattif, A. Alfantazi and M. A. Quraishi, J. Mol. Liq., 2021, 340, 117211 CrossRef CAS.
- C. Verma and M. A. Quraishi, Corros. Rev., 2022, 40, 221–236 CrossRef CAS.
- A. Dehghani, E. Berdimurodov, C. Verma, D. K. Verma, K. Berdimuradov, M. A. Quraishi and N. Aliev, Chem. Pap., 2024, 78, 1367–1397 CrossRef CAS.
- J. Wang, L. An, J. Wang, J. Gu, J. Sun and X. Wang, Adv. Colloid Interface Sci., 2023, 321, 103031 CrossRef CAS.
- A. Chetouani, K. Medjahed, K. E. Benabadji, B. Hammouti, S. Kertit and A. Mansri, Prog. Org. Coatings, 2003, 46, 312–316 CrossRef CAS.
- A. Chetouani, K. Medjahed, K. E. Sid-Lakhdar, B. Hammouti, M. Benkaddour and A. Mansri, Corros. Sci., 2004, 46, 2421–2430 CrossRef CAS.
- Y. Abed, Z. Arrar, B. Hammouti, M. Taleb, S. Kertit and A. Mansri, Anti-Corrosion Methods Mater., 2001, 48, 304–308 CrossRef CAS.
- L. Larabi, Y. Harek, M. Traisnel and A. Mansri, J. Appl. Electrochem., 2004, 34, 833–839 CrossRef CAS.
- S. Belkaid, K. Tebbji, A. Mansri, A. Chetouani and B. Hammouti, Res. Chem. Intermed., 2012, 38, 2309–2325 CrossRef CAS.
- S. Y. Mosavian, Z. Hamidi, N. Sabbaghi, M. Shahabi, M. Noroozifar, M. A. Karimi Zarchi and H. Raissi, Polym. Bull., 2023, 80, 7569–7598 CrossRef CAS.
- C. Das, E. Kastania, J. Witt and O. Ozcan, Mater. Corros., 2022, 73, 427–435 CrossRef CAS.
- L. Pawłowski, M. Rościszewska, B. Majkowska-Marzec, M. Jażdżewska, M. Bartmański, A. Zieliński, N. Tybuszewska and P. Samsel, Materials, 2022, 15, 7556 CrossRef.
- L. Pawłowski, M. Bartmański, A. Ronowska, A. Banach-Kopeć, S. Mania, B. M. Cieślik, A. Mielewczyk-Gryń, J. Karczewski and A. Zieliński, J. Biomed. Mater. Res. Part B Appl. Biomater., 2024, 112, e35332 CrossRef.
- Y. Wang, V. Kozlovskaya, I. G. Arcibal, D. M. Cropek and E. Kharlampieva, Soft Matter, 2013, 9, 9420 RSC.
- J. Raczkowska, Y. Stetsyshyn, K. Awsiuk, J. Zemła, A. Kostruba, K. Harhay, M. Marzec, A. Bernasik, O. Lishchynskyi, H. Ohar and A. Budkowski, RSC Adv., 2016, 6, 87469–87477 RSC.
- G. Behzadi Pour, H. Nazarpour Fard, L. Fekri Aval and P. Esmaili, Ionics, 2020, 26, 549–563 CrossRef CAS.
- M. Hernández-Orta, E. Pérez, L. E. Cruz-Barba and M. A. Sánchez-Castillo, J. Mater. Sci., 2018, 53, 8766–8785 CrossRef.
- K. Mavronasou, A. Zamboulis, P. Klonos, A. Kyritsis, D. N. Bikiaris, R. Papadakis and I. Deligkiozi, Polymers, 2022, 14, 804 CrossRef CAS PubMed.
- A. A. Yaroslavov, V. Y. Kul’kov, A. A. Efimova and M. O. Ignatiev, Thin Solid Films, 1995, 265, 66–70 CrossRef CAS.
- J. A. Zakharova, M. V. Otdelnova, E. M. Ivleva, V. A. Kasaikin, A. B. Zezin and V. A. Kabanov, Polymer, 2007, 48, 220–228 CrossRef CAS.
- L. Z. Ren and L. J. Meng, Exp. Polym. Lett., 2008, 2, 251–255 CrossRef CAS.
- J. Jukić, D. Kovačević, N. Cindro, R. Fink, M. Oder, A.-M. Milisav and J. Požar, Soft Matter, 2022, 18, 744–754 RSC.
- T. Preočanin, D. Namjesnik, T. Klačić and P. Šutalo, Croat. Chem. Acta, 2017, 90, 333–344 CrossRef.
- P. E. Ciddor, Appl. Opt., 1996, 35, 1566 CrossRef CAS PubMed.
- S. Sarkar, V. Gupta, M. Kumar, J. Schubert, P. T. Probst, J. Joseph and T. A. F. König, ACS Appl. Mater. Interfaces, 2019, 11, 13752–13760 CrossRef CAS.
- P. Johnson and R. Christy, Phys. Rev. B: Solid State, 1974, 9, 5056–5070 CrossRef CAS.
- N. Huo and W. E. Tenhaeff, Macromolecules, 2023, 56, 2113–2122 CrossRef CAS.
- A. W. Neumann and R. J. Good, Surface and Colloid Science, Springer US, Boston, MA, 1979, pp. 31–91 Search PubMed.
- O. I. de. Rio and A. W. Neumann, J. Colloid Interface Sci., 1997, 196, 136–147 CrossRef.
- B. Boukamp, Solid State Ionics, 1986, 20, 31–44 CrossRef CAS.
- S. Roessler, R. Zimmermann, D. Scharnweber, C. Werner and H. Worch, Colloids Surf., B, 2002, 26, 387–395 CrossRef CAS.
- R. Wang, K. Hashimoto, A. Fujishima, M. Chikuni, E. Kojima, A. Kitamura, M. Shimohigoshi and T. Watanabe, Nature, 1997, 388, 431–432 CrossRef CAS.
- M. E. Orazem and B. Tribollet, Electrochemical Impedance Spectroscopy, John Wiley & Sons, Inc., Hoboken, NJ, USA, 2008, pp. 233–263 Search PubMed.
- J.-B. Jorcin, M. E. Orazem, N. Pébère and B. Tribollet, Electrochim. Acta, 2006, 51, 1473–1479 CrossRef CAS.
- G. J. Brug, A. L. G. van den Eeden, M. Sluyters-Rehbach and J. H. Sluyters, J. Electroanal. Chem. Interfacial Electrochem., 1984, 176, 275–295 CrossRef CAS.
- S. L. de Assis, S. Wolynec and I. Costa, Electrochim. Acta, 2006, 51, 1815–1819 CrossRef.
- S. Tamilselvi, R. Murugaraj and N. Rajendran, Mater. Corros., 2007, 58, 113–120 CrossRef CAS.
- J. Katić, A. Šarić, I. Despotović, N. Matijaković, M. Petković and Ž. Petrović, Coatings, 2019, 9, 612 CrossRef.
- Ž. Petrović, J. Katić, A. Šarić, I. Despotović, N. Matijaković, D. Kralj, M. Leskovac and M. Petković, Innov. Corros. Mater. Sci., 2020, 10, 37–46 Search PubMed.
- J. R. Scully, Corrosion, 2000, 56, 199–218 CrossRef CAS.
- M. Kaur and K. Singh, Mater. Sci. Eng., C, 2019, 102, 844–862 CrossRef CAS PubMed.
- N. G. Hoogeveen, M. A. C. Stuart and G. J. Fleer, J. Colloid Interface Sci., 1996, 182, 133–145 CrossRef CAS.
- V. Shubin, J. Colloid Interface Sci., 1997, 191, 372–377 CrossRef CAS PubMed.
- S. A. Sukhishvili and S. Granick, J. Chem. Phys., 1998, 109, 6861–6868 CrossRef CAS.
- J. Akintola, S. Abou Shaheen, Q. Wu and J. B. Schlenoff, Langmuir, 2024, 40, 3783–3792 CAS.
- Ž. Petrović, A. Šarić, I. Despotović, J. Katić, R. Peter, M. Petravić and M. Petković, Materials, 2020, 13, 3220 CrossRef PubMed.
- Ž. Petrović, A. Šarić, I. Despotović, J. Katić, R. Peter, M. Petravić, M. Ivanda and M. Petković, Materials, 2022, 15, 5127 CrossRef.
| This journal is © The Royal Society of Chemistry 2024 |

